The pattern of expression and prognostic value of key regulators for m7G RNA methylation in hepatocellular carcinoma
- PMID: 36118897
- PMCID: PMC9478798
- DOI: 10.3389/fgene.2022.894325
The pattern of expression and prognostic value of key regulators for m7G RNA methylation in hepatocellular carcinoma
Abstract
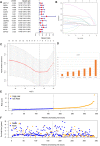
N7-methylguanosine (m7G) modification on internal RNA positions plays a vital role in several biological processes. Recent research shows m7G modification is associated with multiple cancers. However, in hepatocellular carcinoma (HCC), its implications remain to be determined. In this place, we need to interrogate the mRNA patterns for 29 key regulators of m7G RNA modification and assess their prognostic value in HCC. Initial, the details from The Cancer Genome Atlas (TCGA) database concerning transcribed gene data and clinical information of HCC patients were inspected systematically. Second, according to the mRNA profiles of 29 m7G RNA methylation regulators, two clusters (named 1 and 2, respectively) were identified by consensus clustering. Furthermore, robust risk signature for seven m7G RNA modification regulators was constructed. Last, we used the Gene Expression Omnibus (GEO) dataset to validate the prognostic associations of the seven-gene risk signature. We figured out that 24/29 key regulators of m7G RNA modification varied remarkably in their grades of expression between the HCC and the adjacent tumor control tissues. Cluster one compared with cluster two had a substandard prognosis and was also positively correlated with T classification (T), pathological stage, and vital status (fustat) significantly. Consensus clustering results suggested the expression pattern of m7G RNA modification regulators was correlated with the malignancy of HCC strongly. In addition, cluster one was extensively enriched in metabolic-related pathways. Seven optimal genes (METTL1, WDR4, NSUN2, EIF4E, EIF4E2, NCBP1, and NCBP2) were selected to establish the risk model for HCC. Indicating by further analyses and validation, the prognostic model has fine anticipating command and this probability signature might be a self supporting presage factor for HCC. Finally, a new prognostic nomogram based on age, gender, pathological stage, histological grade, and prospects were established to forecast the prognosis of HCC patients accurately. In essence, we detected association of HCC severity and expression levels of m7G RNA modification regulators, and developed a risk score model for predicting prognosis of HCC patients' progression.
Keywords: bioinformatics; hepatocellular carcinoma; m7G; prognosis; risk signature.
Copyright © 2022 Chen, Yao, Sun, Wang, Yue, Cui, Yu, Xu and Li.
Conflict of interest statement
The authors declare that the research was conducted in the absence of any commercial or financial relationships that could be construed as a potential conflict of interest.
Figures


Similar articles
-
Construction of m7G RNA modification-related prognostic model and prediction of immune therapy response in hepatocellular carcinoma.Transl Cancer Res. 2024 Jun 30;13(6):2799-2811. doi: 10.21037/tcr-24-22. Epub 2024 Jun 27. Transl Cancer Res. 2024. PMID: 38988942 Free PMC article.
-
Expression Pattern and Prognostic Value of Key Regulators for m6A RNA Modification in Hepatocellular Carcinoma.Front Med (Lausanne). 2020 Sep 16;7:556. doi: 10.3389/fmed.2020.00556. eCollection 2020. Front Med (Lausanne). 2020. PMID: 33072775 Free PMC article.
-
Expression patterns and prognostic value of key regulators associated with m7G RNA modification based on all gene expression in colon adenocarcinoma.BMC Gastroenterol. 2023 Jan 21;23(1):22. doi: 10.1186/s12876-023-02657-y. BMC Gastroenterol. 2023. PMID: 36681801 Free PMC article.
-
The role of RNA modification in hepatocellular carcinoma.Front Pharmacol. 2022 Sep 2;13:984453. doi: 10.3389/fphar.2022.984453. eCollection 2022. Front Pharmacol. 2022. PMID: 36120301 Free PMC article. Review.
-
When N7-methyladenosine modification meets cancer: Emerging frontiers and promising therapeutic opportunities.Cancer Lett. 2023 May 28;562:216165. doi: 10.1016/j.canlet.2023.216165. Epub 2023 Apr 5. Cancer Lett. 2023. PMID: 37028699 Review.
Cited by
-
Basement membrane-related regulators for prediction of prognoses and responses to diverse therapies in hepatocellular carcinoma.BMC Med Genomics. 2023 Apr 20;16(1):81. doi: 10.1186/s12920-023-01504-z. BMC Med Genomics. 2023. PMID: 37081465 Free PMC article.
-
Overexpression of tRNA m7G modification methyltransferase complex promotes the biosynthesis of triterpene in yeast.Front Microbiol. 2025 Mar 31;16:1557443. doi: 10.3389/fmicb.2025.1557443. eCollection 2025. Front Microbiol. 2025. PMID: 40231236 Free PMC article.
-
Genes Modulating Butyrate Metabolism for Assessing Clinical Prognosis and Responses to Systematic Therapies in Hepatocellular Carcinoma.Biomolecules. 2022 Dec 27;13(1):52. doi: 10.3390/biom13010052. Biomolecules. 2022. PMID: 36671437 Free PMC article.
-
METTL1 mediated tRNA m7G modification promotes leukaemogenesis of AML via tRNA regulated translational control.Exp Hematol Oncol. 2024 Jan 24;13(1):8. doi: 10.1186/s40164-024-00477-8. Exp Hematol Oncol. 2024. PMID: 38268051 Free PMC article.
-
Functions of METTL1/WDR4 and QKI as m7G modification - related enzymes in digestive diseases.Front Pharmacol. 2025 Jan 9;15:1491763. doi: 10.3389/fphar.2024.1491763. eCollection 2024. Front Pharmacol. 2025. PMID: 39850560 Free PMC article. Review.
References
LinkOut - more resources
Full Text Sources
Miscellaneous

