. 2023 Feb:147:106652.
doi: 10.1016/j.jbankfin.2022.106652. Epub 2022 Sep 11.

On the importance of fiscal space: Evidence from short sellers during the COVID-19 pandemic

Affiliations

On the importance of fiscal space: Evidence from short sellers during the COVID-19 pandemic

Stefan Greppmair et al. J Bank Financ. 2023 Feb.

Abstract

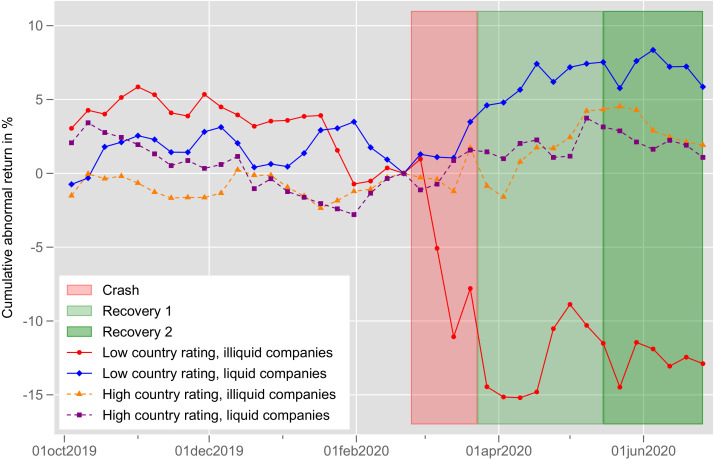
Using the exogenous shock of the COVID-19 pandemic, we study how informed market participants incorporate fiscal space into their trading decisions. At the onset of the pandemic, short-selling activity shifted towards companies with low financial flexibility but only in countries with limited fiscal space. Among such companies, short sellers specifically targeted those that generate their revenues mainly in the domestic market. These short sellers entered their positions before the market crash, thereby generating significant abnormal returns. We find no evidence of either herding behavior prior to the market crash or a long-run performance reversal of short sellers. These findings support the notion that short sellers help to promote price efficiency in times of crisis, where governments with budgetary constraints are unable to provide sufficient stimuli to their economies.

Keywords: COVID-19 pandemic; Fiscal space; Institutional investors; Short selling.


Figures

Fig. 1
Fig. 1
Relative change of disclosed short positions in liquid and illiquid companies during the COVID-19 crisis. This figure shows the relative change of disclosed short positions (in percent) for companies with different degrees of liquidity that are either domiciled in countries with a low credit rating (Panel A) or a high credit rating (Panel B). The percentage change is calculated relative to the average number of disclosed positions in the week December 15 – December 22, 2019. We split the sample of firms using the median of the industry-adjusted quick ratio as the break point. The median value is calculated using the entire universe of companies of sample countries as outlined in Section 2. For each group the figure plots the weekly average number of disclosed short positions at the end of each business week (i.e. Friday). The area shaded in red indicates the market crash period (February 24 – March 23, 2020), the area shaded in light green indicates the first market recovery period (March 24 – May 17, 2020), and the area shaded in dark green indicates the second market recovery period (May 18 – June 26, 2020). The sample period is June 01, 2019 - June 26, 2020.. (For interpretation of the references to colour in this figure legend, the reader is referred to the web version of this article.)
Fig. 2
Fig. 2
Timing of short sellers’ trading strategy. This figure displays the coefficient of the triple interaction D(Week)×D(Lowcountryrating)×Companyilliquidity for the period December 16, 2019 to June 26, 2020. We plot each coefficient with a 90% confidence interval for each week. The reference period is July 1, 2019 to December 15, 2019. Dashed vertical lines mark major events in the COVID-19 pandemic: On 31 December 2019, China reports to the WHO cases of pneumonia of unknown cause detected in Wuhan City; on 30 January 2020 the WHO declares the outbreak a Public Health Emergency of International Concern (PHEIC); 24 February 2020 marks the beginning of the stock crash; on 17/18 March 2020 comprehensive short-selling bans came into force in six countries (Austria, Belgium, France, Greece, Italy, and Spain), which all were lifted on 18 May 2020. May 18 marks also the announcement of the French-German initiative for a EU Recovery Fund. The area shaded in red indicates the market crash period (February 24 – March 23, 2020), the area shaded in light green indicates the first market recovery period (March 24 – May 17, 2020), and the area shaded in dark green indicates the second market recovery period (May 18 – June 26, 2020). (For interpretation of the references to colour in this figure legend, the reader is referred to the web version of this article.)
Fig. 3
Fig. 3
Performance of shorted stocks during the COVID-19 pandemic. This figure shows the cumulative abnormal returns of stocks with large short positions around the market crash associated with the COVID-19 pandemic. We first split the universe of stocks into 2×2 portfolios using an independent double sort, based on the median of Companyilliquidity and the dummy variable D(Lowcountryrating). For each group, we include the corresponding stocks in the portfolio if there is a large short positions and we then form value-weighted portfolios. To compute the portfolios’ abnormal return we run a time-series regression using the Fama-French five-factor model augmented by the momentum factor. The figure plots the cumulative abnormal return of the four portfolios using weekly updates and February 21, 2020 as the reference point. The area shaded in red indicates the market crash period (February 24 – March 23, 2020), the area shaded in light green indicates the first market recovery period (March 24 – May 17, 2020), and the area shaded in dark green indicates the second market recovery period (May 18 – June 26, 2020). The sample period is October 2019 to June 2020. (For interpretation of the references to colour in this figure legend, the reader is referred to the web version of this article.)

References

    1. Acharya V.V., Steffen S. The risk of being a fallen angel and the corporate dash for cash in the midst of COVID. Rev. Corp. Finance Stud. 2020;9(3):430–471. doi: 10.1093/rcfs/cfaa013. - DOI
    1. Ackermann C., McEnally R., Ravenscraft D. The performance of hedge funds: risk, return, and incentives. J. Financ. 1999;54(3):833–874. doi: 10.1111/0022-1082.00129. - DOI
    1. Akbas F., Armstrong W.J., Sorescu S., Subrahmanyam A. Smart money, dumb money, and capital market anomalies. J. Financ. Econ. 2015;118(2):355–382.
    1. Alessi L., Ossola E., Panzica R. What greenium matters in the stock market? The role of greenhouse gas emissions and environmental disclosures. J. Financ. Stab. 2021;54:100869.
    1. Aizenman, J., Jinjarak, Y., 2010. De facto fiscal space and fiscal stimulus: definition and assessment. Working Paper 16539. NBER. doi:10.3386/w16539

LinkOut - more resources