

Comprehensive analysis of fatty acid and lactate metabolism-related genes for prognosis value, immune infiltration, and therapy in osteosarcoma patients
- PMID: 36119478
- PMCID: PMC9478861
- DOI: 10.3389/fonc.2022.934080
Comprehensive analysis of fatty acid and lactate metabolism-related genes for prognosis value, immune infiltration, and therapy in osteosarcoma patients
Abstract
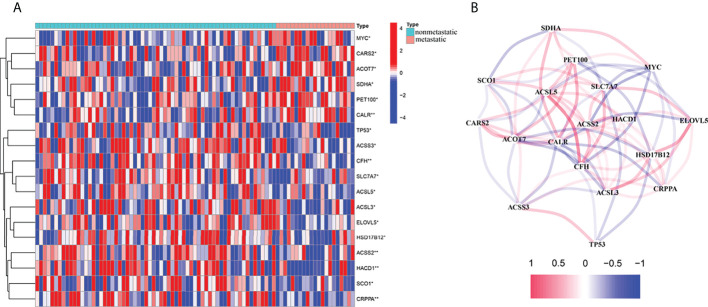
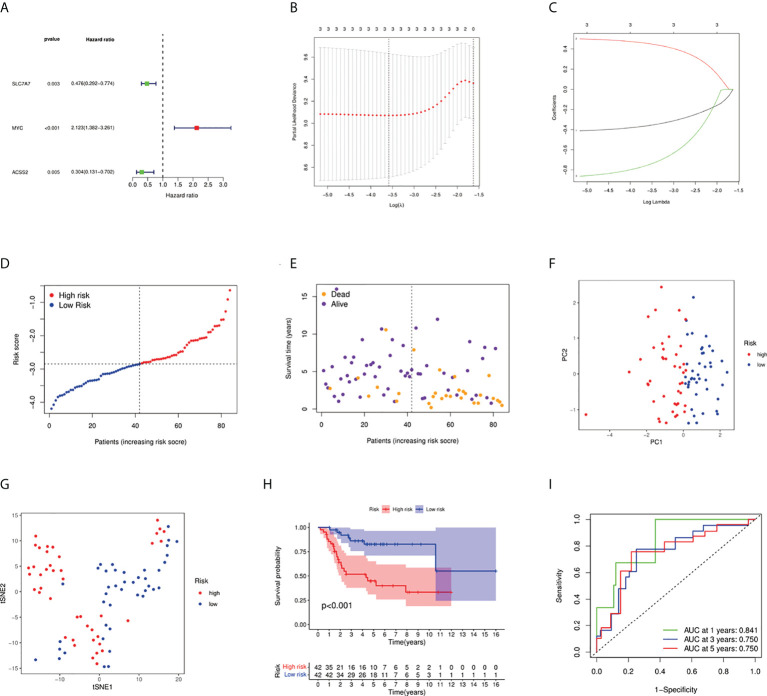
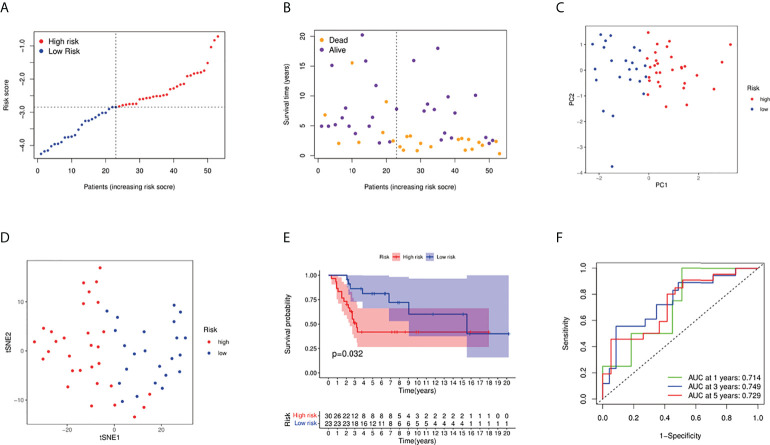
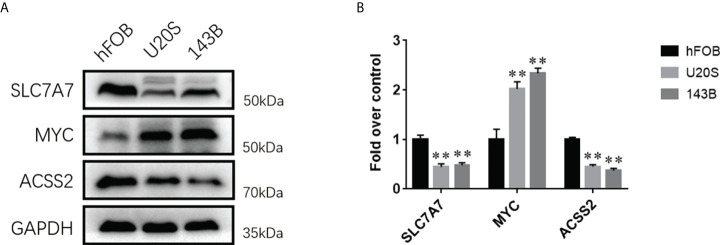
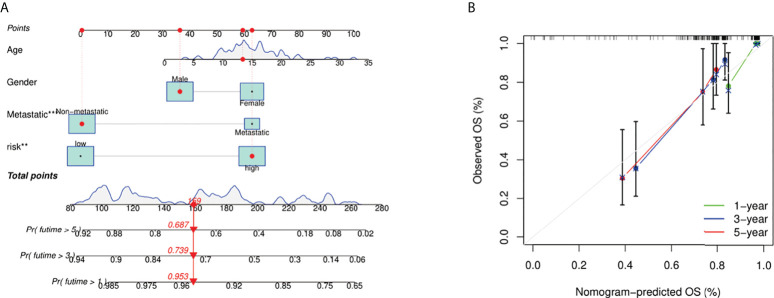
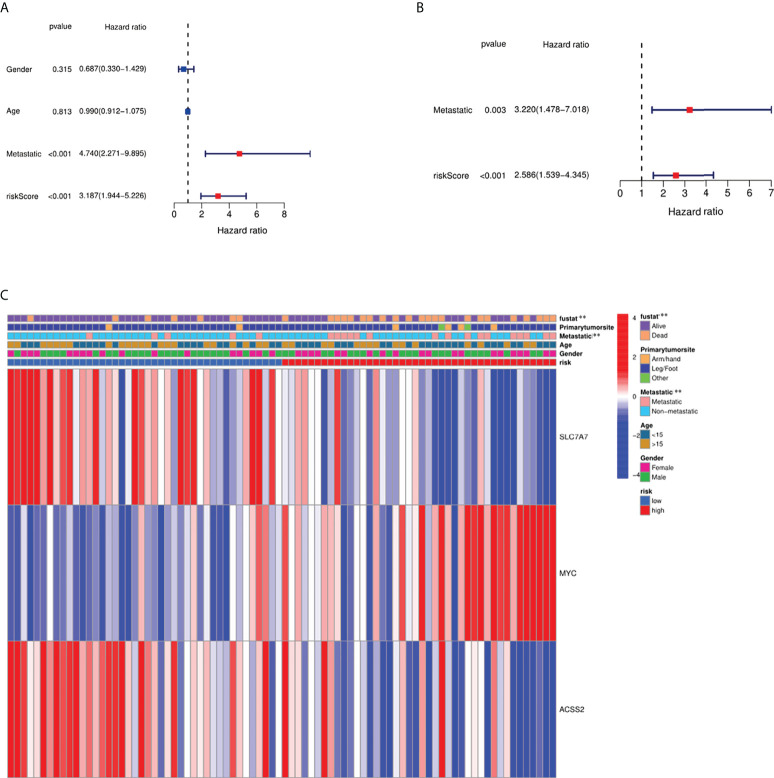
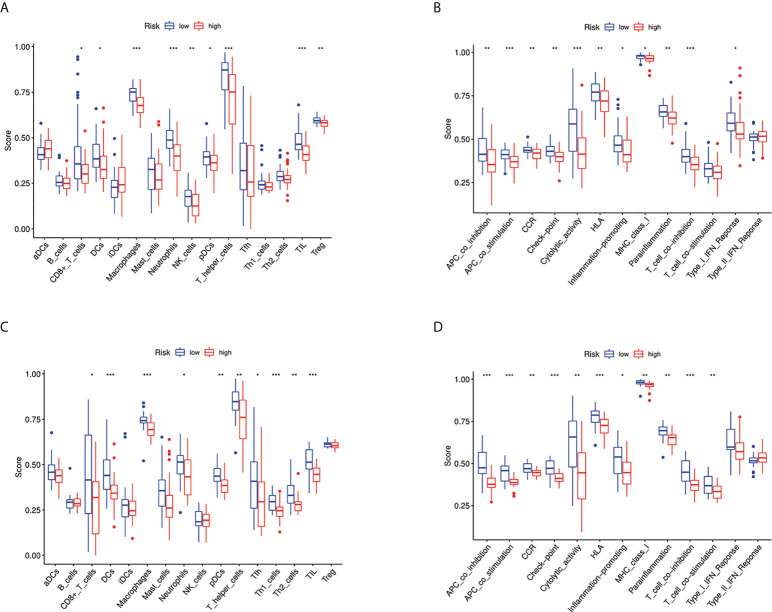
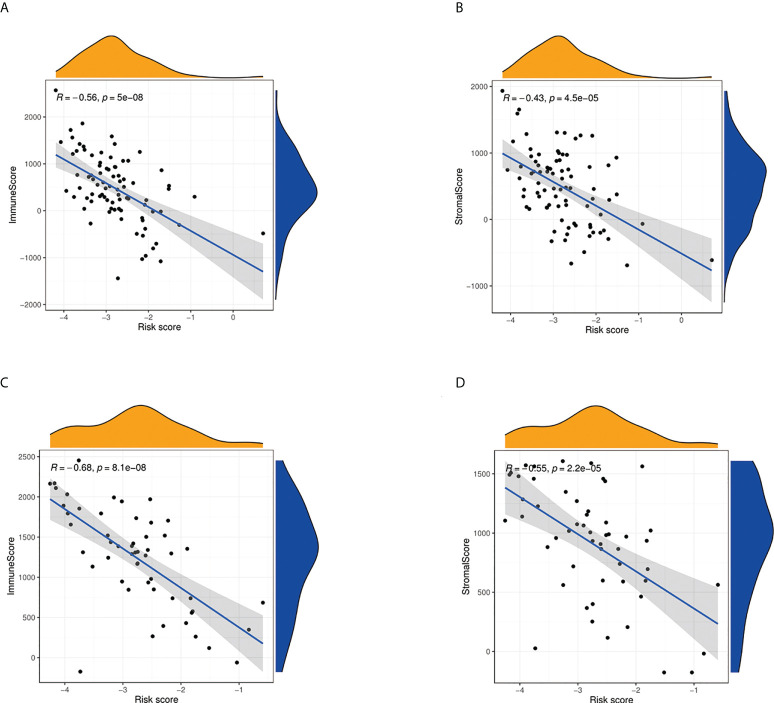
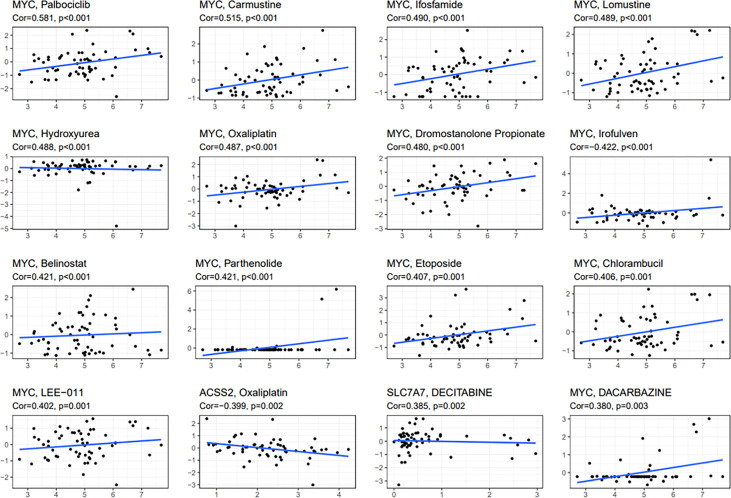
Osteosarcoma is the most frequent bone tumor. Notwithstanding that significant medical progress has been achieved in recent years, the 5-year overall survival of osteosarcoma patients is inferior. Regulation of fatty acids and lactate plays an essential role in cancer metabolism. Therefore, our study aimed to comprehensively assess the fatty acid and lactate metabolism pattern and construct a fatty acid and lactate metabolism-related risk score system to predict prognosis in osteosarcoma patients. Clinical data and RNA expression data were downloaded from the Therapeutically Applicable Research to Generate Effective Treatments (TARGET) and Gene Expression Omnibus (GEO) databases. We used the least absolute shrinkage and selection operator (LASSO) and Cox regression analyses to construct a prognostic risk score model. Relationships between the risk score model and age, gender, tumor microenvironment characteristics, and drug sensitivity were also explored by correlation analysis. We determined the expression levels of prognostic genes in osteosarcoma cells via Western blotting. We developed an unknown fatty acid and lactate metabolism-related risk score system based on three fatty acid and lactate metabolism-related genes (SLC7A7, MYC, and ACSS2). Survival analysis showed that osteosarcoma patients in the low-risk group were likely to have a better survival time than those in the high-risk group. The area under the curve (AUC) value shows that our risk score model performs well in predicting prognosis. Elevated fatty acids and lactate risk scores weaken immune function and the environment of the body, which causes osteosarcoma patients' poor survival outcomes. In general, the constructed fatty acid and lactate metabolism-related risk score model can offer essential insights into subsequent mechanisms in available research. In addition, our study may provide rational treatment strategies for clinicians based on immune correlation analysis and drug sensitivity in the future.
Keywords: fatty acid metabolism; immunity; lactate metabolism; metastasis; osteosarcoma; prognosis.
Copyright © 2022 Wu, Han, Su, Xuan and Wang.
Conflict of interest statement
The authors declare that the research was conducted in the absence of any commercial or financial relationships that could be construed as a potential conflict of interest.
Figures

Similar articles
-
The hexosamine biosynthesis pathway-related gene signature correlates with immune infiltration and predicts prognosis of patients with osteosarcoma.Front Immunol. 2022 Oct 6;13:1028263. doi: 10.3389/fimmu.2022.1028263. eCollection 2022. Front Immunol. 2022. PMID: 36275679 Free PMC article.
-
Comprehensive analysis of hypoxia-related genes for prognosis value, immune status, and therapy in osteosarcoma patients.Front Pharmacol. 2023 Jan 6;13:1088732. doi: 10.3389/fphar.2022.1088732. eCollection 2022. Front Pharmacol. 2023. PMID: 36686667 Free PMC article.
-
Identification and characterization of aging/senescence-induced genes in osteosarcoma and predicting clinical prognosis.Front Immunol. 2022 Oct 5;13:997765. doi: 10.3389/fimmu.2022.997765. eCollection 2022. Front Immunol. 2022. PMID: 36275664 Free PMC article.
-
Signature constructed by glycolysis-immune-related genes can predict the prognosis of osteosarcoma patients.Invest New Drugs. 2022 Aug;40(4):818-830. doi: 10.1007/s10637-022-01228-4. Epub 2022 Apr 18. Invest New Drugs. 2022. PMID: 35435626 Review.
-
Managing the immune microenvironment of osteosarcoma: the outlook for osteosarcoma treatment.Bone Res. 2023 Feb 27;11(1):11. doi: 10.1038/s41413-023-00246-z. Bone Res. 2023. PMID: 36849442 Free PMC article. Review.
Cited by
-
Dissecting the role of lactate metabolism LncRNAs in the progression and immune microenvironment of osteosarcoma.Transl Oncol. 2023 Oct;36:101753. doi: 10.1016/j.tranon.2023.101753. Epub 2023 Aug 6. Transl Oncol. 2023. PMID: 37549606 Free PMC article.
-
Advances in prognostic models for osteosarcoma risk.Heliyon. 2024 Mar 26;10(7):e28493. doi: 10.1016/j.heliyon.2024.e28493. eCollection 2024 Apr 15. Heliyon. 2024. PMID: 38586328 Free PMC article. Review.
-
Decoding Osteosarcoma's Lactylation Gene Expression: Insights Into Prognosis, Immune Dynamics, and Treatment.Anal Cell Pathol (Amst). 2025 Feb 21;2025:6517238. doi: 10.1155/ancp/6517238. eCollection 2025. Anal Cell Pathol (Amst). 2025. PMID: 40026531 Free PMC article.
-
Lipid metabolic reprogramming and associated ferroptosis in osteosarcoma: From molecular mechanisms to potential targets.J Bone Oncol. 2025 Jan 26;51:100660. doi: 10.1016/j.jbo.2025.100660. eCollection 2025 Apr. J Bone Oncol. 2025. PMID: 39958756 Free PMC article. Review.
-
Multifunctional nanomaterials via cell cuproptosis and oxidative stress for treating osteosarcoma and OS-induced bone destruction.Mater Today Bio. 2024 Feb 15;25:100996. doi: 10.1016/j.mtbio.2024.100996. eCollection 2024 Apr. Mater Today Bio. 2024. PMID: 38420143 Free PMC article.
References
LinkOut - more resources
Full Text Sources