

Global, regional, and national neck pain burden in the general population, 1990-2019: An analysis of the global burden of disease study 2019
- PMID: 36119688
- PMCID: PMC9477009
- DOI: 10.3389/fneur.2022.955367
Global, regional, and national neck pain burden in the general population, 1990-2019: An analysis of the global burden of disease study 2019
Abstract
Background: This study describes the global epidemiology and trends associated with neck pain. Global Burden of Disease data collected between 1990 and 2019 were used to determine the global burden of neck pain in the general populations of 204 countries.
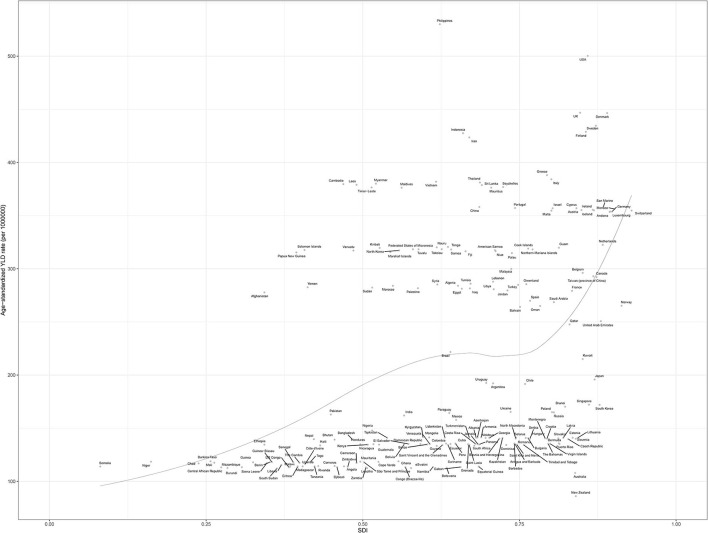
Methods: Global, regional, and national burdens of neck pain determined by prevalence, incidence, and years lived with a disability (YLD) from 1990 to 2019 were comprehensively analyzed according to age, gender, and socio-demographic index using the Global Burden of Disease Study 1990 and 2019 data provided by the Institute for Health Metrics and Evaluation.
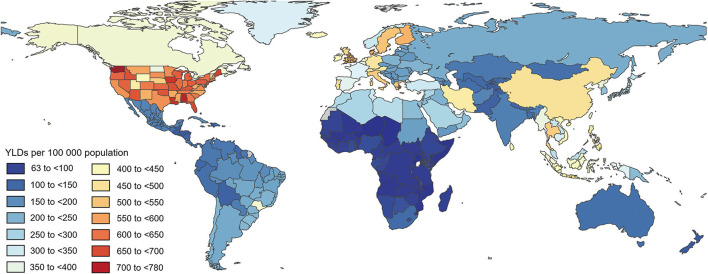
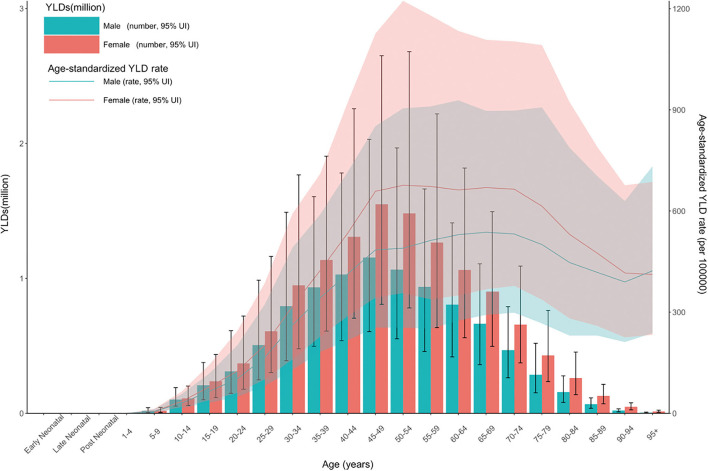
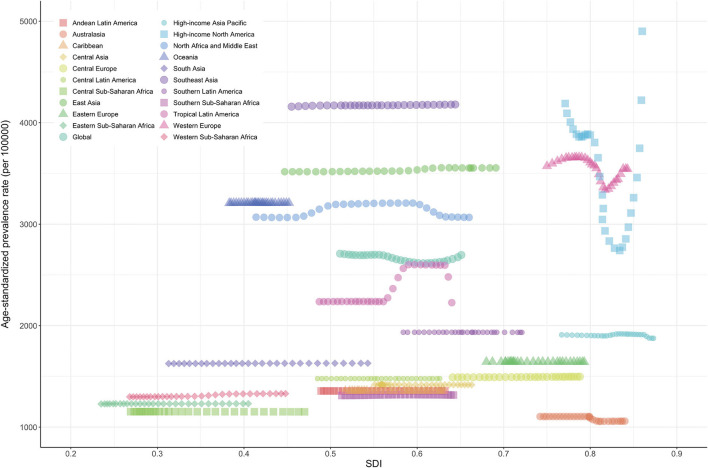
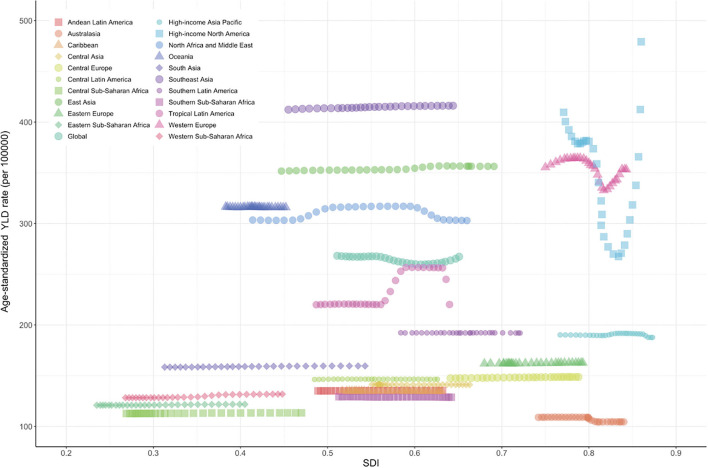
Results: Globally, in 2019, the age-standardized rates for prevalence, incidence, and YLD of neck pain per 100,000 population was 2,696.5 (95% uncertainty interval [UI], 2,177.0 to 3,375.2), 579.1 (95% UI, 457.9 to 729.6), and 267.4 (95% UI, 175.5 to 383.5) per 100,000 population, respectively. Overall, there was no significant difference in prevalence, incidence, or YLD of neck pain between 1990 and 2019. The highest age-standardized YLD of neck pain per 100,000 population in 2019 was observed in high-income North America (479.1, 95% UI 323.0 to 677.6), Southeast Asia (416.1, 95% UI 273.7 to 596.5), and East Asia (356.4, 95% UI 233.2 to 513.2). High-income North America (17.0, 95% UI 9.0 to 25.4%) had the largest increases in YLD of neck pain per 100,000 population from 1990 to 2019. At the national level, the highest age-standardized YLD of neck pain was found in the Philippines (530.1, 95% UI 350.6 to 764.8) and the highest change age-standardized YLD between 1990 and 2019 was found in the United States (18.4, 95% UI 9.9 to 27.6%). Overall, the global burden of neck pain increased with age until the age of 70-74 years, and was higher in women than men. In general, positive associations between socio-demographic index and burden of neck pain were found.
Conclusions: Because neck pain is a major public health burden with a high prevalence, incidence, and YLD worldwide, it is important to update its epidemiological data and trends to cope with the future burden of neck pain.
Keywords: global burden; incidence; neck pain; prevalence; socio-demographic index; years lived with a disability.
Copyright © 2022 Shin, Shin, Koyanagi, Jacob, Smith, Lee, Chang and Song.
Conflict of interest statement
The authors declare that the research was conducted in the absence of any commercial or financial relationships that could be construed as a potential conflict of interest.
Figures
References
LinkOut - more resources
Full Text Sources