. 2022 Sep 1:13:999375.
doi: 10.3389/fneur.2022.999375. eCollection 2022.

Brain morphology changes after spinal cord injury: A voxel-based meta-analysis

Affiliations

Brain morphology changes after spinal cord injury: A voxel-based meta-analysis

Haiyang Yu et al. Front Neurol. .

Abstract

Objectives: Spinal cord injury (SCI) remodels the brain structure and alters brain function. To identify specific changes in brain gray matter volume (GMV) and white matter volume (WMV) following SCI, we conducted a voxel-based meta-analysis of whole-brain voxel-based morphometry (VBM) studies.

Methods: We performed a comprehensive literature search on VBM studies that compared SCI patients and healthy controls in PubMed, Web of Science and the China National Knowledge Infrastructure from 1980 to April 2022. Then, we conducted a voxel-based meta-analysis using seed-based d mapping with permutation of subject images (SDM-PSI). Meta-regression analysis was performed to identify the effects of clinical characteristics.

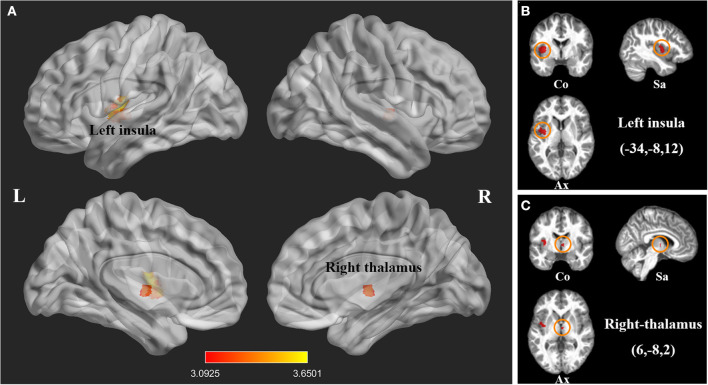
Results: Our study collected 20 studies with 22 GMV datasets and 15 WMV datasets, including 410 patients and 406 healthy controls. Compared with healthy controls, SCI patients showed significant GMV loss in the left insula and bilateral thalamus and significant WMV loss in the bilateral corticospinal tract (CST). Additionally, a higher motor score and pinprick score were positively related to greater GMV in the right postcentral gyrus, whereas a positive relationship was observed between the light touch score and the bilateral postcentral gyrus.

Conclusion: Atrophy in the thalamus and bilateral CST suggest that SCI may trigger neurodegeneration changes in the sensory and motor pathways. Furthermore, atrophy of the left insula may indicate depression and neuropathic pain in SCI patients. These indicators of structural abnormalities could serve as neuroimaging biomarkers for evaluating the prognosis and treatment effect, as well as for monitoring disease progression. The application of neuroimaging biomarkers in the brain for SCI may also lead to personalized treatment strategies.

Systematic review registration: https://www.crd.york.ac.uk/prospero/display_record.php?ID=CRD42021279716, identifier: CRD42021279716.

Keywords: brain mapping; meta-analysis; neuroimaging; spinal cord injury; voxel-based morphometry.


Conflict of interest statement

The authors declare that the research was conducted in the absence of any commercial or financial relationships that could be construed as a potential conflict of interest.

Figures

Figure 1
Figure 1
Flow diagram of inclusion and exclusion process of selected VBM studies. SCI, spinal cord injury; VBM, voxel-based morphology.
Figure 2
Figure 2
Statistical parametric maps showing decreased gray matter volumes in patients with spinal cord injury (SCI) compared with those of healthy controls in the pooled meta-analysis. (A) The overlay of statistical parametric maps showing the decreased gray matter volume in left insula and right thalamus in SCI patients compared with healthy controls. (B) The illustration of the sagittal, coronal and axial planes of the decreased gray matter volume in left insula in SCI patients compared with healthy controls. (C) The illustration of the sagittal, coronal and axial planes of the decreased gray matter volume in right thalamus in SCI patients compared with healthy controls. Color bar represents t-value; Co, Sa, and Ax represent coronal, sagittal and axial planes, respectively. R, right; L left, spinal cord injury, SCI.
Figure 3
Figure 3
Statistical parametric maps showing the decreased white matter volumes in patients with spinal cord injury (SCI) compared with those of healthy controls in the pooled meta-analysis. (A) The overlay of statistical parametric maps showing the decreased white matter volume in right corticospinal tract in SCI patients compared with healthy controls. (B) The illustration of the sagittal, coronal, and axial planes of the decreased white matter volume in right corticospinal tract in SCI patients compared with healthy controls. Color bar represents t-value; Co, Sa, and Ax represent coronal, sagittal, and axial planes, respectively. Ant, anterior; Pos, posterior; SCI, spinal cord injury.
Figure 4
Figure 4
Statistical parametric maps showing the decreased gray matter volumes in patients with spinal cord injury (SCI; time since injury > 1 year) compared with those of healthy controls in the subgroup meta-analysis. (A) The overlay of statistical parametric maps showing the decreased gray matter volume in left insula in SCI patients (time since injury > 1 year) compared with healthy controls. (B) The illustration of the sagittal, coronal, and axial planes of the decreased gray matter volume in left insula in SCI patients (time since injury > 1 year) compared with healthy controls. Color bar represents t-value; Co, Sa, and Ax represent coronal, sagittal, and axial planes, respectively. R, right; L left; SCI, spinal cord injury.
Figure 5
Figure 5
Meta-regression analysis showing the correlation between clinical score and gray matter volume in patients with spinal cord injury (SCI). (A) The American Spinal Injury Association (ASIA) motor scores of SCI patients are positively correlated with gray matter volumes in the right postcentral gyrus (P = 0.002, R2 = 0.64). (B) The ASIA pinprick scores of SCI patients are positively related to gray matter volumes in the right postcentral gyrus (P = 0.026, R2 = 0.59). (C) The ASIA light touch scores of SCI patients are positively related to gray matter volumes in the right postcentral gyrus (P = 0.009, R2 = 0.70) and (D) left postcentral gyrus (P = 0.018, R2 = 0.64). The effect sizes in the graph were extracted from the peak of maximum slope significance. Each study is represented as a dot.

References

    1. Ahuja CS, Wilson JR, Nori S, Kotter MRN, Druschel C, Curt A, et al. . Traumatic spinal cord injury. Nat Rev Dis Primers. (2017) 3:17018. 10.1038/nrdp.2017.18 - DOI - PubMed
    1. Injury GBDTB, Spinal Cord Injury C. Global, regional, and national burden of traumatic brain injury and spinal cord injury, 1990–2016: a systematic analysis for the Global Burden of Disease Study 2016. Lancet Neurol. (2019) 18:56–87. 10.1016/S1474-4422(18)30415-0 - DOI - PMC - PubMed
    1. Ziegler G, Grabher P, Thompson A, Altmann D, Hupp M, Ashburner J, et al. . Progressive neurodegeneration following spinal cord injury: implications for clinical trials. Neurology. (2018) 90:e1257–66. 10.1212/WNL.0000000000005258 - DOI - PMC - PubMed
    1. Freund P, Seif M, Weiskopf N, Friston K, Fehlings MG, Thompson AJ, et al. . MRI in traumatic spinal cord injury: from clinical assessment to neuroimaging biomarkers. Lancet Neurology. (2019) 18:1123–35. 10.1016/S1474-4422(19)30138-3 - DOI - PubMed
    1. Hains BC, Black JA, Waxman SG. Primary cortical motor neurons undergo apoptosis after axotomizing spinal cord injury. J Comp Neurol. (2003) 462:328–41. 10.1002/cne.10733 - DOI - PubMed

Publication types