

Development and validation of a machine learned algorithm to IDENTIFY functionally significant coronary artery disease
- PMID: 36119746
- PMCID: PMC9481304
- DOI: 10.3389/fcvm.2022.956147
Development and validation of a machine learned algorithm to IDENTIFY functionally significant coronary artery disease
Abstract
Introduction: Multiple trials have demonstrated broad performance ranges for tests attempting to detect coronary artery disease. The most common test, SPECT, requires capital-intensive equipment, the use of radionuclides, induction of stress, and time off work and/or travel. Presented here are the development and clinical validation of an office-based machine learned algorithm to identify functionally significant coronary artery disease without radiation, expensive equipment or induced patient stress.
Materials and methods: The IDENTIFY trial (NCT03864081) is a prospective, multicenter, non-randomized, selectively blinded, repository study to collect acquired signals paired with subject meta-data, including outcomes, from subjects with symptoms of coronary artery disease. Time synchronized orthogonal voltage gradient and photoplethysmographic signals were collected for 230 seconds from recumbent subjects at rest within seven days of either left heart catheterization or coronary computed tomography angiography. Following machine learning on a proportion of these data (N = 2,522), a final algorithm was selected, along with a pre-specified cut point on the receiver operating characteristic curve for clinical validation. An unseen set of subject signals (N = 965) was used to validate the algorithm.
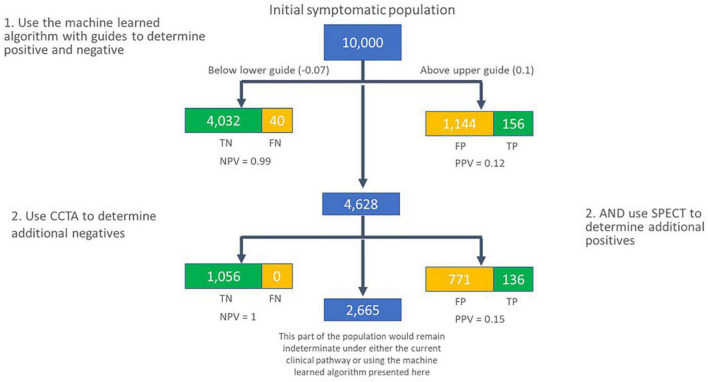
Results: At the pre-specified cut point, the sensitivity for detecting functionally significant coronary artery disease was 0.73 (95% CI: 0.68-0.78), and the specificity was 0.68 (0.62-0.74). There exists a point on the receiver operating characteristic curve at which the negative predictive value is the same as coronary computed tomographic angiography, 0.99, assuming a disease incidence of 0.04, yielding sensitivity of 0.89 and specificity of 0.42. Selecting a point at which the positive predictive value is maximized, 0.12, yields sensitivity of 0.39 and specificity of 0.88.
Conclusion: The performance of the machine learned algorithm presented here is comparable to common tertiary center testing for coronary artery disease. Employing multiple cut points on the receiver operating characteristic curve can yield the negative predictive value of coronary computed tomographic angiography and a positive predictive value approaching that of myocardial perfusion imaging. As such, a system employing this algorithm may address the need for a non-invasive, no radiation, no stress, front line test, and hence offer significant advantages to the patient, their physician, and healthcare system.
Keywords: artificial intelligence; coronary artery disease; digital health; front line testing; machine learning (ML).
Copyright © 2022 Stuckey, Meine, McMinn, Depta, Bennett, McGarry, Carroll, Suh, Steuter, Roberts, Gillins, Lange, Fathieh, Burton, Khosousi, Shadforth, Sanders and Rabbat.
Conflict of interest statement
This study was supported by CorVista Health. The funder had the following involvement in the study: the study design, collection, analysis, interpretation of data, the writing of this article and the decision to submit it for publication. HG, IS, WS, TB, FF, AK, and EL were employees of CorVista Health. MGR was a member of the Medical Advisory Board for CorVista Health. The remaining authors declare that the research was conducted in the absence of any commercial or financial relationships that could be construed as a potential conflict of interest.
Figures


References
-
- Knuuti J, Ballo H, Juarez-Orozco LE, Saraste A, Kolh P, Rutjes AWS, et al. The performance of non-invasive tests to rule-in and rule-out significant coronary artery stenosis in patients with stable angina: a meta-analysis focused on post-test disease probability. Eur Heart J. (2018) 39:3322–30. 10.1093/eurheartj/ehy267 - DOI - PubMed
LinkOut - more resources
Full Text Sources
Research Materials