

Autophagic state prospectively identifies facultative stem cells in the intestinal epithelium
- PMID: 36120829
- PMCID: PMC9638868
- DOI: 10.15252/embr.202255209
Autophagic state prospectively identifies facultative stem cells in the intestinal epithelium
Abstract
The intestinal epithelium exhibits a rapid and efficient regenerative response to injury. Emerging evidence supports a model where plasticity of differentiated cells, particularly those in the secretory lineages, contributes to epithelial regeneration upon ablation of injury-sensitive stem cells. However, such facultative stem cell activity is rare within secretory populations. Here, we ask whether specific functional properties predict facultative stem cell activity. We utilize in vivo labeling combined with ex vivo organoid formation assays to evaluate how cell age and autophagic state contribute to facultative stem cell activity within secretory lineages. Strikingly, we find that cell age (time elapsed since cell cycle exit) does not correlate with secretory cell plasticity. Instead, high autophagic vesicle content predicts plasticity and resistance to DNA damaging injury independently of cell lineage. Our findings indicate that autophagic status prior to injury serves as a lineage-agnostic marker for the prospective identification of facultative stem cells.
Keywords: autophagy; facultative stem cell; organoid formation; paligenosis; regeneration.
© 2022 The Authors.
Figures
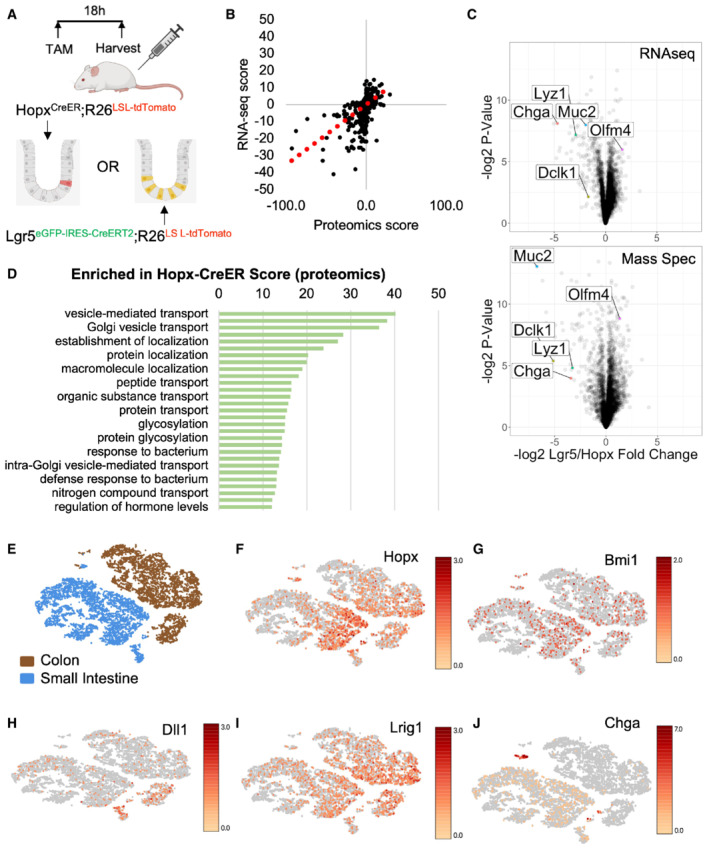
- A
Schema for tamoxifen injections to Hopx CreER ::Rosa26 LSL‐tdTomato and Lgr5 eGFP‐IRES‐CreERT2 ::R26 LSL‐tdTomato mice. Small intestines were processed for FACS 18 h after one tamoxifen dose and RNA and protein were extracted from collected cells for sequencing and mass spectrometry, respectively. N = 3 mice/group for transcriptomics and N = 4 mice/group for proteomics.
- B
Concordance between transcript and protein abundance as measured by the correlation between enrichment scores per gene [−log2 (P‐value) × fold change] for RNA and protein.
- C
Volcano plots of enriched transcripts/proteins by RNA‐seq and Mass Spectrometry in Hopx‐CreER labeled cells versus Lgr5‐CreER labeled cells.
- D
Gene ontology analysis of proteins enriched in Hopx‐CreER labeled f‐ISCs. Score = −log2 (P‐value).
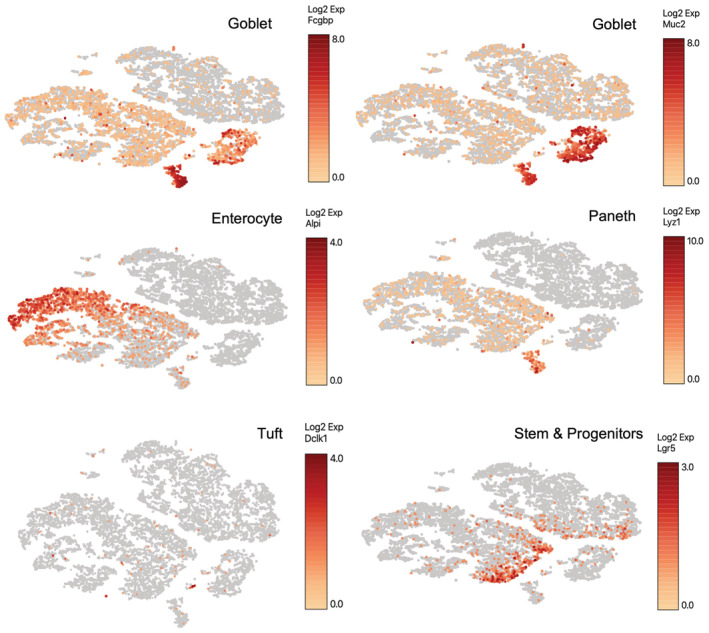
- E–J
tSNE plots of single‐cell RNA‐sequencing data from wild type small intestine and colon (E). tSNE plots colored by expression levels of common f‐ISC Cre‐drivers and Chga (F–J).
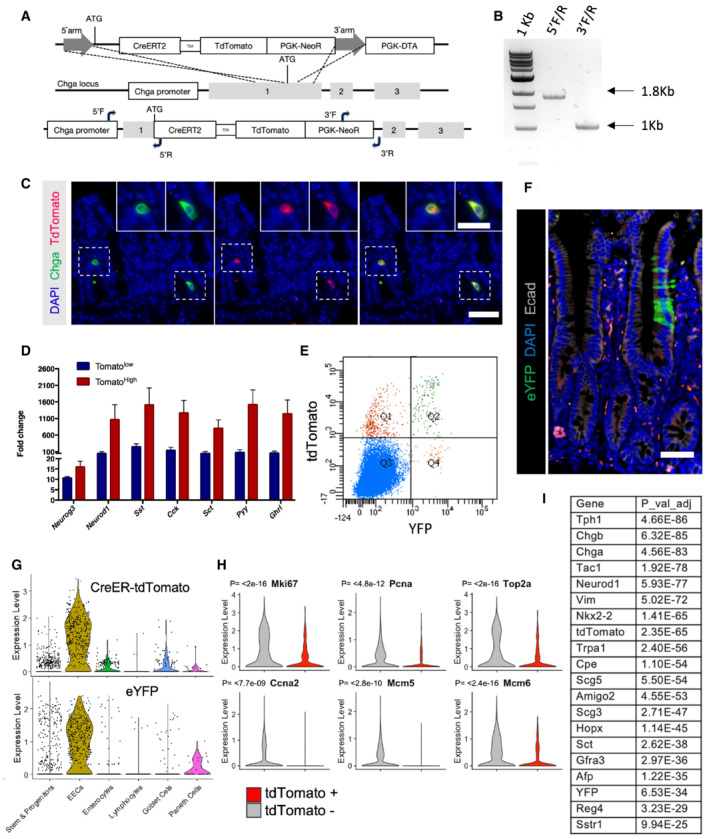
- A
Targeting strategy to insert a CreERT2‐2A‐tdTomato sequence into the translational start site of the endogenous Chga locus.
- B
PCR to confirm proper targeting of the CreERT2‐2A‐tdTomato sequence, as demonstrated in (A). Expected 5′ fragment = 1.8 kb, expected 3′ fragment = 1 kb.
- C
Immunofluorescence staining of small intestine demonstrating overlap of Chga protein and tdTomato reporter in the same cells. Scale bar = 50 μm. Inset scale bar = 25 μm.
- D
Crypt enriched epithelial cell suspensions were generated from ChgaCreER‐2A‐tdTomato mice, sorted tdTomato+ cells, and qPCR was performed for transcription factors (Neurog3, Neurod1) and hormones (Sst, Cck, Sct, Pyy, Ghrl). Y‐axis is fold change relative to tdTomato negative cells. N = 3 technical replicates/group. Data are expressed as mean ± SEM.
- E
Flow cytometry analysis of ChgaCreER‐2A‐tdTomato::R26RLSL‐eYFP intestinal epithelial cells 48 h after five consecutive daily tamoxifen doses. Single‐cell RNA sequencing was performed on cells sorted from Q2 + Q4 and a bulk population (all quadrants).
- F
Immunofluorescence staining of small intestine from a ChgaCreER‐2A‐tdTomato::R26RLSL‐eYFP mouse 48 h after five tamoxifen doses. Scale bar = 50 μm.
- G
Violin plots demonstrating CreER‐tdTomato and eYFP expression by cell type.
- H
Violin plots of cell cycle related genes in tdTomato+ and tdTomato− populations. N = 1 mouse/group, tomato− = 1,907 cells/group, tomato+ = 429 cells/group. P‐value generated by two‐tailed Student's t‐test.
- I
Table of EEC related genes enriched in the tdTomato+ versus tdTomato− cell population.
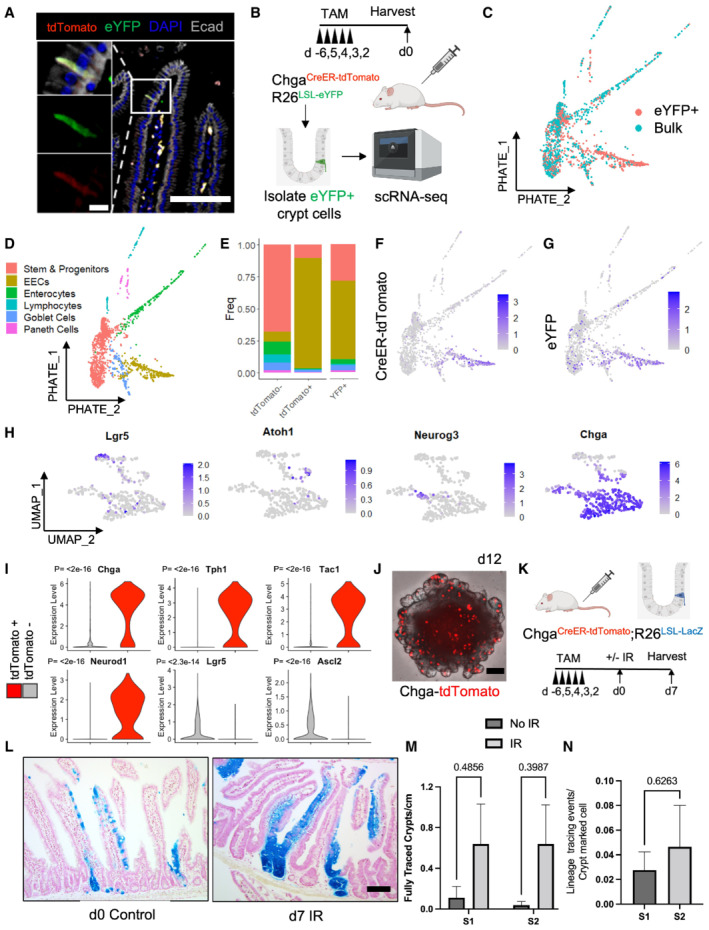
- A
Immunofluorescence staining of small intestine demonstrating overlap of tdTomato and activated eYFP reporter. Scale bar = 100 μm. Inset scale bar = 10 μm.
- B
Schema for scRNAseq experiment. Bulk and eYFP+ cells were collected 48 h after five daily doses of 1 mg of tamoxifen.
- C
PHATE map projection of scRNAseq data color coded by sorted population (eYFP+ vs. bulk cells).
- D
PHATE map projection of eYFP and bulk cells demonstrating lineage relationships between intestinal cell types.
- E
Histogram of cell types that express tdTomato and eYFP.
- F
CreER‐tdTomato expression displayed on PHATE map.
- G
eYFP expression displayed on PHATE map.
- H
UMAP dimension reduction was performed on cells that express the tdTomato transcript, revealing a cluster of EECs (bottom Chga+ cluster) including some Neurog3+ EEC progenitors and a more immature secretory progenitor cluster (top, expressing Lgr5 and Atoh1).
- I
Violin plots of EEC (Chga, Tph1, Tac1, Neurod1) and CBC (Lgr5, Ascl2) marker genes in tdTomato+ and tdTomato− populations. N = 1 mouse/group, tomato− = 1,907 cells/group, tomato+ = 429 cells/group. P‐value generated by two‐tailed Student's t‐test.
- J
Image of an organoid formed from a single ChgaCreER‐tdTomato+ cell, 12‐day postplating. Scale bar = 100 μm.
- K
Experimental scheme for lineage tracing of Chga CreER ‐marked cells at homeostasis and postinjury. Five consecutive doses of 1 mg of tamoxifen were administered to Chga CreER‐2A‐tdTomato ::R26 LSL‐LacZ mice, followed by 12 Gy of gamma irradiation and tissue harvest 7 days later. N = 3 control mice, N = 4 IR mice.
- L
Example images of β‐Gal+ traced cells postirradiation and at homeostasis. Scale bar = 100 μm.
- M
The number of fully traced β‐Gal+ crypt‐villus axes/cm in irradiated and nonirradiated mice. Lineage tracing events were quantified from small intestines divided into four equal segments (S1–4, with S1 being the most proximal), stained with X‐Gal, embedded in paraffin, cut into 5 μm thick sections, and counterstained with neutral red. Data are expressed as mean ± SEM. N = 3 mice/group, P‐value generated by multiple Student's t‐tests.
- N
The number of β‐Gal+ fully traced crypt‐villus axes (i.e., lineage tracing events) normalized to the number of pre‐injury crypt marked β‐Gal+ cells (quantified from d0 control mice). S1 + S2 = the two most proximal intestinal segments. Data are expressed as mean ± SEM. N = 4 mice/group, P‐value generated by two‐tailed student's t‐test.
- A
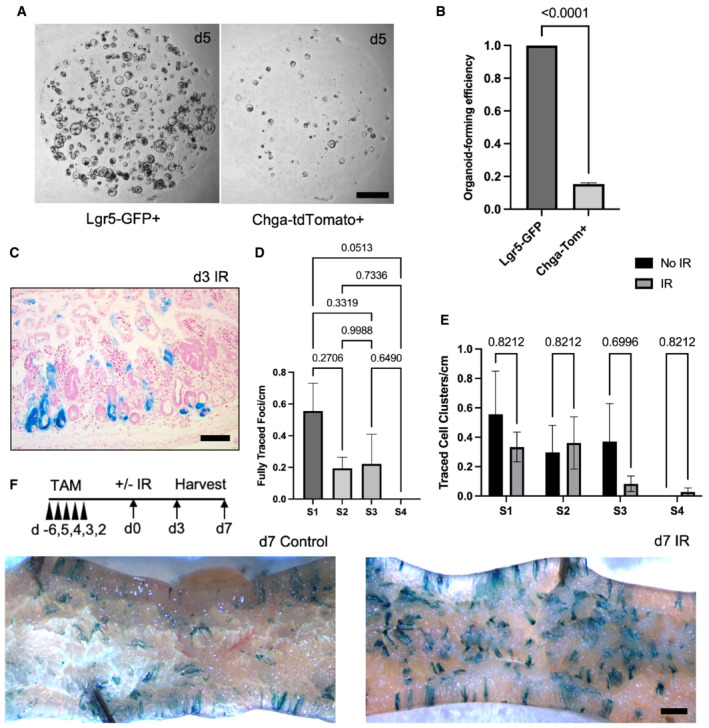
Representative images of enteroids grown from single sorted Lgr5‐GFPHigh or Chga‐tdTomato+ cells. Scale bar = 1 mm.
- B
Organoid formation efficiency of cells plated in (E). N = 3 mice/genotype, N = 3 wells quantified per mouse. Data are expressed as mean ± SEM. P‐value generated by two‐tailed Student's t‐test.
- C
Example image of d3 small intestine stained with X‐Gal, embedded in paraffin, sectioned, and counterstained with neutral red. Scale bar = 100 μm.
- D
The number of fully traced b‐Gal + clonal regenerative foci per cm of small intestine, measured on d3 postirradiation. Small intestines were divided into four equal segments, S1–4, with S1 being the most proximal and S4 the most distal. N = 3 mice. Data are expressed as mean ± SEM. P‐value generated by Ordinary one‐way ANOVA.
- E
The number of b‐Gal + cell clusters per cm. These cell clusters were considered distinct events from clonally traced crypts. N = 3 mice/group. Data are expressed as mean ± SEM. P‐value generated by multiple student's t‐tests.
- F
Whole mount imaging of proximal jejunum from control and irradiated Chga CreER‐2A‐tdTomato ::R26 LSL‐LacZ mice. Scale bar = 1 mm.
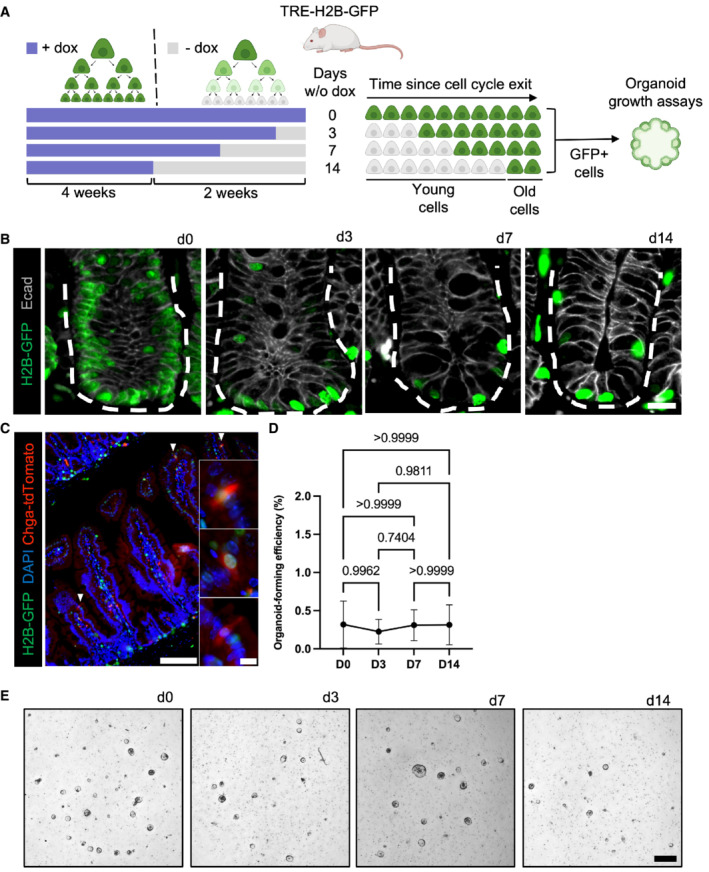
- A
Diagram depicting the use of TRE‐H2B‐GFP mice for label retention studies. TRE‐H2B‐GFP mice were given doxycycline continually for at least 4 weeks prior to variable withdrawal periods to generate label retaining cell populations of different ages. The GFP+ LRCs were then FACS‐purified, embedded in Matrigel, and exposed to niche growth factors (EGF, R‐Spondin, Noggin) for in vitro organoid formation assays.
- B
Immunofluorescence images of small intestines of TRE‐H2B‐GFP mice after the dox withdrawal periods outlined in panel (A). Crypts are outlined with dashed lines. Scale bar = 15 μm.
- C
Immunofluorescent image of a TRE‐H2B‐GFP Chga CreER‐2A‐tdTomato mouse after a 10 day dox withdrawal period, demonstrating that EECs and LRCs represent an overlapping population, with half of EECs retaining an H2B‐GFP label. Scale bar = 100 μm. Inset scale bar = 10 μm.
- D
Organoid formation efficiency of different aged LRC populations. N = 3 mice/group, N = 3 wells quantified per mouse. Data are expressed as mean ± SEM. N = 3 mice/group, P‐value generated by Ordinary one‐way ANOVA.
- E
Images of organoids quantified in (D). Scale bar = 500 μm.
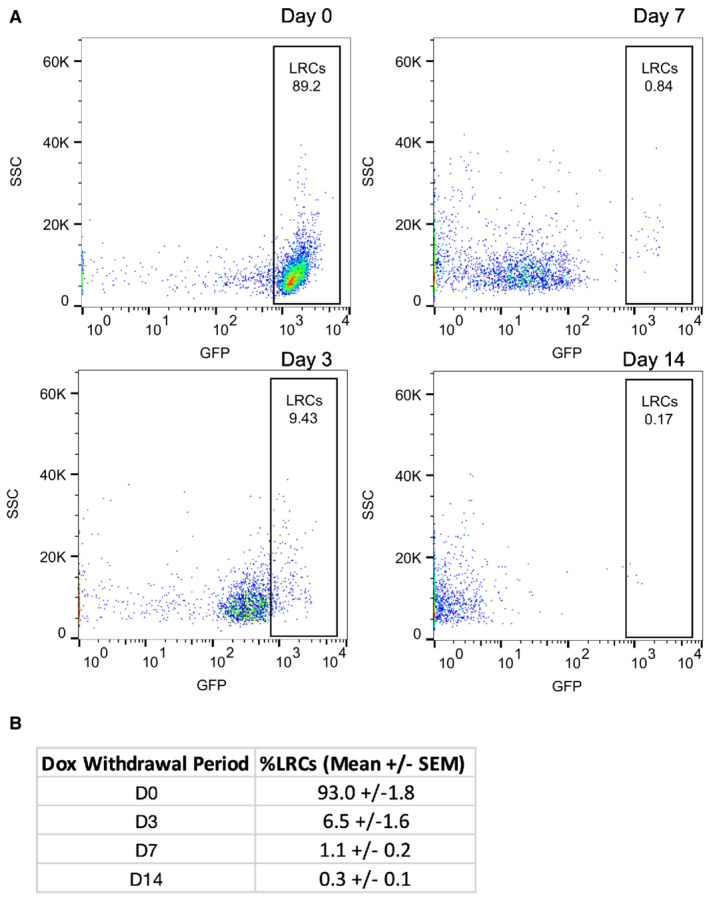
- A
Representative plots of the distribution of GFP‐positive cells from TRE‐H2B‐GFP mice after 0, 3, 7, and 14 day dox withdrawal periods.
- B
The percentage of label retaining cells in each sample quantified from plots in (A). N = 3 mice per time point.
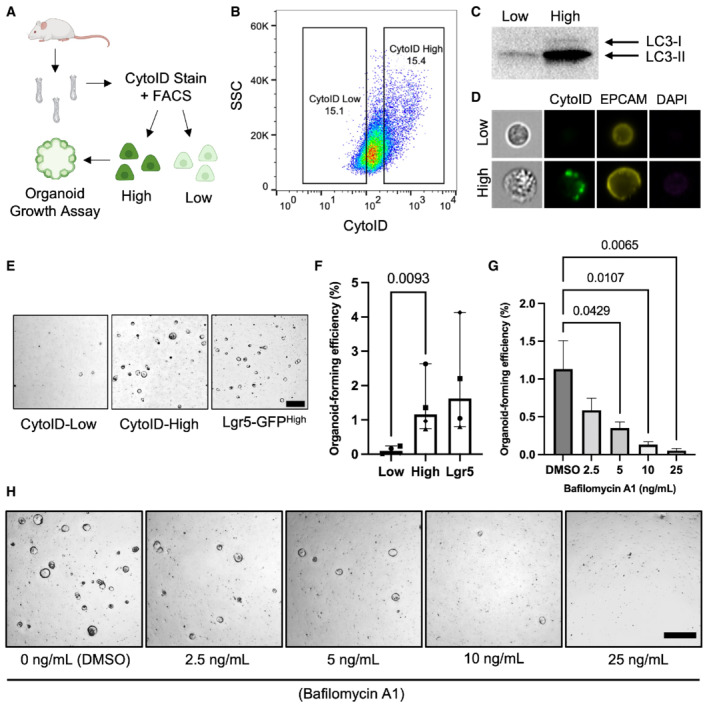
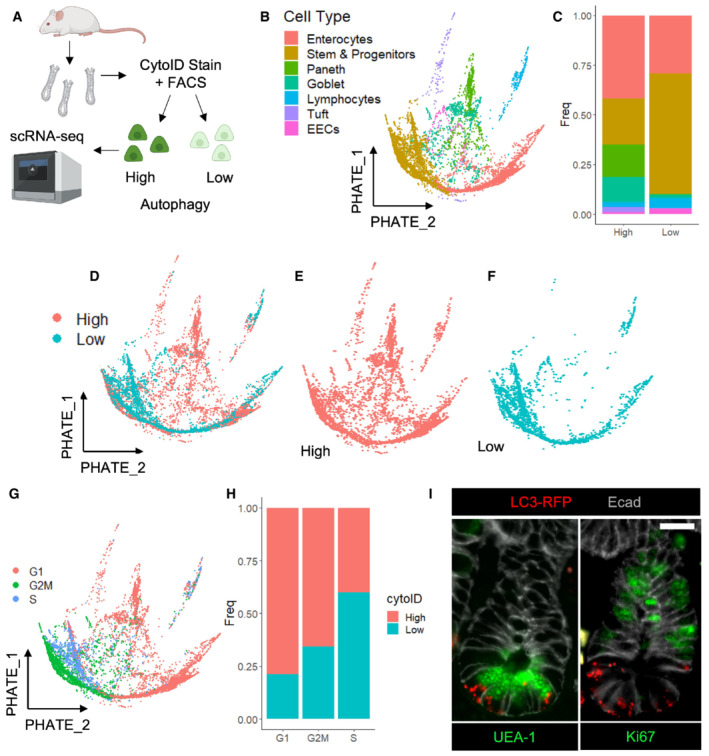
- A
Schema of experimental approach. Small intestinal crypts were isolated, processed into single cells, and stained with CytoID. The top and bottom 15% of CytoID‐stained cells were sorted and plated to evaluate organoid‐formation efficiencies.
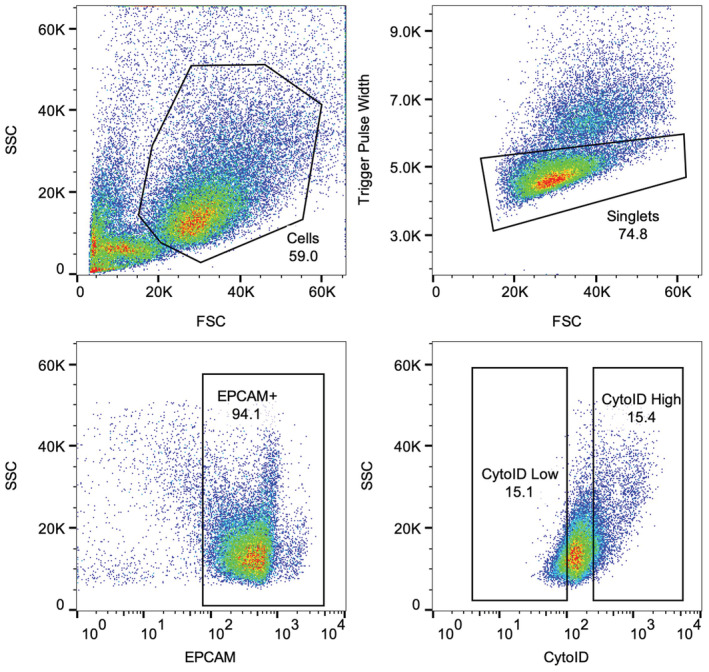
- B
Representative flow plot demonstrating the CytoID staining pattern within intestinal epithelial cells.
- C
Western blot demonstrating LC3 levels from equal numbers of sorted CytoIDlow and CytoIDhigh cells. 200,000 cells were loaded per lane.
- D
Images of sorted CytoIDlow and CytoIDhigh cells acquired using an imaging flow cytometer.
- E
Representative images of organoids formed from sorted CytoIDlow, CytoIDhigh, and Lgr5‐GFPhigh cells. Scale bar = 500 μm.
- F
Quantification of the organoid‐formation efficiency in (E). N = 4 mice/group, N = 3 wells quantified per mouse. P‐values displayed on graph. Data are expressed as mean ± SEM. P‐value generated by ratio paired two‐tailed t‐test.
- G
Effect of bafilomycin on organoid formation efficiency in CytoIDlow and CytoIDhigh cells. Cells were plated in media containing different concentrations of bafilomycin (0, 2.5, 5, 10, or 25 ng/ml) on day 0, media was changed on day 3 to media that did not contain bafilomycin and organoids were imaged on day 5 after plating. N = 4 mice/group, N = 4 wells quantified per mouse. Data are expressed as mean ± SEM. P‐value generated by Ordinary one‐way ANOVA.
- H
Representative images of organoids quantified in (G). Scale bar = 500 μm.
- A
Crypts were isolated from wildtype mice, dissociated into single cells, stained with CytoID and anti‐EpCam antibodies. Epcam+ CytoID high and low (brightest and dimmest 15%, respectively) cells were sorted out and processed for single‐cell RNA sequencing using 10× Chromium technology. Cells from N = 2 mice (one male, one female) were pooled, and mouse origin was demultiplexed using BioLegend Hashtag antibodies.
- B
PHATE map dimension reduction of all sequenced cells, colored by cell type.
- C
Histogram depicting the cell type make‐up of the CytoID high and low populations.
- D–F
PHATE maps with cells colored by autophagy status.
- G
Cells were assigned cell cycle status based on expression of phase‐specific genes and projected onto a PHATE map.
- H
The percentage of CytoID high versus low cells by cell cycle phase.
- I
Immunofluorescence images of crypts from CAG‐LC3‐GFP‐RFP mice stained with anti‐RFP, anti‐E‐cadherin, and either anti‐ki67 or UEA1 antibodies. Scale bar = 15 μm.
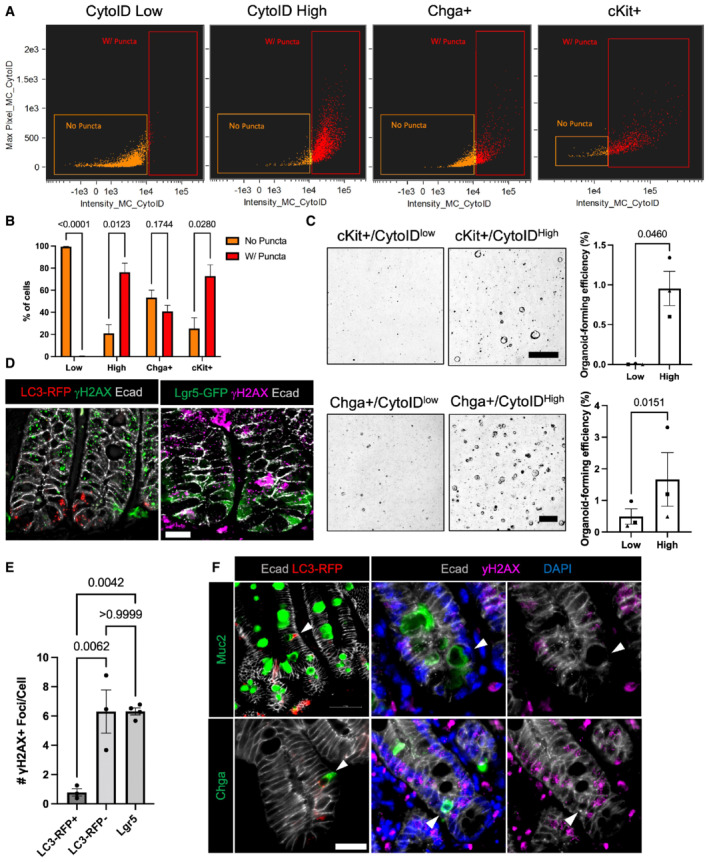
- A
Representative plots demonstrating the distribution of cells with and without CytoID puncta within sorted CytoID low, high, Chga+, and c‐Kit+ cells.
- B
Quantification of the percentage of cells with and without puncta within CytoID low, high, Chga+, and c‐Kit+ cells. N = 3 mice/group (biological replicates). Data are expressed as mean ± SEM. N = 3 mice/group, P‐value generated by multiple student's t‐tests.
- C
Representative images and quantification of organoid‐formation efficiency of CytoID low and high cKit+ and Chga+ cells. Scale bars = 500 μm. N = 3 mice/group (biological replicates), N = 4 wells quantified per mouse (technical replicates). P‐values displayed on graph. Data are expressed as mean ± SEM. P‐value generated by paired and ratio paired two‐tailed t‐test, respectively.
- D
Immunofluorescent images of crypts from CAG‐LC3‐GFP‐RFP and Lgr5‐GFP mice 6 h postirradiation. Sections were stained for γH2AX, E‐cadherin, and either LC3‐RFP or Lgr5‐GFP, respectively. Scale bar = 15 μm.
- E
Quantification of the number of γH2AX foci in cells with RFP+ puncta, without autophagic puncta, or in Lgr5+ CBCs. N = 3 mice/group, 40–80 cells quantified/mouse. P‐values displayed on graph. Data are expressed as mean ± SEM. P‐value generated by unpaired two‐tailed t‐test.
- F
Immunofluorescence staining of crypt base goblet cells (Muc2+) and EECs (Chga+) in CAG‐LC3‐GFP‐RFP reporter mice pre‐ (RFP stained) and 6 h postirradiation (γH2AX stained). Arrowheads point to goblet cells (top left) and EECs (bottom left) with high autophagic vesicle content (LC3‐RFP+). On the right panels, arrowheads point to goblet cells (top) and EECs (bottom) with fewer yH2AX foci. Scale bar = 25 μm.
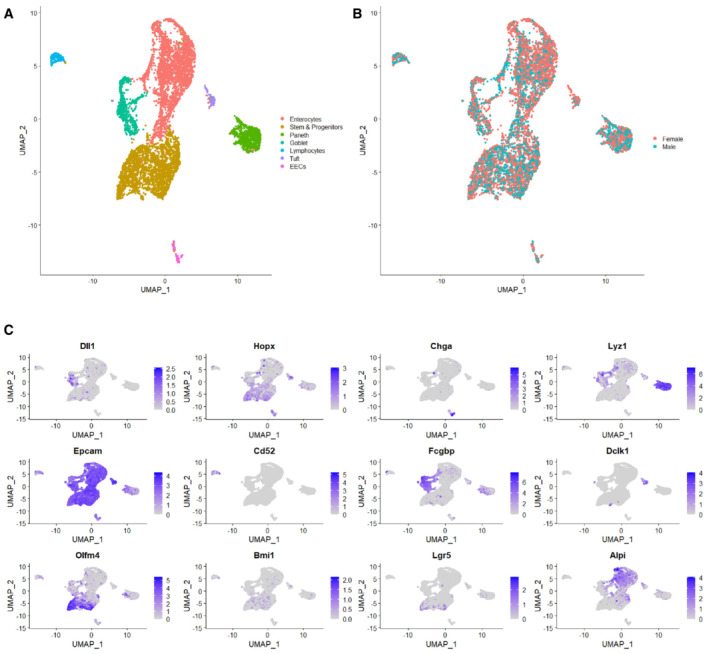
- A
UMAP plot of all sequenced cells with cell clusters colored by cell type identity.
- B
Sequenced cells were a mix of N = 2 mice, one male and one female. UMAP of cells colored by sample origin.
- C
Marker genes used to identify cell type identities.
References
-
- Aguilan JT, Kulej K, Sidoli S (2020) Guide for protein fold change and p‐value calculation for non‐experts in proteomics. Mol Omics 16: 573–582 - PubMed
-
- Asano J, Sato T, Ichinose S, Kajita M, Onai N, Shimizu S, Ohteki T (2017) Intrinsic autophagy is required for the maintenance of intestinal stem cells and for irradiation‐induced intestinal regeneration. Cell Rep 20: 1050–1060 - PubMed
-
- Barker N, van Es JH, Kuipers J, Kujala P, van den Born M, Cozijnsen M, Haegebarth A, Korving J, Begthel H, Peters PJ et al (2007) Identification of stem cells in small intestine and colon by marker gene Lgr5. Nature 449: 1003–1007 - PubMed
-
- Barker N, Clevers H (2010) Lineage tracing in the intestinal epithelium. Curr Protoc Stem Cell Biol 13: 5A.4.1–5A.4.11 - PubMed
Publication types
MeSH terms
Associated data
- Actions
Grants and funding
LinkOut - more resources
Full Text Sources
Medical
Molecular Biology Databases
