

doi: 10.1002/ctm2.1019.
Chrysin targets myeloid-derived suppressor cells and enhances tumour response to anti-PD-1 immunotherapy
Affiliations
- PMID: 36121176
- PMCID: PMC9484264
- DOI: 10.1002/ctm2.1019
Item in Clipboard
Chrysin targets myeloid-derived suppressor cells and enhances tumour response to anti-PD-1 immunotherapy
Clin Transl Med.
2022 Sep.
No abstract available
Conflict of interest statement
The authors declare that they have no competing interests.
Figures
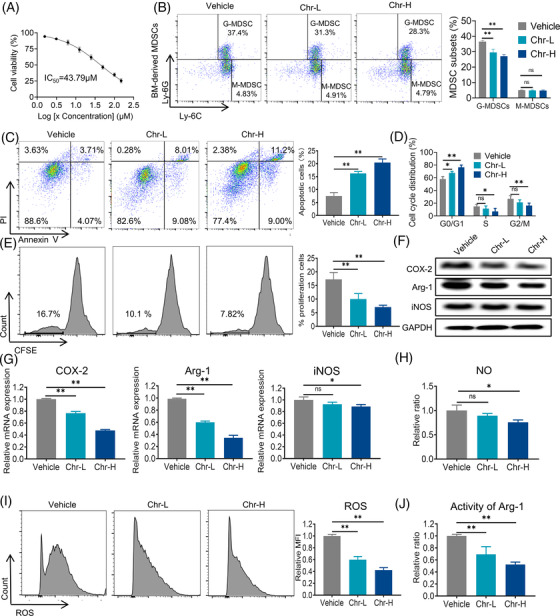
Chrysin (Chr) inhibits the accumulation and function of myeloid‐derived suppressor cells (MDSCs) in vitro: (A) CCK8 assay results of Chr on MDSCs; (B) effect of Chr on B16‐F10‐bearing C57BL6 mouse myeloid cells, as detected by flow cytometric analysis; (C) analysis of MDSCs apoptosis induced by Chr using Annexin V/PI assay; (D) effect of Chr on the cell cycle of MDSCs; (E) proliferation of CFSE‐labelled MDSCs, as determined by flow cytometry. Inducible nitric oxide synthase (iNOS), COX‐2, and Arg‐1 protein (F) and mRNA (G) levels in Chr‐treated MDSCs. Immunosuppressive function analysis of MDSCs after Chr treatment, including NO production (H), reactive oxygen species (ROS) level (I) and Arg‐1 activity (J). Data expressed as mean ± SD, n = 3. ns, not significant. *p < .05, **p < .01. Chr‐L, 10 µM; Chr‐H, 20 µM
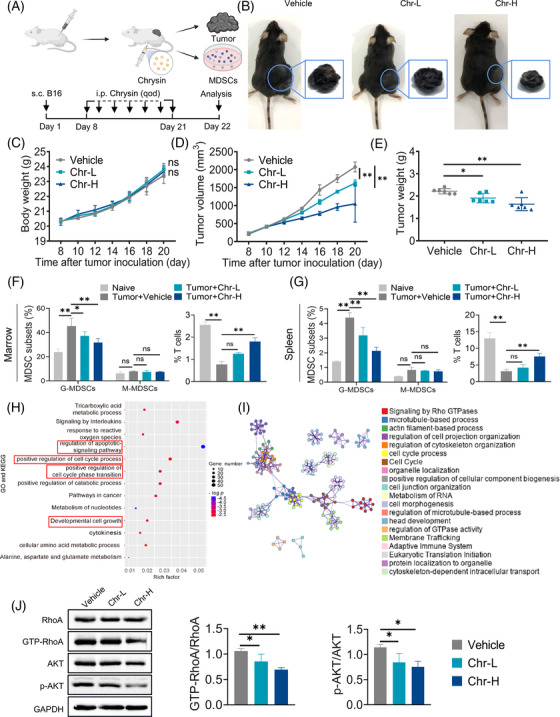
Chrysin targeting RhoA/PI3K/AKT pathway inhibits myeloid‐derived suppressor cells (MDSCs) and exerts anti‐tumour effect: (A) Schematics show the treatments of tumour‐bearing C57BL6 mice; (B) representative photographs of transplanted tumours at the end of the experiment; mouse body weight (C), tumour volume (D) and tumour weight (E) change in each group; flow cytometry analysed the effect of Chr on the ratio of MDSCs (left) and CD8+ T cells (right) in the marrow (F) and spleen (G). Chr‐L, 20 mg/kg; Chr‐H, 40 mg/kg, n = 6; (H) enrichment analysis of GO and KEGG; (I) protein–protein interaction (PPI) network of differential genes in MDSCs; (J) the effects of Chr on RhoA, Akt and p‐Akt in G‐MDSC at the protein level, as detected by Western blot. Data expressed as mean ± SD. ns, not significant. *p < .05, **p < .01. Chr‐L, 10 µM; Chr‐H, 20 µM
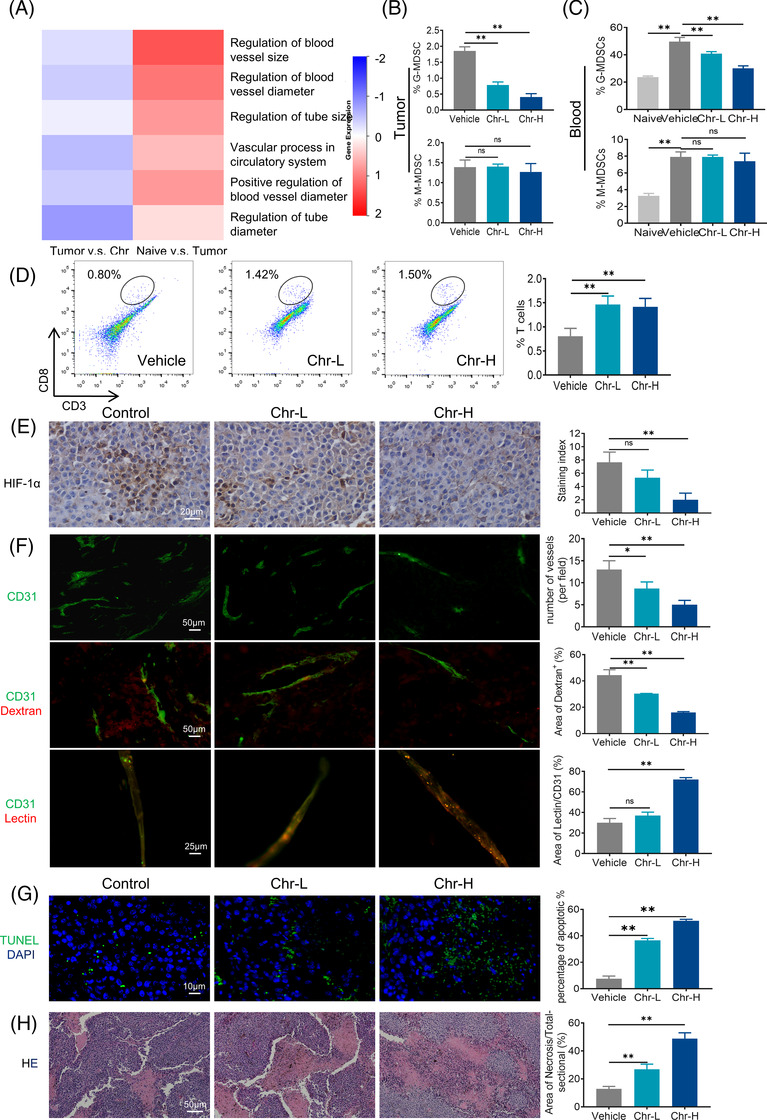
Chrysin inhibits the promotion capability of myeloid‐derived suppressor cells (MDSCs) on tumour angiogenesis in vivo: (A) proteomic analysis of angiogenesis‐related pathways; (B and C) flow cytometric analysed the ratio of MDSCs in tumour and peripheral blood of B16‐F10 tumour‐bearing mice after Chr treatment; (D) flow cytometry was used to analyse CD8+ T cells infiltration in tumour tissues after Chr treatment; (E) representative image of immunohistochemistry (IHC) analysis of hypoxia‐inducible factor (HIF)‐1α expression in tumour tissues; (F) microvascular densities, vascular permeability and vascular perfusion changes in tumours of each group; (G) apoptosis evaluation by TUNEL assay in each group; (H) representative haematoxylin and eosin (HE) staining of tumours sections in each group. Quantification was performed on three random visual fields for each sample (three sample per group). Data expressed as mean ± SD. ns, not significant. *p < .05, **p < .01. Chr‐L, 20 mg/kg; Chr‐H, 40 mg/kg
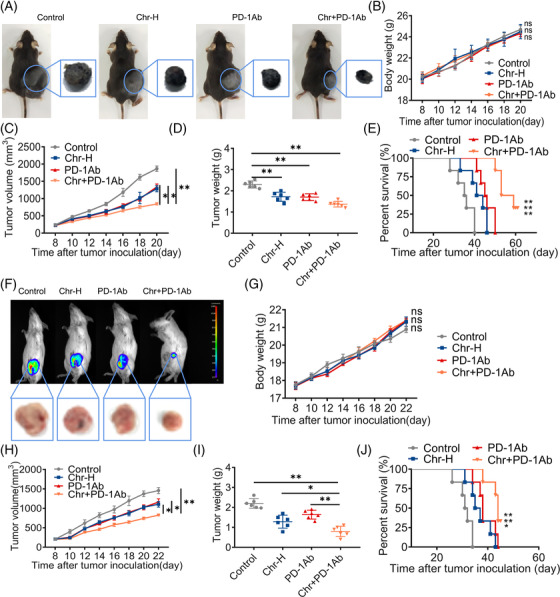
Chrysin synergistically enhances the anti‐tumour activity of PD‐1 inhibitors: (A) representative photographs of transplanted tumours at the end of the experiment; change in mouse body weight (B), tumour volume (C) and tumour weight (D) after administration of Chr and PD‐1 Ab, whether alone or in combination; (E) survival curve of B16‐F10 tumour‐bearing mice after Chr and PD‐1 Ab were administered individually or in combination; (F) analysis of 4T1‐Luc tumour by live‐animal fluorescence imaging; change in mouse body weight (G), tumour volume (H) and tumour weight (I) after the administration of Chr and PD‐1 Ab in 4T1 tumour‐bearing BALB/C mice; (J) survival curve of 4T1 tumour‐bearing BALB/C mice after Chr and PD‐1 mAb were administered individually or in combination. Data expressed as mean ± SD, n = 6. ns, not significant. *p < .05, **p < .01. Chr‐H, 40 mg/kg; PD‐1 Ab, 10 mg/kg; Chr, 40 mg/kg + PD‐1 Ab, 10 mg/kg
Similar articles
-
Targeting Inhibition of Accumulation and Function of Myeloid-Derived Suppressor Cells by Artemisinin via PI3K/AKT, mTOR, and MAPK Pathways Enhances Anti-PD-L1 Immunotherapy in Melanoma and Liver Tumors.J Immunol Res. 2022 Jun 22;2022:2253436. doi: 10.1155/2022/2253436. eCollection 2022. J Immunol Res. 2022. PMID: 35785030 Free PMC article.
-
Immunosuppressive Effects of Myeloid-Derived Suppressor Cells in Cancer and Immunotherapy.Cells. 2021 May 11;10(5):1170. doi: 10.3390/cells10051170. Cells. 2021. PMID: 34065010 Free PMC article. Review.
-
Prim-O-glucosylcimifugin enhances the antitumour effect of PD-1 inhibition by targeting myeloid-derived suppressor cells.J Immunother Cancer. 2019 Aug 28;7(1):231. doi: 10.1186/s40425-019-0676-z. J Immunother Cancer. 2019. PMID: 31462297 Free PMC article.
-
TIGIT/CD155 blockade enhances anti-PD-L1 therapy in head and neck squamous cell carcinoma by targeting myeloid-derived suppressor cells.Oral Oncol. 2021 Oct;121:105472. doi: 10.1016/j.oraloncology.2021.105472. Epub 2021 Jul 30. Oral Oncol. 2021. PMID: 34333450
-
Role of myeloid-derived suppressor cells in immune checkpoint inhibitor therapy in cancer.Arch Pharm Res. 2019 Jul;42(7):560-566. doi: 10.1007/s12272-019-01165-6. Epub 2019 May 30. Arch Pharm Res. 2019. PMID: 31147902 Review.
Cited by
-
Electrospun Nanofibers from Plant Natural Products: A New Approach Toward Efficient Wound Healing.Int J Nanomedicine. 2024 Dec 27;19:13973-13990. doi: 10.2147/IJN.S501970. eCollection 2024. Int J Nanomedicine. 2024. PMID: 39742091 Free PMC article. Review.
-
Flavonoids in the Treatment of Non-small Cell Lung Cancer via Immunomodulation: Progress to Date.Mol Diagn Ther. 2025 May;29(3):307-327. doi: 10.1007/s40291-025-00772-y. Epub 2025 Mar 4. Mol Diagn Ther. 2025. PMID: 40036006 Review.
-
Anti-Inflammatory Mechanisms of Dietary Flavones: Tapping into Nature to Control Chronic Inflammation in Obesity and Cancer.Int J Mol Sci. 2022 Dec 12;23(24):15753. doi: 10.3390/ijms232415753. Int J Mol Sci. 2022. PMID: 36555392 Free PMC article. Review.
-
Metabolic reprogramming and therapeutic resistance in primary and metastatic breast cancer.Mol Cancer. 2024 Nov 21;23(1):261. doi: 10.1186/s12943-024-02165-x. Mol Cancer. 2024. PMID: 39574178 Free PMC article. Review.
-
Advancements and recent explorations of anti-cancer activity of chrysin: from molecular targets to therapeutic perspective.Explor Target Antitumor Ther. 2024;5(3):477-494. doi: 10.37349/etat.2024.00230. Epub 2024 May 23. Explor Target Antitumor Ther. 2024. PMID: 38966181 Free PMC article. Review.
References
-
- Si Y, Merz SF, Jansen P, et al. Multidimensional imaging provides evidence for down‐regulation of T cell effector function by MDSC in human cancer tissue. Sci Immunol. 2019;4(40):eaaw9159. - PubMed
Publication types
MeSH terms
Substances
LinkOut - more resources
Full Text Sources
Medical