. 2022 Sep 2;22(10):16.
doi: 10.1167/jov.22.10.16.

Magnetoencephalography contrast adaptation reflects perceptual adaptation

Affiliations

Magnetoencephalography contrast adaptation reflects perceptual adaptation

Erin Goddard et al. J Vis. .

Abstract

Contrast adaptation is a fundamental visual process that has been extensively investigated and used to infer the selectivity of visual cortex. We recently reported an apparent disconnect between the effects of contrast adaptation on perception and functional magnetic resonance imaging BOLD response adaptation, in which adaptation between chromatic and achromatic stimuli measured psychophysically showed greater selectivity than adaptation measured using BOLD signals. Here we used magnetoencephalography (MEG) recordings of neural responses to the same chromatic and achromatic adaptation conditions to characterize the neural effects of contrast adaptation and to determine whether BOLD adaptation or MEG better reflect the measured perceptual effects. Participants viewed achromatic, L-M isolating, or S-cone isolating radial sinusoids before adaptation and after adaptation to each of the three contrast directions. We measured adaptation-related changes in the neural response to a range of stimulus contrast amplitudes using two measures of the MEG response: the overall response amplitude, and a novel time-resolved measure of the contrast response function, derived from a classification analysis combined with multidimensional scaling. Within-stimulus adaptation effects on the contrast response functions in each case showed a pattern of contrast-gain or a combination of contrast-gain and response-gain effects. Cross-stimulus adaptation conditions showed that adaptation effects were highly stimulus selective across early, ventral, and dorsal visual cortical areas, consistent with the perceptual effects.


Figures

Figure 1.
Figure 1.
Spatial and temporal stimulus properties. (A) Adaptor and test stimuli were radial sinewave gratings calibrated to isolate the Ach, RG, or BY responses. (B) Example time course of “no adaptor” blocks with test stimulus trials shown in blue, each including one cycle of the 2 Hz sinusoidal contrast phase alternation in the 500 ms test interval. (C) Example time course of “adapt” blocks, with 1.5 seconds of top-up adaptor shown in orange (that follows a single 60-second initial adaptation), and test stimulus trials shown in blue. In one MEG recording session, one type of adaptor was shown (Ach, RG, or BY) but across trials test stimuli were either Ach, RG, or BY.
Figure 2.
Figure 2.
Example data for one participant under one adaptation condition (adapt Achromatic). The leftmost and center columns have the same plotting conventions and show data following no adaptor and an achromatic adaptor respectively, with the stimulus contrast over the same timescale shown in dashed green lines of the uppermost plot (the two lines show the two stimulus phases). In the remaining plots of the leftmost and center columns, responses to each test stimulus (A, achromatic; B, RG; C, BY) are plotted at each contrast (four contrasts in descending order from upper to lower plots, with response during blank trials in lowermost plots). Thin lines give average responses and thicker lines give best-fitting model response to the same data. The model was the sum of two gamma functions to capture the two-peaked responses to the counter-phasing stimuli (each trial included one full cycle). Model fits to blank trials were included to estimate baseline response. Raw data are shown from −100 to 600 ms relative to stimulus onset, but only data from 50 to 600 ms after stim onset were fit with the model. From these model fits, we summarized response amplitude at each contrast using the maximum minus minimum, minus the same measure for baseline (blank trials). Response amplitudes for this subject/adaptation condition are shown in the rightmost plots.
Figure 3.
Figure 3.
Effect of adaptation on average response across all adaptation conditions. Each pair of plots (line plot and scatterplot) show data for a single test stimulus (A, Ach; B, RG; C, BY) and a single adaptation condition (see titles at the top of each column). Line plots follow the conventions of those in the rightmost plots of Figure 2. The shaded regions give 95% confidence intervals of the between-subject mean (n = 6). The scatter plots show the same data condensed to an area under the curve (i.e., the sum of the responses at each non-zero stimulus contrast) for the no adapt condition (x-axis) versus for the adapt condition (y-axis). In the scatter plots, each marker shows data for a single subject. Results of statistical analyses of these adaptation effects are shown in Figure 7C, where data from the scatter plots are replotted. Cases of within-stimulus adaptation are highlighted with bold lines (line plots) and filled markers (scatterplots).
Figure 4.
Figure 4.
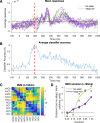
Illustration of classification and MDS-based approach for an example participant, in one condition (achromatic test stimulus, during the achromatic adaptation session): the same data as shown in Figure 2. (A) Average response to the 20 unique achromatic or blank trial types during this session, with line colored according to whether or not they were presented during adaptation.(B) Average classifier performance for pairwise discriminations of each of the 20 trial types. (C) Dissimilarity matrix (DSM) for a single time bin (t = 195 ms, maximum classifier performance, highlighted with red dashed lines in A and B). Trial types are labeled according to adaptation condition and contrast level (nA/A = no adapt/adapt, C0 = blank, C4 = max contrast), each label includes two rows/columns of the same contrast/adapt condition but different phases. (D) Contrast response functions obtained from MDS (applied to the DSM in C). Each circle corresponds to a response to an Ach stimulus of contrast given by the x-axis (square icons are blank trials: average location was used to define the zero response). Lines show the averages of the two phases of each trial type (circles of same color at each contrast). For the blank trials the two phases were identical.
Figure 5.
Figure 5.
Effect of adaptation on overall level of response to Ach (A), RG (B) and BY (C) stimuli over time, as measured using area under the MDS-based contrast response functions. Left plots show stimulus response during no-adapt and within-stimulus adaptation. Right plots show the difference (Adapted response minus unadapted response) for both within-stimulus (filled lines) and cross-stimulus (dashed lines) adaptation. Shaded regions indicate the 95% confidence intervals of the between-subjects mean. Below the data in the right plots, results of the Bayes factor analysis, applied to data from each 10 ms bin, are shown. Colored circles show times where that adaptor reduced the response to the test stimulus, whereas colored triangles show times where that cross-stimulus adaptor induced a smaller effect than the within-stimulus adaptor. For both circles and triangle, small gray markers show times where there was at least moderate evidence (BF < 0.33) in favor of no effect.
Figure 6.
Figure 6.
Effect of adaptation on the shape of the contrast response functions. Here we fit Naka-Rushton equations to the average (n = 6) MDS-based contrast response for each 10 ms time bin. (A) Example average contrast responses (dots) for within-stimulus adaptation, and Naka-Rushton fits (lines) for data from around the first peak (175–275 ms): see Supplementary Material for data across each 10 ms time bins (as movies). (B, C) The best fitting Naka-Rushton equations were summarized by two measures: their maximum response (B) and the contrast at which they reached half their maximum (C). These summary values are plotted with one marker for each time bin (every 10 ms from 50 ms to 600 ms), for no adapt versus adapt; the color of the marker indicates the adaptation condition, and filled markers highlight cases of within-stimulus adaptation.
Figure 7.
Figure 7.
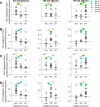
Comparison of adaptation effects across psychophysical and MEG measurements in EVC. (A, B) Changes in psychophysical detection thresholds (A) and points of subjectively equal contrast (B): data replotted from Goddard et al. (2019), Figure 7. (C, D) MEG adaptation effects based on differences between the area under the contrast response function of the test stimulus without adaptation and during adaptation, where the contrast response functions were measured using univariate (C) and classifier/MDS (D) metrics (MDS: responses were averaged across 50-600 ms to match epoch for amplitude-based analysis). In each plot, the circular markers show values for each participant (A, B: n = 10; C, D: n = 6), along with the mean (thick black line). Black markers above the data indicate cases of significant adaptation effects, whereas red markers indicate whether adaptation effects were greater in the within-stimulus compared to cross-stimulus conditions, in each case FDR corrected (** q < 0.01, * q < 0.05) or approaching significance (+ p < 0.05, not FDR corrected). Results with moderate (BF > 3) or strong effects (BF > 10), are highlighted with green or cyan squares respectively. Cases with at least moderate evidence in favor of a null effect (BF < 0.33) are indicated with a grey square. See Supplementary Table S1 for exact statistical values.
Figure 8.
Figure 8.
Comparison of adaptation effects using both MEG measurements in VVC (A, B) and DVC (C, D), measured using univariate (A, C) and classifier/MDS (B, D) metrics. Other plotting conventions are as in Figure 7.

References

    1. Albrecht, D. G., Farrar, S. B., & Hamilton, D. B. (1984). Spatial contrast adaptation characteristics of neurones recorded in the cat's visual cortex. The Journal of Physiology, 347, 713–739. - PMC - PubMed
    1. Baillet, S. (2017). Magnetoencephalography for brain electrophysiology and imaging. Nature Neuroscience, 20(3), 327–339, 10.1038/nn.4504. - DOI - PubMed
    1. Bartsch, M. V., Loewe, K., Merkel, C., Heinze, H.-J., Schoenfeld, M. A., Tsotsos, J. K., & Hopf, J.-M. (2017). Attention to Color Sharpens Neural Population Tuning via Feedback Processing in the Human Visual Cortex Hierarchy. Journal of Neuroscience, 37(43), 10346–10357, 10.1523/JNEUROSCI.0666-17.2017. - DOI - PMC - PubMed
    1. Benjamini, Y., & Hochberg, Y. (1995). Controlling the False Discovery Rate: A Practical and Powerful Approach to Multiple Testing. Journal of the Royal Statistical Society. Series B (Methodological), 57(1), 289–300.
    1. Blakemore, C., & Campbell, F. W. (1969). On the existence of neurones in the human visual system selectively sensitive to the orientation and size of retinal images. Journal of Physiology, 203(1), 237–260. - PMC - PubMed

Publication types