

The abundance, biomass, and distribution of ants on Earth
- PMID: 36122199
- PMCID: PMC9546634
- DOI: 10.1073/pnas.2201550119
The abundance, biomass, and distribution of ants on Earth
Abstract
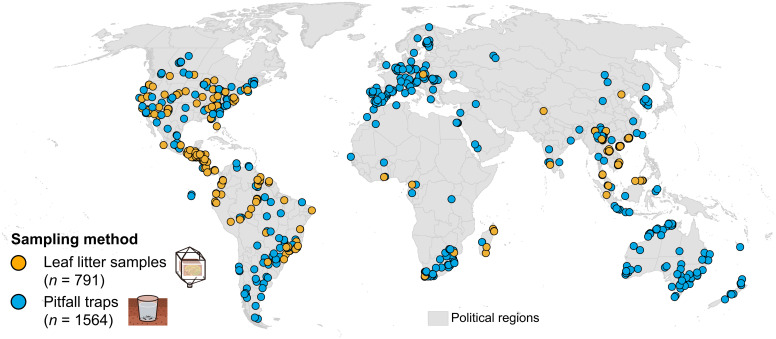
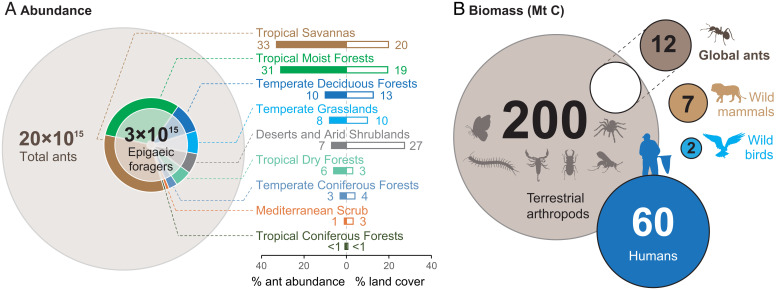
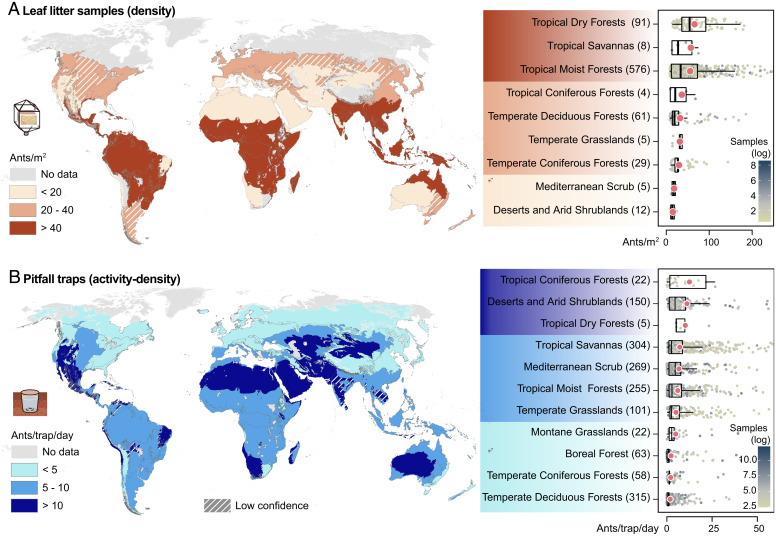
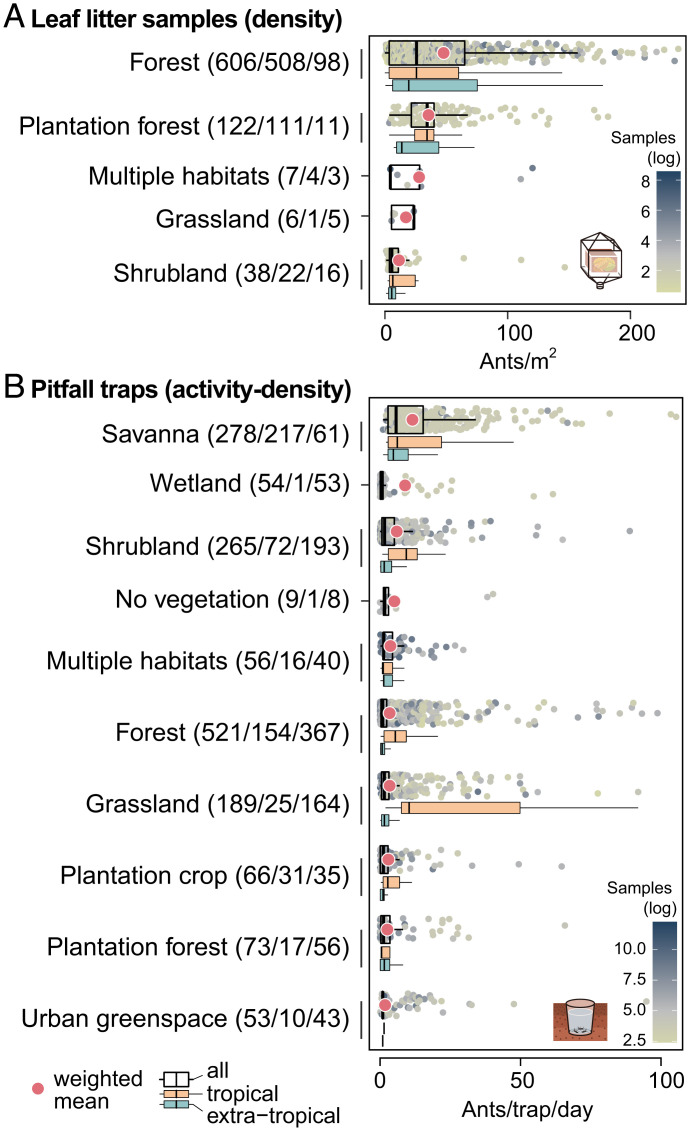
Knowledge on the distribution and abundance of organisms is fundamental to understanding their roles within ecosystems and their ecological importance for other taxa. Such knowledge is currently lacking for insects, which have long been regarded as the "little things that run the world". Even for ubiquitous insects, such as ants, which are of tremendous ecological significance, there is currently neither a reliable estimate of their total number on Earth nor of their abundance in particular biomes or habitats. We compile data on ground-dwelling and arboreal ants to obtain an empirical estimate of global ant abundance. Our analysis is based on 489 studies, spanning all continents, major biomes, and habitats. We conservatively estimate total abundance of ground-dwelling ants at over 3 × 10¹⁵ and estimate the number of all ants on Earth to be almost 20 × 1015 individuals. The latter corresponds to a biomass of ∼12 megatons of dry carbon. This exceeds the combined biomass of wild birds and mammals and is equivalent to ∼20% of human biomass. Abundances of ground-dwelling ants are strongly concentrated in tropical and subtropical regions but vary substantially across habitats. The density of leaf-litter ants is highest in forests, while the numbers of actively ground-foraging ants are highest in arid regions. This study highlights the central role ants play in terrestrial ecosystems but also major ecological and geographic gaps in our current knowledge. Our results provide a crucial baseline for exploring environmental drivers of ant-abundance patterns and for tracking the responses of insects to environmental change.
Keywords: Formicidae; density; diversity; insect; worldwide.
Conflict of interest statement
The authors declare no competing interest.
Figures
Comment in
-
Improving estimates of global ant biomass and abundance.Proc Natl Acad Sci U S A. 2022 Oct 18;119(42):e2214825119. doi: 10.1073/pnas.2214825119. Epub 2022 Oct 5. Proc Natl Acad Sci U S A. 2022. PMID: 36197959 Free PMC article. No abstract available.
References
-
- Wilson E. O., The little things that run the world (the importance and conservation of invertebrates). Conserv. Biol. 1, 344–346 (1987).
-
- Brusca R. C., Moore W., Shuster S. M., Invertebrates (Sinauer Associates, Sunderland, ed. 3, 2016).
-
- Stork N. E., How many species of insects and other terrestrial arthropods are there on Earth? Annu. Rev. Entomol. 63, 31–45 (2018). - PubMed
-
- Prather C. M., et al. , Invertebrates, ecosystem services and climate change. Biol. Rev. Camb. Philos. Soc. 88, 327–348 (2013). - PubMed
-
- Losey J. E., Vaughan M., The economic value of ecological services provided by insects. Bioscience 56, 311–323 (2006).
Publication types
MeSH terms
LinkOut - more resources
Full Text Sources
