. 2022 Sep 27;119(39):e2202178119.
doi: 10.1073/pnas.2202178119. Epub 2022 Sep 19.

Oxygen regulation of breathing is abolished in mitochondrial complex III-deficient arterial chemoreceptors

Affiliations

Oxygen regulation of breathing is abolished in mitochondrial complex III-deficient arterial chemoreceptors

Daniel Cabello-Rivera et al. Proc Natl Acad Sci U S A. .

Abstract

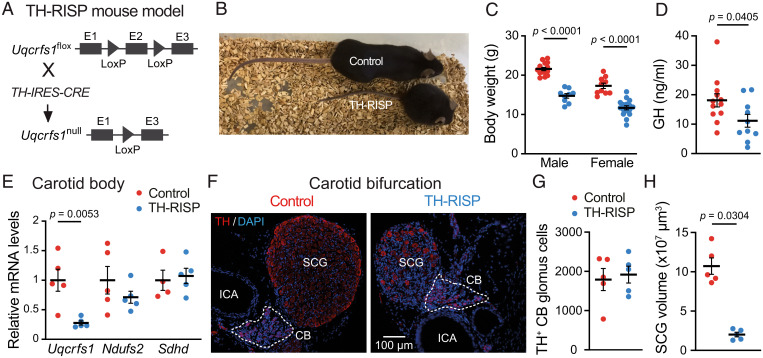
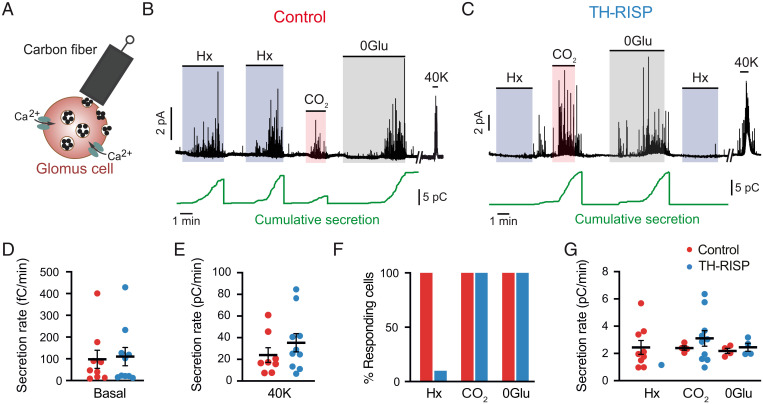
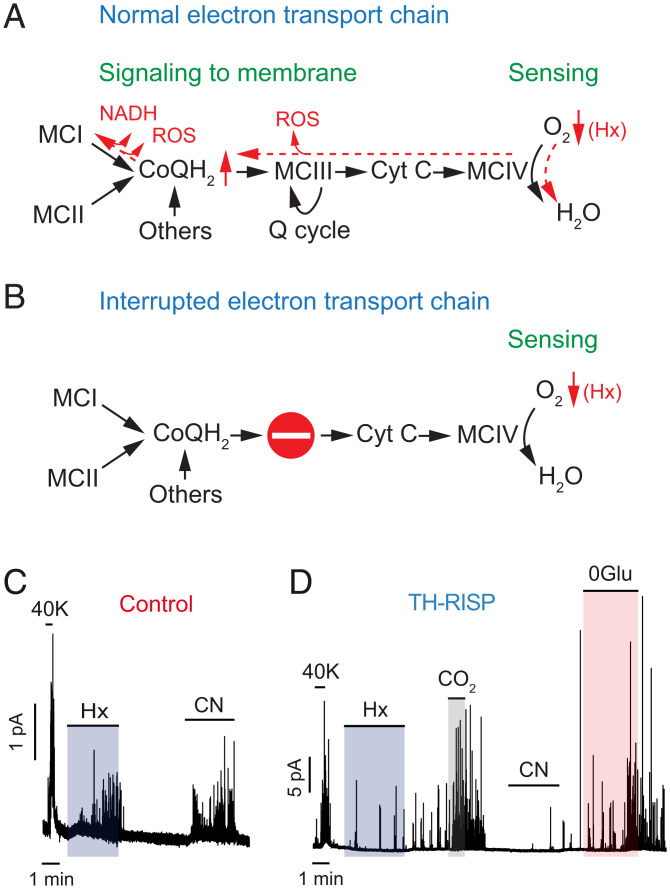
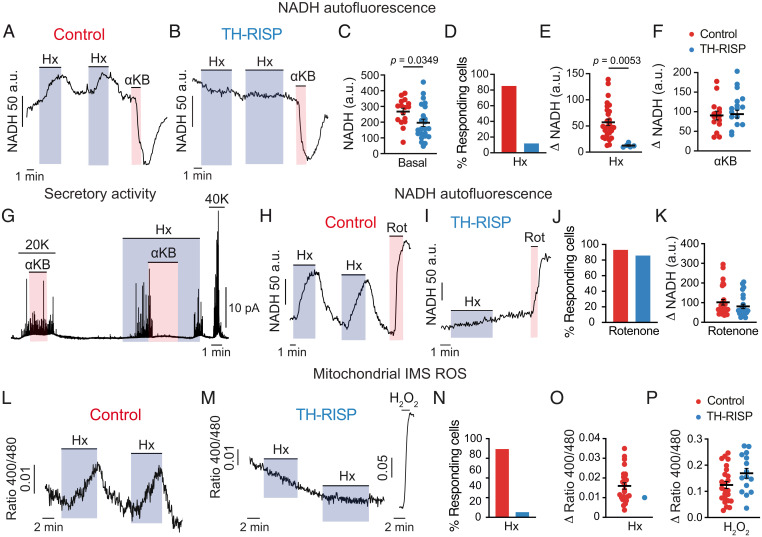
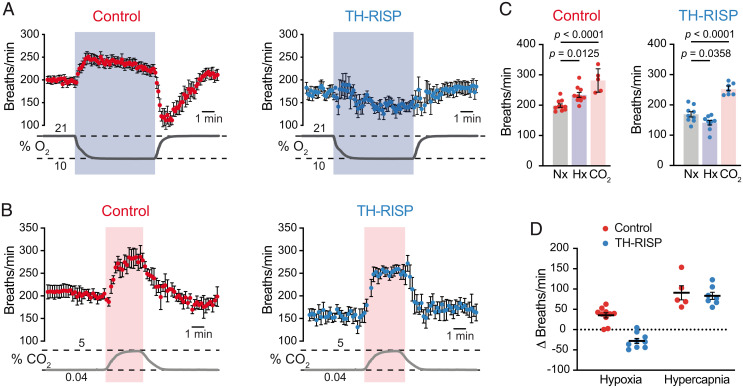
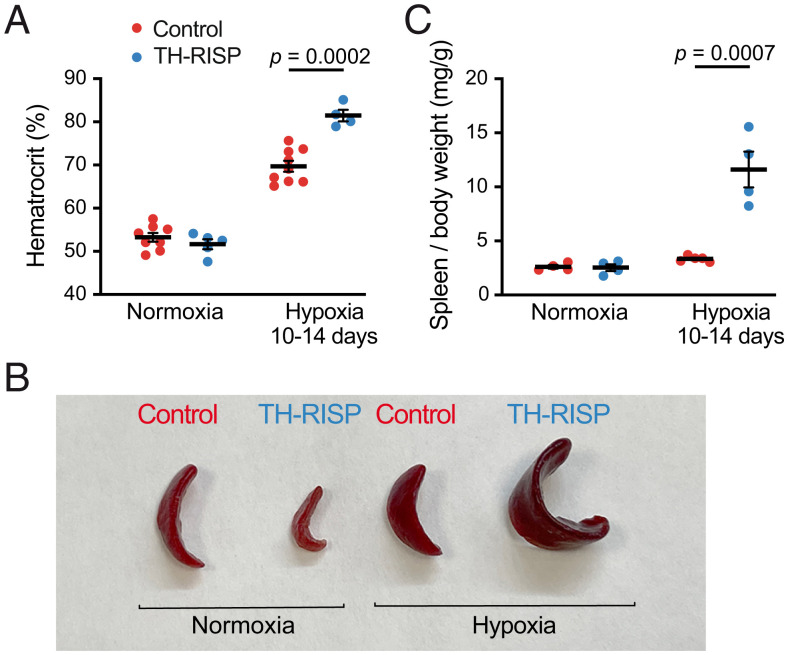
Acute oxygen (O2) sensing is essential for adaptation of organisms to hypoxic environments or medical conditions with restricted exchange of gases in the lung. The main acute O2-sensing organ is the carotid body (CB), which contains neurosecretory chemoreceptor (glomus) cells innervated by sensory fibers whose activation by hypoxia elicits hyperventilation and increased cardiac output. Glomus cells have mitochondria with specialized metabolic and electron transport chain (ETC) properties. Reduced mitochondrial complex (MC) IV activity by hypoxia leads to production of signaling molecules (NADH and reactive O2 species) in MCI and MCIII that modulate membrane ion channel activity. We studied mice with conditional genetic ablation of MCIII that disrupts the ETC in the CB and other catecholaminergic tissues. Glomus cells survived MCIII dysfunction but showed selective abolition of responsiveness to hypoxia (increased [Ca2+] and transmitter release) with normal responses to other stimuli. Mitochondrial hypoxic NADH and reactive O2 species signals were also suppressed. MCIII-deficient mice exhibited strong inhibition of the hypoxic ventilatory response and altered acclimatization to sustained hypoxia. These data indicate that a functional ETC, with coupling between MCI and MCIV, is required for acute O2 sensing. O2 regulation of breathing results from the integrated action of mitochondrial ETC complexes in arterial chemoreceptors.

Keywords: acute O2 sensing; carotid body glomus cell; hypoxia; mitochondrial O2 sensing and signaling; mitochondrial complex III.


Conflict of interest statement

The authors declare no competing interest.

Figures

Fig. 1.
Fig. 1.
General characteristics of TH-RISP mice. (A) Generation of the conditional TH-RISP mouse model. (B) Representative photograph of male control and TH-RISP mice (P40). (C) Body weight of control and TH-RISP mice at ∼P40 (male: n = 9 to 15 mice per group; female: n = 10 to 16 mice per group). Data are expressed as mean ± SEM. Values are: 21.6 ± 0.4 g (male, control), 14.7 ± 0.6 g (male, TH-RISP), 17.3 ± 0.7 g (female, control), and 11.7 ± 0.5 g (female, TH-RISP). (D) Growth hormone (GH) levels in serum of control (n = 12) and TH-RISP (n = 10) mice (∼P40). Data are expressed as mean ± SEM. Values are: 18.1 ± 2.2 ng/mL (control); 11.2 ± 2.2 ng/mL (TH-RISP). (E) Uqcrfs1, Ndufs2, and Sdhd mRNA levels expressed relative to control mice in CBs of control and TH-RISP mice (n = 4 to 5 mice per group). Data are expressed as mean ± SEM. From left to right values are: 1 ± 0.2; 0.3 ± 0.04; 1 ± 0.2; 0.7 ± 0.1; 1 ± 0.17; 1.1 ± 0.13). (F) Immunofluorescence detection of TH (red) in carotid artery bifurcations from control and TH-RISP mice. The white broken line delimits CB perimeter. ICA, internal carotid artery; SCG, superior cervical ganglion. Nuclei were counterstained with DAPI (blue). (G) Quantification of the number of CB TH+ cells of control (1,792 ± 280, n = 5) and TH-RISP (1,918 ± 214, n = 5) mice. (H) Total SCG volume measured in control (10.7 ± 1 × 107 μm3, n = 5) and TH-RISP (2.01 ± 0.3 × 107 μm3, n = 5) mice. Data are expressed as mean ± SEM P values are indicated when data were significantly different (P < 0.05; unpaired Student’s t test).
Fig. 2.
Fig. 2.
Selective abolition of the secretory response to hypoxia in MCIII-deficient glomus cells. (A) Scheme illustrating the monitorization of quantal catecholamine release from single glomus cells by amperometry. (B and C) Representative amperometric recordings of secretory activity induced by hypoxia (Hx, O2 tension ∼15 mmHg), hypercapnia (20% CO2), hypoglycemia (0 glucose, 0Glu), and depolarization with high potassium (40 mM K) in glomus cells from control (B) and TH-RISP (C) mice. Cumulative secretion signals are shown below each trace (green). The vertical lines indicate resetting of the integrator. (D and E) Quantification of the secretion rate of glomus cells in basal condition (D) and in response to 40 mM K (E). Data are expressed as mean ± SEM. Values of basal secretion are: control (red) cells, 97.7 ± 42 fC/min, n = 9 cells/7 mice; RISP-deficient (blue) cells, 110.3 ± 42.1 fC/min, n = 10 cells/7 mice. Values of high K-induced secretion are: control cells, 24 ± 7 pC/min, n = 9 cells/7 mice; RISP-deficient cells, 35.3 ± 8.4 pC/min, n = 10 cells/7 mice. P = 0.34; unpaired Student’s t test. (F) Percentage of glomus cells with a secretory response to hypoxia (Hx), 0 mM glucose (0 Glu), and hypercapnia (CO2) in control and TH-RISP mice. (G) Average secretion rate (pC/min) of glomus cells in response to hypoxia, hypercapnia and hypoglycemia. Data are expressed as mean ± SEM. Values are: hypoxia control (2.4 ± 0.5, n = 9 cells/7 mice); hypoxia TH-RISP (1.2, n = 1 cell); hypercapnia control (2.4 ± 0.2, n = 4 cells/4 mice); hypercapnia TH-RISP (3.1 ± 0.6, n = 10 cells/7 mice), P = 0.46; unpaired Student’s t test; 0Glu control (2.2 ± 0.2, 4 cells/3 mice); 0Glu TH-RISP (2.5 ± 0.3, 4 cells/3 mice), P = 0.47; unpaired Student’s t test.
Fig. 3.
Fig. 3.
Interruption of the mitochondrial electron transport chain and abolition of responsiveness to cyanide in MCIII-deficient glomus cells. (A and B) Scheme of the ETC and dynamic changes (in red) induced by hypoxia (Hx) (A). The stop signal indicates interruption of the ETC in RISP-deficient cells (B). CoQH2, reduced ubiquinone); Cyt C, cytochrome c; Q cycle, quinone cycle. (C) Representative amperometric recordings of the secretory activity induced by high K (40K), hypoxia (Hx), and cyanide (200 μM) in glomus cells from control mice. Similar results were obtained in four cells/three mice tested. (D) Representative amperometric recordings of the secretory activity induced by the same stimuli tested in (C), plus 0Glu and hypercapnia (CO2), in a RISP-deficient glomus cell. Note in D the selective inhibition of responsiveness to hypoxia and cyanide. Similar results were obtained in six cells/three mice tested.
Fig. 4.
Fig. 4.
Inhibition of hypoxia-induced mitochondrial signaling in MCIII-deficient glomus cells. (A and B) Representative recordings of changes in NADH in response to hypoxia and αKB in glomus cells from control (A) and TH-RISP (B) mice. (C) Basal NADH levels measured in control (268 ± 21 a.u., n = 33 cells/7 mice) and RISP-deficient (196 ± 23 a.u., n = 42 cells/7 mice) glomus cells. (D) Percentage of cells with a hypoxia-induced increase in NADH in control and TH-RISP mice. (E) Increase in NADH (Δ NADH) elicited by hypoxia (Hx, O2 tension ∼15 mm Hg) in control (57 ± 6 a.u., n = 29 cells/7 mice) and RISP-deficient (13 ± 2 a.u., n = 5 cells/7 mice) glomus cells. (F) Changes in NADH in response to αKB, 1 mM) in control (90 ± 11 a.u., n = 14 cells/4 mice) and RISP-deficient (93 ± 10 a.u., n = 16 cells/3 mice) glomus cells. (G) Representative recording illustrating the inhibition of the secretory response to hypoxia by αKB (1 mM) and the lack of effect of this agent on the secretory response to high K in a control glomus cell. Similar results obtained in n = 6 cells/4 mice for 20 mM K and n = 8 cells/5 mice for hypoxia (Hx, O2 tension ∼15 mmHg). (H and I) Representative recordings of NADH changes induced by hypoxia (Hx) and rotenone (Rot, 1 μM) in glomus cells from control (H) and TH-RISP (I) mice. (J) Percentage of cells with an increase in NADH induced by rotenone in control (red bar) and TH-RISP (blue bar) glomus cells. (K) Changes in NADH in response to rotenone (1 μM) in control (red symbols, 102 ± 14 a.u., n = 27 cells/5 mice) and RISP-deficient (blue symbols, 81 ± 11 a.u., n = 24 cells/5 mice) glomus cells. (L and M) Real-time changes ROS in the mitochondrial IMS induced by hypoxia (Hx) in control (L) and RISP-deficient (M) glomus cells. The response to 0.2 mM H2O2 was tested (in M) to ensure correct functioning of the mitochondrial roGFP probes. (N) Percentage of glomus cells with hypoxia induced increase in IMS ROS. Control mice (n = 30 cells/21 mice); TH-RISP mice (n = 17 cells/13 mice). (O) Hypoxia-induced increase in IMS ROS signal (Δ 400/480 ratio) in hypoxia-responsive glomus cells. Control cells (0.016 ± 0.002, n = 21 cells/17 mice); RISP-deficient cells (0.01, n = 1 cell/1 mouse). (P) Increase in IMS ROS (Δ 400/480 ratio) in response to 0.2 mM H2O2 in glomus cells. Control cells (0.124 ± 0.014, n = 24 cells/17 mice); RISP-deficient cells (0.169 ± 0.019, n = 15 cell/11 mice). In all panels data are expressed as mean ± SEM P values are indicated when data were significantly different (P < 0.05; unpaired Student’s t test).
Fig. 5.
Fig. 5.
Inhibition of the hypoxic ventilatory response in TH-RISP mice. (A and B) Average time course of plethysmographic recordings illustrating the increase in respiratory frequency induced by hypoxia (10% O2) (A) and hypercapnia (5% CO2) (B) in control and TH-RISP mice. Changes in air O2 and CO2 levels (in percent) are represented at the bottom of each panel. (C) Respiratory frequencies measured during normoxia (Nx), hypoxia (Hx), and hypercapnia (CO2) in control and TH-RISP mice. Values (in breaths per minute) are: control (normoxia, 199 ± 6, n = 10; hypoxia, 234 ± 8, n = 10; CO2, 281 ± 17, n = 5); TH-RISP (normoxia, 169 ± 9, n = 9; hypoxia, 141 ± 8, n = 9; CO2, 252 ± 7, n = 7). (D) Average increase in respiratory frequency relative to basal values measured during exposure to hypoxia and hypercapnia in control and TH-RISP mice. Values (in Δ breaths per minute) are: hypoxia (control, 35 ± 6, n = 10; TH-RISP, −28 ± 6, n = 9); hypercapnia (control, 91 ± 17, n = 5; TH-RISP, 83 ± 9, n = 7). Data are expressed as mean ± SEM P values are indicated in the figure when data were significantly different (P < 0.05; paired one-way ANOVA).
Fig. 6.
Fig. 6.
Altered acclimatization to hypoxia in TH-RISP mice. (A) Increase in hematocrit during chronic hypoxia (10 to 14 d in 10% O2) in control and TH-RISP mice (P25). Values are: normoxia (control, 53 ± 1%, n = 8; TH-RISP, 52 ± 1%, n = 5); hypoxia (control, 70 ± 1%, n = 9; TH-RISP, 81 ± 1%, n = 4). (B) Representative photographs of spleen from control and TH-RISP mice maintained in normoxia or in chronic hypoxia. (C) Quantification of spleen weight relative to body weight in normoxic and chronic hypoxic mice. Values are: normoxia (control, 2.6 ± 0.2 mg/g, n = 4; TH-RISP, 2.6 ± 0.3 mg/g, n = 4); hypoxia (control, 3.3 ± 0.1 mg/g, n = 5; TH-RISP, 11.6 ± 1.7 mg/g, n = 4). Data are expressed as mean± SEM P values are indicated when data were significantly different (P < 0.05; unpaired Student’s t test).

Similar articles

Cited by

References

    1. López-Barneo J., Simon M. C., Cellular adaptation to oxygen deficiency beyond the Nobel award. Nat. Commun. 11, 607 (2020). - PMC - PubMed
    1. Weir E. K., López-Barneo J., Buckler K. J., Archer S. L., Acute oxygen-sensing mechanisms. N. Engl. J. Med. 353, 2042–2055 (2005). - PMC - PubMed
    1. Ortega-Sáenz P., López-Barneo J., Physiology of the carotid body: From molecules to disease. Annu. Rev. Physiol. 82, 127–149 (2020). - PubMed
    1. Iturriaga R., Alcayaga J., Chapleau M. W., Somers V. K., Carotid body chemoreceptors: Physiology, pathology, and implications for health and disease. Physiol. Rev. 101, 1177–1235 (2021). - PMC - PubMed
    1. Nurse C. A., Synaptic and paracrine mechanisms at carotid body arterial chemoreceptors. J. Physiol. 592, 3419–3426 (2014). - PMC - PubMed

Publication types