. 2022 Dec 2;12(12):2820-2837.
doi: 10.1158/2159-8290.CD-22-0196.

Natural Coevolution of Tumor and Immunoenvironment in Glioblastoma

Affiliations

Natural Coevolution of Tumor and Immunoenvironment in Glioblastoma

Lingxiang Wu et al. Cancer Discov. .

Abstract

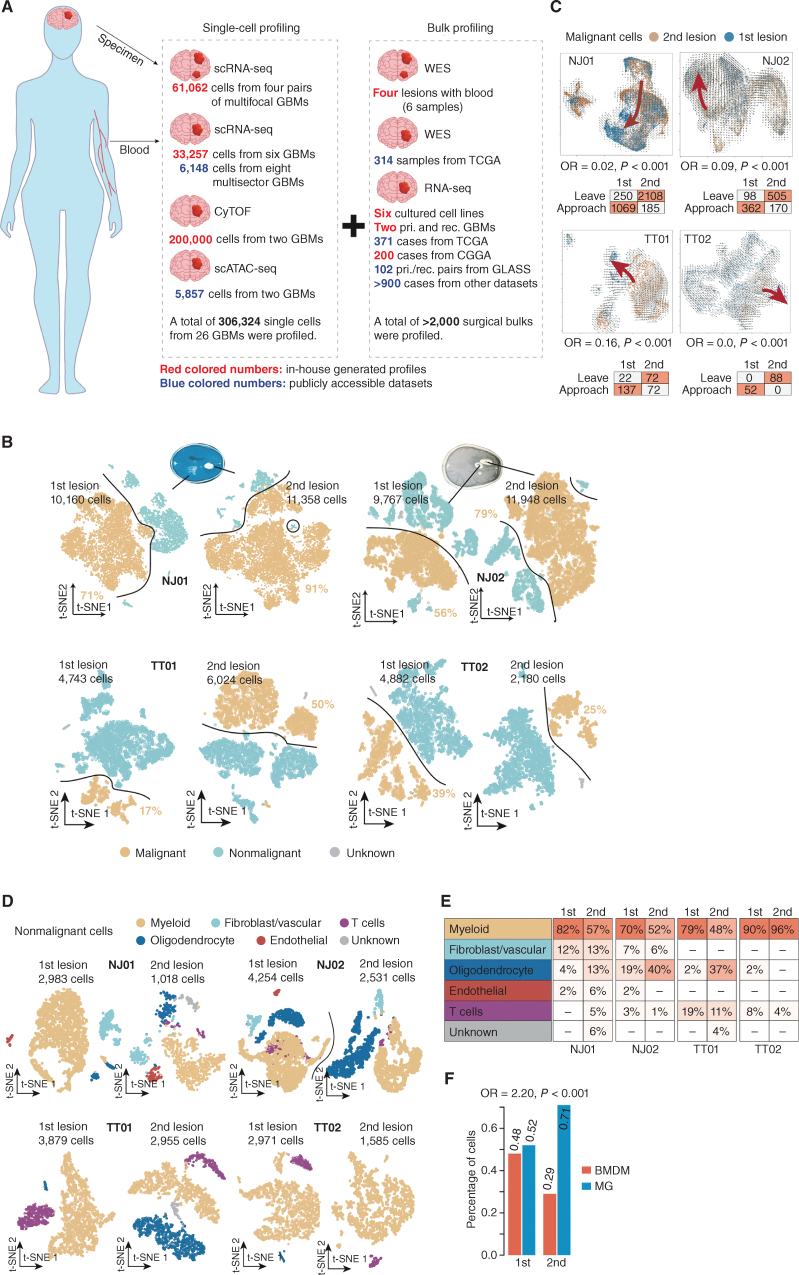
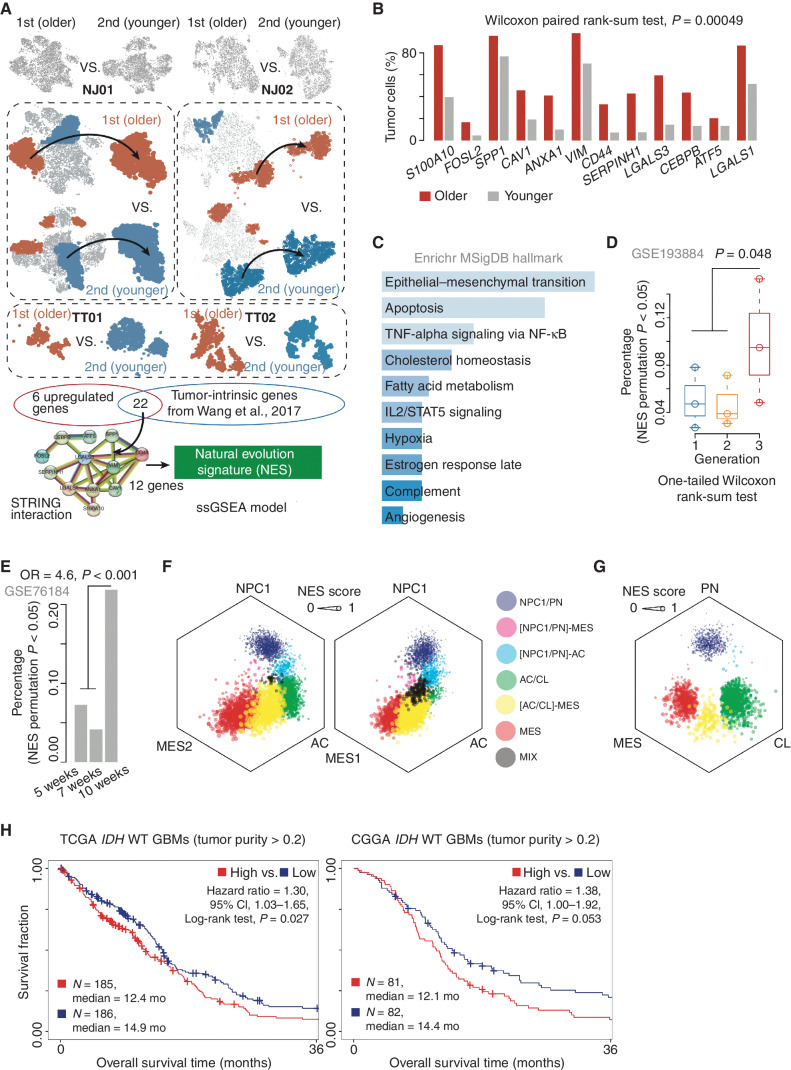
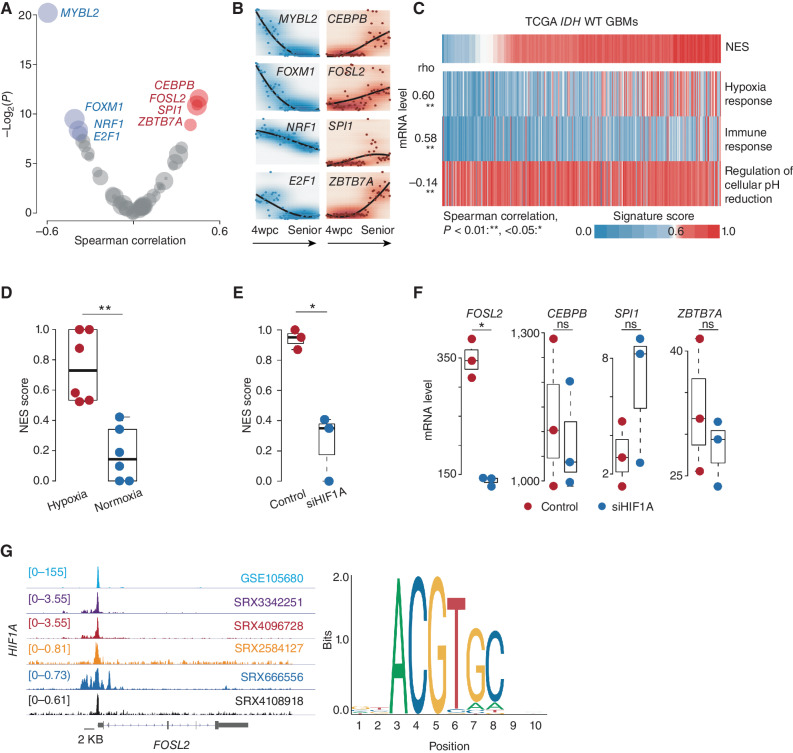
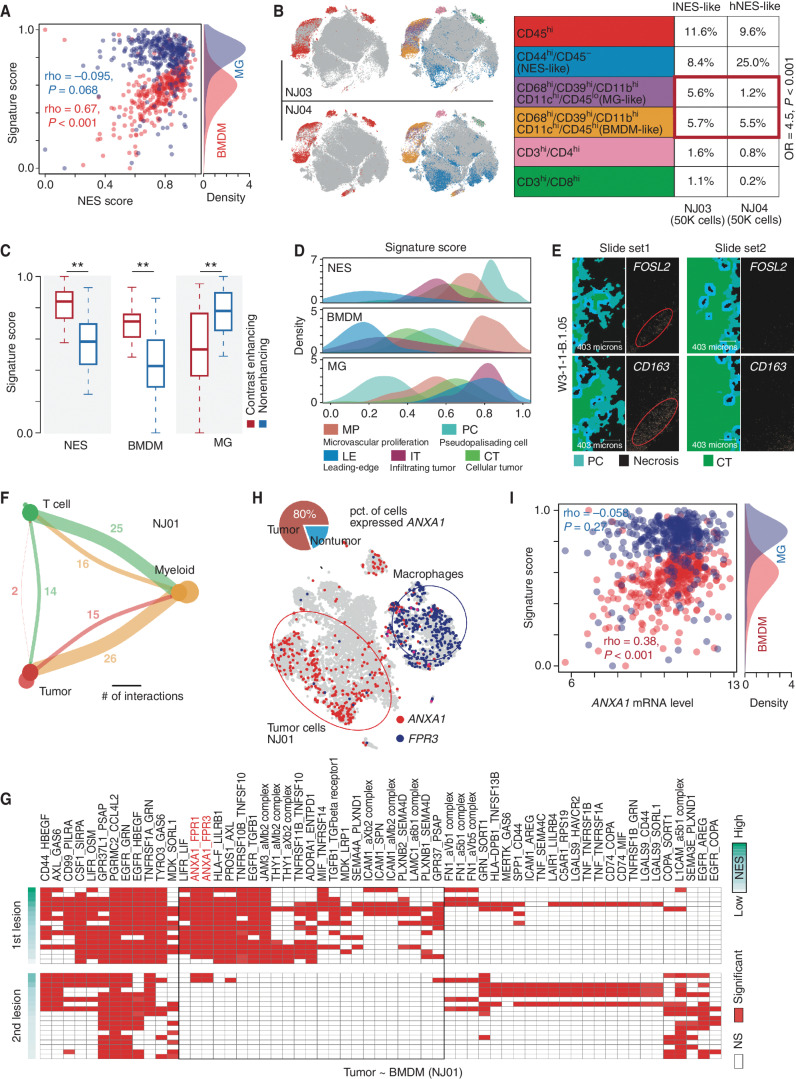
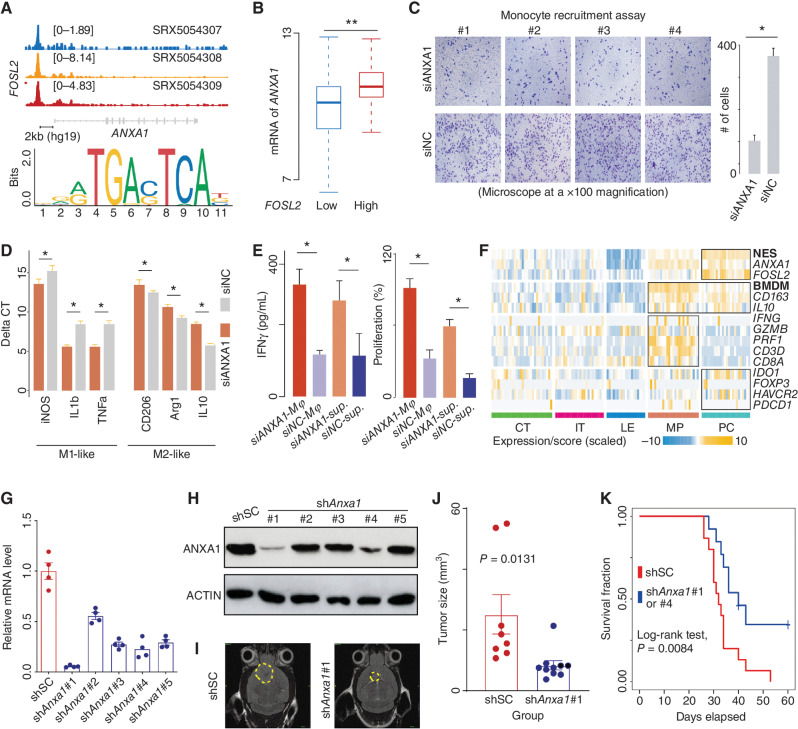
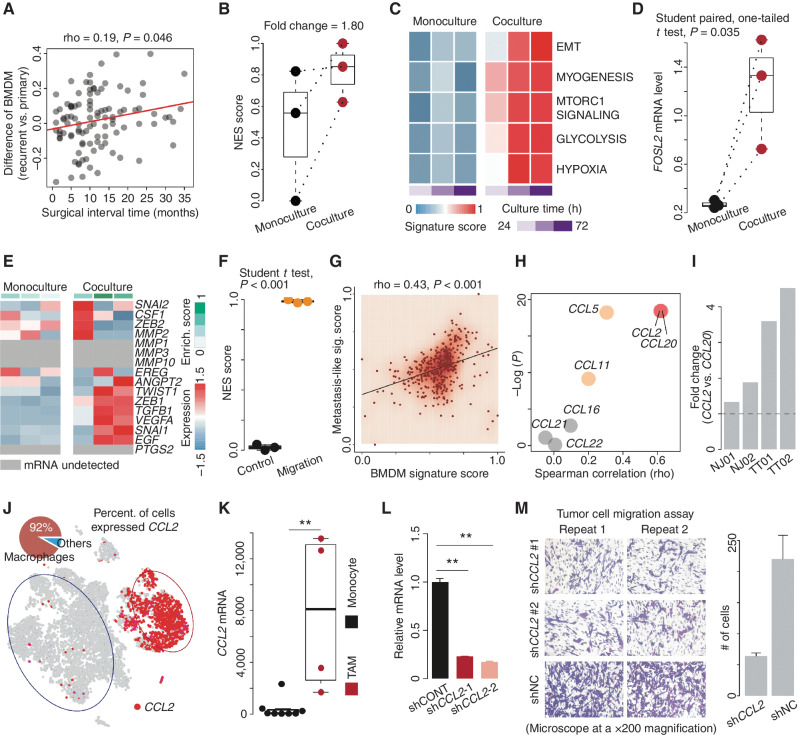
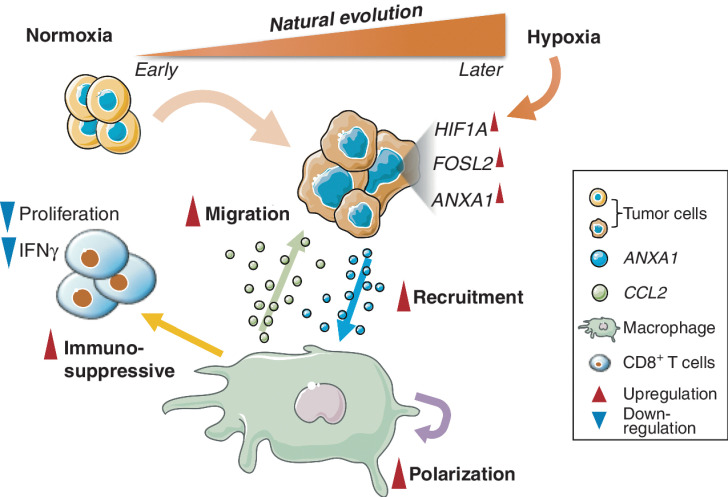
Isocitrate dehydrogenase (IDH) wild-type glioblastoma (GBM) has a dismal prognosis. A better understanding of tumor evolution holds the key to developing more effective treatment. Here we study GBM's natural evolutionary trajectory by using rare multifocal samples. We sequenced 61,062 single cells from eight multifocal IDH wild-type primary GBMs and defined a natural evolution signature (NES) of the tumor. We show that the NES significantly associates with the activation of transcription factors that regulate brain development, including MYBL2 and FOSL2. Hypoxia is involved in inducing NES transition potentially via activation of the HIF1A-FOSL2 axis. High-NES tumor cells could recruit and polarize bone marrow-derived macrophages through activation of the FOSL2-ANXA1-FPR1/3 axis. These polarized macrophages can efficiently suppress T-cell activity and accelerate NES transition in tumor cells. Moreover, the polarized macrophages could upregulate CCL2 to induce tumor cell migration.

Significance: GBM progression could be induced by hypoxia via the HIF1A-FOSL2 axis. Tumor-derived ANXA1 is associated with recruitment and polarization of bone marrow-derived macrophages to suppress the immunoenvironment. The polarized macrophages promote tumor cell NES transition and migration. This article is highlighted in the In This Issue feature, p. 2711.


Figures

Figure 1. Comparative characterization of multifocal GBMs and TME by scRNA-seq. A, Schematic workflow for the construction of single-cell multifocal GBM transcriptomes. B, t-SNE plot of malignant (orange dots) and nonmalignant (blue dots) cells in the first and second lesions derived from the indicated cases. C, Top, RNA velocity illustrates the direction of tumor cell transition in the t-SNE plot between two lesions across the indicated cases. Bottom, the table shows the number of cells with a putative transition tendency to the center of each lesion. OR indicates odds ratio. D, t-SNE plot of nonmalignant cells in the first and second lesions derived from the indicated cases. E, Comparison of the percentages of different nonmalignant cell types between the first and second lesions across the indicated cases. F, Comparison of percentages of cells identified as BMDMs and MGs in the first and second lesions across the four cases (NJ01, NJ02, TT01, and TT02). OR indicates odds ratio.
Figure 1.
Comparative characterization of multifocal GBMs and the TME by scRNA-seq. A, Schematic workflow for the construction of single-cell multifocal GBM transcriptomes. CGGA, Chinese Glioma Genome Atlas; cyTOF, cytometry by time of flight; pri., primary; rec., recurrent; scATAC-seq, single-cell sequencing assay for transposase-accessible chromatin; TCGA, The Cancer Genome Atlas; WES, whole-exome sequencing. B, T-distributed stochastic neighbor embedding (t-SNE) plots of malignant (orange dots) and nonmalignant (blue dots) cells in the first and second lesions derived from the indicated cases. C, Top, RNA velocity illustrates the direction of tumor cell transition in the t-SNE plots between two lesions across the indicated cases. Bottom, the table shows the number of cells with a putative transition tendency to the center of each lesion. OR, odds ratio.D, t-SNE plot of nonmalignant cells in the first and second lesions derived from the indicated cases. E, Comparison of the percentages of different nonmalignant cell types between the first and second lesions across the indicated cases. F, Comparison of percentages of cells identified as BMDMs and MGs in the first and second lesions across the four cases (NJ01, NJ02, TT01, and TT02).
Figure 2. The NES characterizes tumor progression. A, Schematic diagram of the identification of the GBM NES. B, Bar plot demonstrates the percentage of tumor cells expressing the indicated genes between the first and second lesions across four multifocal GBMs. C, Functional enrichment analysis of the 12 NES genes. MSigDB, Molecular Signatures Database. D, Comparison of the percentage of NES-high tumor cells between the indicated groups. E, A bar plot demonstrates the distribution of NES-high tumor cells across the samples after treatment for 2, 5, and 7 weeks. OR, odds ratio. F and G, Hexagonal plots depict different cellular state or subtype signature scores for malignant cells in the first and second lesions. Each data point corresponds to a single cell and is positioned along three axes according to its relative scores for the indicated cellular states. The size of the data point reflects the NES score of the cell. AC, astrocyte-like; CL, classic-like; MES, mesenchymal-like; NPC, neural progenitor–like; PN, proneural-like. H, Survival analysis of IDH wild-type GBMs (tumor purity >0.2) between NES-high and NES-low groups across the indicated datasets. CI, confidence interval.
Figure 2.
The NES characterizes tumor progression. A, Schematic diagram of the identification of the GBM NES. B, Bar plot demonstrates the percentage of tumor cells expressing the indicated genes between the first and second lesions across four multifocal GBMs. C, Functional enrichment analysis of the 12 NES genes. MSigDB, Molecular Signatures Database. D, Comparison of the percentage of NES-high tumor cells between the indicated groups. E, A bar plot demonstrates the distribution of NES-high tumor cells across the samples after treatment for 2, 5, and 7 weeks. OR, odds ratio. F and G, Hexagonal plots depict different cellular state or subtype signature scores for malignant cells in the first and second lesions. Each data point corresponds to a single cell and is positioned along three axes according to its relative scores for the indicated cellular states. The size of the data point reflects the NES score of the cell. AC, astrocyte-like; CL, classic-like; MES, mesenchymal-like; NPC, neural progenitor–like; PN, proneural-like. H, Survival analysis of IDH wild-type GBMs (tumor purity >0.2) between NES-high and NES-low groups across the indicated datasets. CI, confidence interval.
Figure 3. Microenvironment remodeling is associated with NES transition. A, Scatter plot of the Spearman correlation between NES score and regulatory activity across TCGA IDH wild-type GBMs. The x-axis and y-axis represent the correlation coefficient (rho) and log-transformed P value, respectively. TFs whose regulatory activity is positively and negatively correlated (adjusted P < 0.2) with NES score (red and blue, respectively). B, mRNA expression of indicated TFs across different stages of brain development from 4 weeks post-conception (wpc) to advanced age. C, Correlation between the NES and indicated pathways across TCGA IDH wild-type (WT) GBMs. Spearman correlation; **, P < 0.01; *, <0.05. D, Comparison of NES scores between tumor cells under hypoxic and normoxic conditions. Wilcoxon rank-sum test; **, P < 0.01; *, <0.05 (P values here also apply to E and F). E, Comparison of NES scores between tumor cells in the indicated groups. F, Comparison of the mRNA level of the indicated gene between tumor cells in the indicated groups. ns, not significant. G, Left, ChIP-seq analysis of HIF1A across various cancer types. The representative Integrative Genomics Viewer tracks at the FOSL2 locus show the distribution of peaks upstream of the transcription start site (<5 KB). Right, binding motif of HIF1A (from JASPAR).
Figure 3.
Microenvironment remodeling is associated with NES transition. A, Scatter plot of the Spearman correlation between NES score and regulatory activity across TCGA IDH wild-type GBMs. The x-axis and y-axis represent the correlation coefficient (rho) and log-transformed P value, respectively. TFs whose regulatory activity is positively and negatively correlated (adjusted P < 0.2) with NES score (red and blue, respectively). B, mRNA expression of indicated TFs across different stages of brain development from 4 weeks post-conception (wpc) to advanced age. C, Correlation between the NES and indicated pathways across TCGA IDH wild-type (WT) GBMs. Spearman correlation; **, P < 0.01; *, <0.05. D, Comparison of NES scores between tumor cells under hypoxic and normoxic conditions. Wilcoxon rank-sum test; **, P < 0.01; *, <0.05 (P values here also apply to E and F). E, Comparison of NES scores between tumor cells in the indicated groups. F, Comparison of the mRNA level of the indicated gene between tumor cells in the indicated groups. ns, not significant. G, Left, ChIP-seq analysis of HIF1A across various cancer types. The representative Integrative Genomics Viewer tracks at the FOSL2 locus show the distribution of peaks upstream of the transcription start site (<5 KB). Right, binding motif of HIF1A (from JASPAR).
Figure 4. Associations between NES and immune microenvironment. A, Correlation between NES score (x-axis) and signature scores (y-axis) of MGs (blue points) and BMDMs (red points) in TCGA IDH wild-type GBMs. The density plot on the right represents the distribution of MG and BMDM signature scores. B, Left, distribution of CD45 overlaid on the 2D t-distributed stochastic neighbor embedding (t-SNE) plot of the GBM sample derived from NJ03 (top) and NJ04 (bottom) patients. Distribution of combination of gene markers overlaid on the 2D t-SNE plot of GBM samples derived from NJ03 (top) and NJ04 (bottom) patients. Right, comparison of percentages of indicated cell types between two samples (NJ03 and NJ04). OR, odds ratio. C, Comparison of indicated signature scores between samples in contrast-enhancing and nonenhancing regions. Wilcoxon rank-sum test; **, P < 0.01. D, The distribution of indicated signatures (top: NES; middle: BMDM; bottom: MG) among different GBM regions. E, Image of in situ hybridization and tumor feature annotation (derived from IVY GAP, W3-1-1-B.1.05) for FOSL2 and CD163 expression among different regions (top: PC; bottom: CT). F, Interaction among different cell types. The width of links represents the number of significant ligand–receptor interactions between the indicated cell types. G, A heat map for ligand–receptor interactions between indicated cell types across the first and second lesions of NJ01. NS, not significant. H, Distribution of the indicated genes (ANXA1 and FPR3) overlaid on the 2D t-SNE plot of the first lesion of NJ01. The pie plot demonstrates the percentage of the indicated cells highly expressing ANXA1. I, Correlation between ANXA1 mRNA expression (x-axis) and MG (blue) and BMDM (red) signature scores across TCGA IDH wild-type GBMs.
Figure 4.
Associations between NES and immune microenvironment. A, Correlation between NES score (x-axis) and signature scores (y-axis) of MGs (blue points) and BMDMs (red points) in TCGA IDH wild-type GBMs. The density plot on the right represents the distribution of MG and BMDM signature scores. B, Left, distribution of CD45 overlaid on the 2D t-distributed stochastic neighbor embedding (t-SNE) plot of the GBM sample derived from NJ03 (top) and NJ04 (bottom) patients. Distribution of combination of gene markers overlaid on the 2D t-SNE plot of GBM samples derived from NJ03 (top) and NJ04 (bottom) patients. Right, comparison of percentages of indicated cell types between two samples (NJ03 and NJ04). OR, odds ratio. C, Comparison of indicated signature scores between samples in contrast-enhancing and nonenhancing regions. Wilcoxon rank-sum test; **, P < 0.01. D, The distribution of indicated signatures (top: NES; middle: BMDM; bottom: MG) among different GBM regions. E, Image of in situ hybridization and tumor feature annotation (derived from IVY GAP, W3-1-1-B.1.05) for FOSL2 and CD163 expression among different regions (top: PC; bottom: CT). F, Interaction among different cell types. The width of links represents the number of significant ligand–receptor interactions between the indicated cell types. G, A heat map for ligand–receptor interactions between indicated cell types across the first and second lesions of NJ01. NS, not significant. H, Distribution of the indicated genes (ANXA1 and FPR3) overlaid on the 2D t-SNE plot of the first lesion of NJ01. The pie plot demonstrates the percentage of the indicated cells highly expressing ANXA1. I, Correlation between ANXA1 mRNA expression (x-axis) and MG (blue) and BMDM (red) signature scores across TCGA IDH wild-type GBMs.
Figure 5. ANXA1 is associated with recruiting and polarizing macrophages to suppress CD8+ T cells. A, Top, ChIP-seq analysis of FOSL2 across three neural progenitor cells. The representative Integrative Genomics Viewer (IGV) tracks at the ANXA1 locus show the distribution of peaks upstream of the transcription start site (TSS; <5 KB). Middle, snATAC analysis of GBM cells. The representative IGV tracks at the ANXA1 locus show the location with significant peaks upstream of the TSS (<5 KB). Bottom, binding motif of FOSL2 (from JASPAR). B, Comparison of ANXA1 mRNA expression between TCGA IDH wild-type GBMs classified by the expression of FOSL2. Wilcoxon rank-sum test; **, P < 0.01; *, <0.05. C, Comparison of the migration ability of monocytes between the indicated groups (siANXA1 or siNC) based on transwell assay (microscope at ×100 magnification). D, mRNA level of indicated genes measured by qRT-PCR using the delta-delta Ct method. E, Comparison of IFNγ level (left) and proliferation percentage (right) of CD8+ T cells among indicated groups. F, A heat map for expression of indicated genes and signature scores among different regions. qRT-PCR (G) and immunoblot (H) analysis of Anxa1 mRNA expression in GL261 cells transduced with lentiviral vectors carrying five shRNAs. I, Representative MRI from mice after intracranial injection of GL261 with lentiviral vectors carrying scrambled shRNA or shAnxa1. T2 sequences demonstrate infiltrative tumors in the mouse brain (yellow line). J, Tumor volume was measured by the T2 MRI scan. K, Survival analysis of cases treated with shSC or shAnxa1.
Figure 5.
ANXA1 is associated with recruiting and polarizing macrophages to suppress CD8+ T cells. A, Top, ChIP-seq analysis of FOSL2 across three neural progenitor cells. The representative Integrative Genomics Viewer (IGV) tracks at the ANXA1 locus show the distribution of peaks upstream of the transcription start site (TSS; <5 KB). Middle, snATAC analysis of GBM cells. The representative IGV tracks at the ANXA1 locus show the location with significant peaks upstream of the TSS (<5 KB). Bottom, binding motif of FOSL2 (from JASPAR). B, Comparison of ANXA1 mRNA expression between TCGA IDH wild-type GBMs classified by the expression of FOSL2. Wilcoxon rank-sum test; **, P < 0.01; *, <0.05. C, Comparison of the migration ability of monocytes between the indicated groups (siANXA1 or siNC) based on transwell assay (microscope at ×100 magnification). D, mRNA level of indicated genes measured by qRT-PCR using the delta-delta Ct method. E, Comparison of IFNγ level (left) and proliferation percentage (right) of CD8+ T cells among indicated groups. F, A heat map for expression of indicated genes and signature scores among different regions. qRT-PCR (G) and immunoblot (H) analysis of Anxa1 mRNA expression in GL261 cells transduced with lentiviral vectors carrying five shRNAs. I, Representative MRI from mice after intracranial injection of GL261 with lentiviral vectors carrying scrambled shRNA or shAnxa1. T2 sequences demonstrate infiltrative tumors in the mouse brain (yellow line). J, Tumor volume was measured by the T2 MRI scan. K, Survival analysis of cases treated with shSC or shAnxa1.
Figure 6. BMDM infiltration is associated with tumor progression. A, Correlation analysis of surgical interval time and the difference in normalized BMDM signature score between primary and recurrent GBMs based on the GLASS dataset. B, Comparison of NES scores between tumor cells in monoculture and coculture with macrophages. C, Comparison of indicated MSigDB hallmark pathways between tumor cells in monoculture and coculture with macrophages for 24, 48, and 72 hours. D, Comparison of the FOSL2 mRNA level between tumor cells in monoculture and coculture with macrophages. E, Comparison of metastasis-related gene expression between tumor cells in monoculture and coculture with macrophages. Top bar colors from white to green represent the enrichment score of metastasis-related genes from low to high. F, Comparison of NES scores between glioma cells with high and low (control) migration ability. Enrich., enrichment. G, Correlation between the NES score and metastasis-like signature (sig.) score across TCGA IDH wild-type GBMs. H, Correlation between the mRNA level of the indicated gene and NES score across TCGA IDH wild-type GBMs. I, The ratio of the number of macrophages expressing CCL2 to that expressing CCL20. J, Distribution of the indicated genes (CCL2 and CCR10) overlaid on the 2D t-SNE plot of the first lesion. The pie plot demonstrates the percentage (percent.) of the macrophages (red) highly expressing CCL2. K, Comparison of the CCL2 mRNA level between TAMs and monocytes. Wilcoxon rank-sum test; **, P < 0.01. L, qRT-PCR analysis of CCL2 mRNA expression in macrophages with lentiviral vectors carrying shRNAs. M, Comparison of migration ability of tumor cells between the indicated groups (shCCL2 or shNC) based on transwell assay (microscope at a ×200 magnification).
Figure 6.
BMDM infiltration is associated with tumor progression. A, Correlation analysis of surgical interval time and the difference in normalized BMDM signature score between primary and recurrent GBMs based on the GLASS dataset. B, Comparison of NES scores between tumor cells in monoculture and coculture with macrophages. C, Comparison of indicated MSigDB hallmark pathways between tumor cells in monoculture and coculture with macrophages for 24, 48, and 72 hours. D, Comparison of the FOSL2 mRNA level between tumor cells in monoculture and coculture with macrophages. E, Comparison of metastasis-related gene expression between tumor cells in monoculture and coculture with macrophages. Top bar colors from white to green represent the enrichment score of metastasis-related genes from low to high. F, Comparison of NES scores between glioma cells with high and low (control) migration ability. Enrich., enrichment. G, Correlation between the NES score and metastasis-like signature (sig.) score across TCGA IDH wild-type GBMs. H, Correlation between the mRNA level of the indicated gene and NES score across TCGA IDH wild-type GBMs. I, The ratio of the number of macrophages expressing CCL2 to that expressing CCL20. J, Distribution of the indicated genes (CCL2 and CCR10) overlaid on the 2D t-SNE plot of the first lesion. The pie plot demonstrates the percentage (percent.) of the macrophages (red) highly expressing CCL2. K, Comparison of the CCL2 mRNA level between TAMs and monocytes. Wilcoxon rank-sum test; **, P < 0.01. L, qRT-PCR analysis of CCL2 mRNA expression in macrophages with lentiviral vectors carrying shRNAs. M, Comparison of migration ability of tumor cells between the indicated groups (shCCL2 or shNC) based on transwell assay (microscope at a ×200 magnification).
Figure 7. Schematic representation of tumor natural evolution and interaction with macrophages.
Figure 7.
Schematic representation of tumor natural evolution and interaction with macrophages.

References

    1. Gatenby RA, Brown JS. Integrating evolutionary dynamics into cancer therapy. Nat Rev Clin Oncol 2020;17:675–86. - PubMed
    1. Stupp R, Hegi ME, Mason WP, van den Bent MJ, Taphoorn MJB, Janzer RC, et al. . Effects of radiotherapy with concomitant and adjuvant temozolomide versus radiotherapy alone on survival in glioblastoma in a rando­mised phase III study: 5-year analysis of the EORTC-NCIC trial. Lancet Oncol 2009;10:459–66. - PubMed
    1. Jiang T, Nam DH, Ram Z, Poon WS, Wang J, Boldbaatar D, et al. . Clinical practice guidelines for the management of adult diffuse gliomas. Cancer Lett 2021;499:60–72. - PubMed
    1. Mallick S, Benson R, Hakim A, Rath GK. Management of glioblastoma after recurrence: a changing paradigm. J Egypt Natl Canc Inst 2016;28:199–210. - PubMed
    1. Darvin P, Toor SM, Sasidharan Nair V, Elkord E. Immune checkpoint inhibitors: recent progress and potential biomarkers. Exp Mol Med 2018;50:1–11. - PMC - PubMed

Publication types

Substances