. 2022 Sep 19;13(1):5483.
doi: 10.1038/s41467-022-33204-0.

Flexible cue anchoring strategies enable stable head direction coding in both sighted and blind animals

Affiliations

Flexible cue anchoring strategies enable stable head direction coding in both sighted and blind animals

Kadjita Asumbisa et al. Nat Commun. .

Abstract

Vision plays a crucial role in instructing the brain's spatial navigation systems. However, little is known about how vision loss affects the neuronal encoding of spatial information. Here, recording from head direction (HD) cells in the anterior dorsal nucleus of the thalamus in mice, we find stable and robust HD tuning in rd1 mice, a model of photoreceptor degeneration, that go blind by approximately one month of age. In contrast, placing sighted animals in darkness significantly impairs HD cell tuning. We find that blind mice use olfactory cues to maintain stable HD tuning and that prior visual experience leads to refined HD cell tuning in blind rd1 adult mice compared to congenitally blind animals. Finally, in the absence of both visual and olfactory cues, the HD attractor network remains intact but the preferred firing direction of HD cells drifts over time. These findings demonstrate flexibility in how the brain uses diverse sensory information to generate a stable directional representation of space.


Conflict of interest statement

The authors declare no competing interests.

Figures

Fig. 1
Fig. 1. Robust and stable head direction cells in ADn of blind mice.
a left, The open-field recording arena featuring a mouse with an electrode implant. a right, Example post hoc coronal brain slice showing tracts of the 4-shank recording electrode (left) with the anterior dorsal nucleus (ADn) indicated, and a corresponding slice from a brain atlas (right). b top, For 4 simultaneously recorded HD cells from an rd1 mouse, the animal’s position in the arena is plotted over a 10 min session (gray lines), and the spatial locations that evoked spiking responses are color-coded based on the animal’s head direction. b bottom, Polar plots indicating the preferred firing directions (PFDs) for the cells shown above. c top, Polar plot showing the occupancy of angular bins for head direction across 13 rd1 mice during 10 min recording sessions (see Methods). c bottom, Polar plot showing PFDs for HD cells recorded across 13 rd1 mice (see Methods). d left, Spike rate vs. head direction of four simultaneously recorded HD cells (C1–C4) in an rd1 mouse during the first/second half of a 10 min session. d right, For all cells/animals (n = 151 HD cells across 13 animals), the mean PFD is compared between the first/last 5 min. Pre-post tuning similarity was tested with a circular correlation. e The same as in d, except comparing HD cell tuning across successive 10 min exposures to the same arena (n = 55 HD cells across 7 animals). f Example decoding, comparing the actual head direction of an rd1 mouse over time (blue) to the head direction predicted by a Bayesian decoder (orange, see Methods). g Spike rate vs. head direction of 2 simultaneously recorded HD cells in an rd1 (left) and sighted (middle) mouse in control (solid black line) and following a 90° visual cue rotation (dotted line). g right, Schematic outlining the visual cue rotation experiment, and a histogram showing the extent of control (gain) that visual cue rotation exerted on the PFD of HD cells in rd1 vs. sighted mice (see Methods). Gain distributions for WTL (C1: Gain = 0.81; C2: Gain = 0.75) and rd1 (C1: Gain = 0.07; C2: Gain = 0.01) mice were compared to a shuffled distribution (see Methods). rd1 mice were not statistically different than shuffled data (P = 0.28; two-sided Mann–Whitney U Test). WTL were statistically different than shuffled data (P < 10−57; two-sided Mann–Whitney U Test). WTL = 93 HD cells across 6 animals; rd1 = 65 HD cells across 6 animals. h Comparison of several HD cell metrics in rd1 mice during light vs. dark exposure (n = 31 HD cells across 4 animals). Statistical differences calculated using the two-sided Wilcoxon Signed-Rank Test. n.s not statistically different. Source data are provided as a Source Data file.
Fig. 2
Fig. 2. HD cell tuning is more robust in blind animals than in sighted animals placed in the dark.
a For three different groups of mice—wild-type in light (WTL; blue), rd1 (blind; green), and wild-type in the dark (WTD; gray)—polar plots of four simultaneously recorded HD cells are shown. b For the three different groups of mice outlined in a, the average percent of cells recorded in ADn that passed the criterion to be designated as HD cells (see Methods) are compared. Statistical differences were calculated using a two-sample Z-test for Proportions: WTL vs rd1, P = 0.06; WTL vs WTD, P < 10−4; rd1 vs WTD, P = 0.004. c For the three different groups of mice outlined in a and b, several characteristics of HD cells are compared. For each graph, data are shown as hybrid violin/box plots (see Methods). Statistical differences were calculated using the two-sided Mann–Whitney U Test with Bonferroni correction for multiple comparisons: Vector length (WTL vs rd1, P < 10−2; WTL vs WTD, P < 10−7; rd1 vs WTD, P < 10−4); Tuning width (WTL vs rd1, P < 10−9; WTL vs WTD, P < 10−12; rd1 vs WTD, P < 10−11); MI (WTL vs rd1, P < 10−3; WTL vs WTD, P < 10−6; rd1 vs WTD, P = 0.002). The number of cells and animals in each group is outlined in panel b. Additional statistical comparisons are provided in Supplementary Fig. 2. Source data are provided as a Source Data file.
Fig. 3
Fig. 3. Prior visual experience leads to refinement of HD cell tuning in blind adult mice.
a For a Gnat1/2mut mouse (congenitally blind; pink), polar plots of four simultaneously recorded HD cells are shown. b For rd1 (replotted from Fig. 2) and Gnat1/2mut mice, the average percent of cells recorded in ADn that passed the criterion to be designated as HD cells (see Methods) are compared. Statistical differences calculated using the two-sample Z-test for Proportions. c Several characteristics of HD cells are compared between rd1 (replotted from Fig. 2) and Gnat1/2mut mice. For each graph, data are shown as hybrid violin/box plots (see Methods). Statistical differences were calculated using the two-sided Mann–Whitney U Test (Vector length, P < 10−5; Tuning width, P = 0.0005; MI, P = 0.014), and the number of cells and animals in each group is outlined in panel b. Additional statistical comparisons are provided in Supplementary Fig. 3. Source data are provided as a Source Data file.
Fig. 4
Fig. 4. Stable HD cell tuning in blind animals following whisker shaving.
a Example polar plots of two simultaneously recorded HD cells in an rd1 mouse before (left) and after (right) whisker ablation. b Several HD cell metrics are compared before and after whisker ablation, pooled for rd1 and Gnat1/2mut (independent analyses for these different mouse lines are shown in Supplementary Fig. 4). Statistical comparisons were computed using the two-sided Wilcoxon Signed-Rank Test: N = 89 HD cells across 11 animals (Mean rate, P = 0.07; Peak rate, P = 0.0001; Vector length, P = 0.14; MI, P = 0.68). Source data are provided as a Source Data file.
Fig. 5
Fig. 5. Olfactory signals are required for stable HD cell tuning in blind animals.
a left, Polar plots from four simultaneously recorded HD cells in an rd1 mouse before (solid gray line) and after (dotted black line) 180° floor rotation (see Methods). a right (top), Schematic of floor rotation experiment. a right (bottom), Observed shift in mean PFD plotted against expected shift in mean PFD (see Methods; pooled for rd1 and Gnat1/2mut (see also Supplementary Fig. 5a, b)). r-value computed with circular correlation (94 HD cells across 9 animals). b Example olfactory test, with an rd1 mouse placed in a two-room chamber, with one room containing an aversive odor (3-methyl-1-butanethiol) and the other containing a neutral odor (distilled H20). The mouse’s trajectory is plotted (gray line) over a 10 min session in control (left) and following olfactory sensory neuron (OSN) ablation (right). c Time spent in the neutral vs. aversive room in control and following olfactory ablation. Statistical test used was the two-sided Mann–Whitney U Test, P = 0.0006. Blind control = 8 animals; Olfaction ablated = 9 animals. d Polar plots for six simultaneously recorded HD cells in an rd1 mouse in control (top) and the following day after OSN ablation (bottom; see Methods). e Violin/box plots comparing the percent of cells in ADn passing standard criterion for being designated HD cells (see Methods) in control and following olfactory ablation. Statistical test used was the two-sided Mann–Whitney U Test, P < 10−12. Blind control = 21 animals; Olfaction ablated = 9 animals. f Example autocorrelograms for an HD cell (C1) in a blind animal in control (top) and following olfactory ablation (bottom). g Results from the XGB model, trained on autocorrelograms of sighted animals in the light (WTL) and used to classify cells in ADn of blind animals as either HD and non-HD cells (see Methods). h Violin/box plots comparing the percent of ADn cells classified as HD cells using the XGB classifier in control and following olfactory ablation (see Methods; Blind control = 21 animals; Olfaction ablated = 9 animals). Two-sided Mann–Whitney U Test, P = 0.57. i Violin/box plots comparing the vector length calculated from XGB-classified HD cells in blind control vs. olfaction ablated animals. Blind control = 254 HD cells across 21 animals; Olfaction ablated = 179 HD cells across 9 animals. Statistical tests performed using the two-sided Mann–Whitney U Test, P < 10−64. Source data are provided as a Source Data file.
Fig. 6
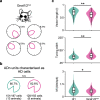
Fig. 6. Olfaction modulates HD cell tuning in sighted mice placed in the dark.
a top, Example polar plots from three simultaneously recorded HD cells in a sighted animal placed in the dark (WTD, left) and a blind rd1 mouse following olfactory sensory neuron ablation (right). a bottom, The vector length of tuning curves of HD cells belonging to blind animals following olfactory ablation is compared to that of sighted animals placed in the dark (36 HD cells from 6 animals for WTD; 166 HD cells from 9 animals for OSN ablated Blind). HD cells in both conditions were defined with an XGB model trained on blind control data. Statistical comparison was computed with the two-sided Mann–Whitney U Test, P < 10−17. b top, Violin/box plots are shown comparing the percent of recorded cells in ADn that passed the standard criterion for being designated as HD cells in WTL (n = 9 animals), WTD (n = 6 animals), and WTD: OSN ablated (n = 5 animals; see Methods). b bottom, Same as above except the percent of ADn units were defined as HD cells using the XGB classifier (see Methods). Statistical comparison was computed with the two-sided Mann–Whitney U Test with Bonferroni correction for multiple comparisons (*P < 0.05, **P < 0.01). c top, Example polar plots of three simultaneously recorded HD cells from a sighted animal following olfactory sensory neuron ablation, placed in either the light (left) or dark (right). c bottom, Vector length of tuning curves for HD cells from sighted animals placed in both light vs. dark environments following olfactory sensory neuron ablation (comparison of additional metrics is shown in Supplementary Fig. 6). N = 27 HD cells across 5 animals in both light and dark conditions. Statistical difference was calculated using the two-sided Wilcoxon Signed-Rank Test, P < 10−5. Source data are provided as a Source Data file.
Fig. 7
Fig. 7. In the absence of vision and olfaction, the HD attractor in ADn remains intact but the ‘hill’ of activity drifts over time.
a top, Isomap plots representing HD cell population activity over time, for a control blind rd1 mouse (left) and the same animal following olfactory sensory neuron ablation (right). The dots represent population activity at a given point in time, and when plotted over time form a 1-dimensional ring. Each dot is color-coded based on the animal’s actual head direction measured at that time point (additional plots for WT, rd1, and Gnat1/2mut mice are shown in Supplementary Fig. 7a–c). a bottom, For the corresponding Isomap plots above, Betti 1 barcode plots are shown for actual and shuffled (gray) data (see Methods). b For control (blue; n = 13 animals (WTL = 5, rd1 = 4, Gnat1/2mut = 4)), ‘No Vision No Olfaction’ (red; n = 9 animals (WTD = 2, rd1 = 4, Gnat1/2mut = 3)) and shuffled (gray) Isomap data, the average length (solid color, inner circle) and standard deviation (opaque color, outer circle) of the longest (most persistent) radius are shown. Statistical difference computed with the two-sided Mann–Whitney U Test with Bonferroni correction for multiple comparisons (**P < 0.01). c Example polar plots for two simultaneously recorded HD cells in an rd1 mouse following OSN ablation, either calculated over the entire 10 min recording session (left) or over shorter timescales (right) with each successive epoch computed upon successive 360° head turns. d The mean vector length computed from HD cell tuning curves is compared when measured for the entire 10 min recording sessions or for the 360° head turn epochs across mice following loss of vision and olfaction. n = 209 HD cells from 14 animals (WTD = 5, rd1 = 5, Gnat1/2mut = 4). Statistical comparison with the two-sided Wilcoxon Signed-Rank Test, P < 10−35. e Average velocity of drift in the HD population compared in sighted mice in the light (WTL), blind mice, and in mice without both vision and olfaction. WTL (n = 5 animals in 8 sessions); Blind (n = 8 animals in 13 sessions); No vision/olfaction (n = 9 animals in 12 sessions). Statistical comparison with the two-sided Mann–Whitney U Test with Bonferroni correction for multiple comparisons (**P < 0.01). f Comparison between an animal’s actual head direction vs. the head direction indicated by the population activity for blind mice before and after olfactory ablation. g Decoding error in control (n = 13 animals) and following loss of vision and olfaction (n = 9 animals). Statistical comparison with the two-sided Mann–Whitney U Test, P < 10−5. h Total angular distance covered for mice over the 10 min recording session compared to the total angular distanced covered on the Isomap manifold (n = 9 animals in 12 sessions). Statistical comparison with the two-sided Wilcoxon Signed-Rank Test, P = 0.0009. i Example blind mouse recording comparing angular head velocity (AHV) and angular drift velocity (ADV) following olfaction ablation. j Histogram showing the Pearson r and p-values computed for AHV versus ADV for all sessions where visual and olfactory inputs were blocked (as in panel i). Asterisk indicates sessions where P < 0.05 and |r values | > 99th percentile of shuffles (see Methods). k Scatterplot showing the relationship between actual and Isomap decoded AHV in Control (n = 13 animals) and No vision No olfaction (n = 9 animals). P = 0.025. Statistical comparison using the two-sided Mann–Whitney U Test. Source data are provided as a Source Data file.

References

    1. Tolman EC. Cognitive maps in rats and men. Psychol. Rev. 1948;55:189–208. doi: 10.1037/h0061626. - DOI - PubMed
    1. O’Keefe J. A review of the hippocampal place cells. Prog. Neurobiol. 1979;13:419–439. doi: 10.1016/0301-0082(79)90005-4. - DOI - PubMed
    1. Klatzky, R. L. Allocentric and Egocentric Spatial Representations: Definitions, Distinctions, and Interconnections. in Spatial Cognition: An Interdisciplinary Approach to Representing and Processing Spatial Knowledge (eds. Freksa, C., Habel, C. & Wender, K. F.) 1–17 (Springer, 1998).
    1. Schinazi VR, Thrash T, Chebat D-R. Spatial navigation by congenitally blind individuals. WIREs Cogn. Sci. 2016;7:37–58. doi: 10.1002/wcs.1375. - DOI - PMC - PubMed
    1. Thinus-Blanc C, Gaunet F. Representation of space in blind persons: vision as a spatial sense? Psychol. Bull. 1997;121:20–42. doi: 10.1037/0033-2909.121.1.20. - DOI - PubMed

Publication types

Grants and funding

LinkOut - more resources