. 2022 Oct;54(10):1527-1533.
doi: 10.1038/s41588-022-01177-x. Epub 2022 Sep 19.

The evolutionary dynamics of extrachromosomal DNA in human cancers

Affiliations

The evolutionary dynamics of extrachromosomal DNA in human cancers

Joshua T Lange et al. Nat Genet. 2022 Oct.

Abstract

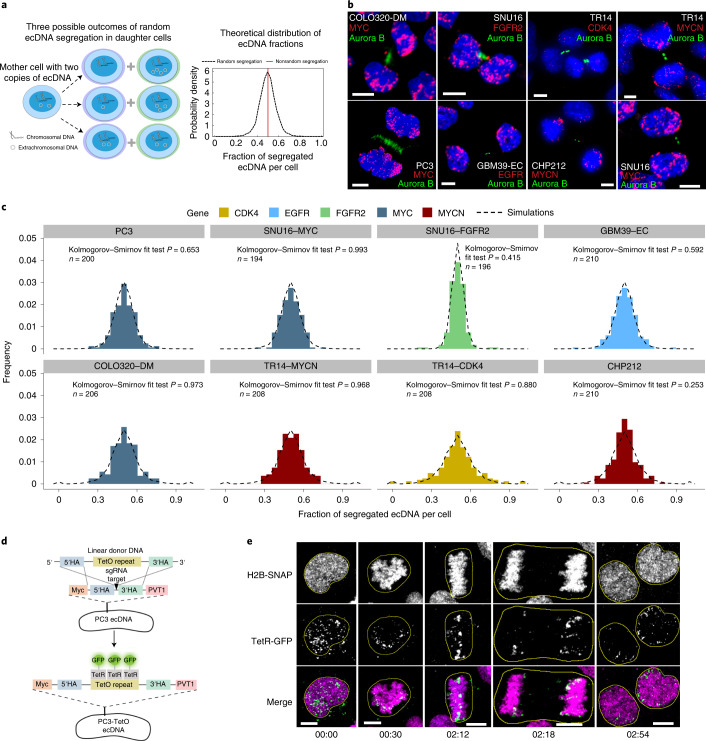
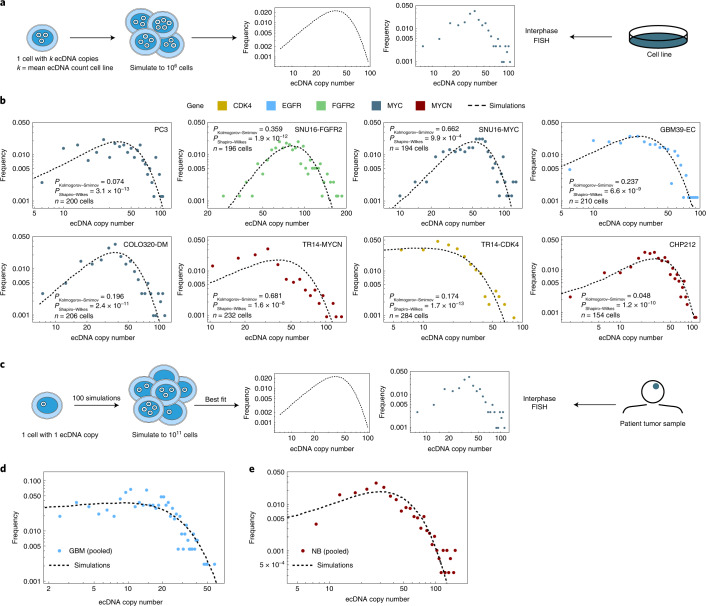
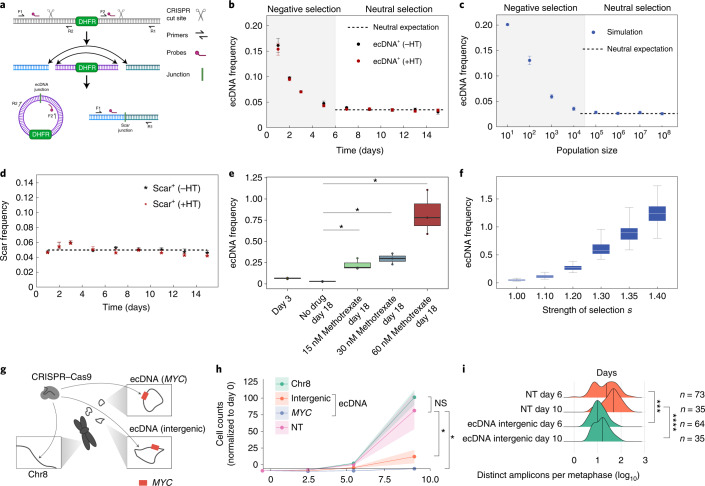
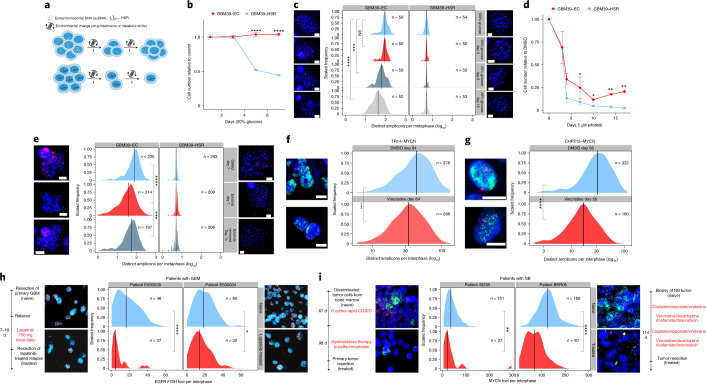
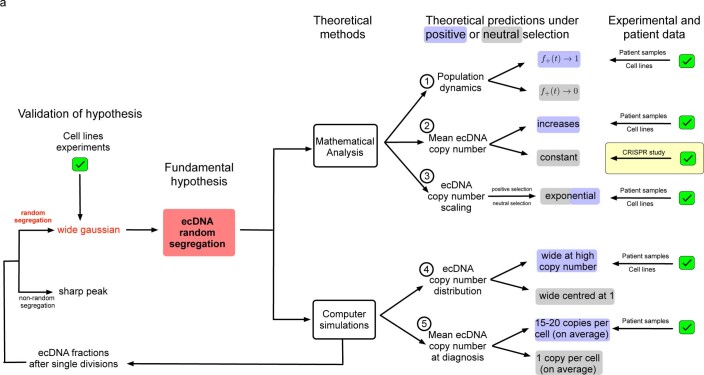
Oncogene amplification on extrachromosomal DNA (ecDNA) is a common event, driving aggressive tumor growth, drug resistance and shorter survival. Currently, the impact of nonchromosomal oncogene inheritance-random identity by descent-is poorly understood. Also unclear is the impact of ecDNA on somatic variation and selection. Here integrating theoretical models of random segregation, unbiased image analysis, CRISPR-based ecDNA tagging with live-cell imaging and CRISPR-C, we demonstrate that random ecDNA inheritance results in extensive intratumoral ecDNA copy number heterogeneity and rapid adaptation to metabolic stress and targeted treatment. Observed ecDNAs benefit host cell survival or growth and can change within a single cell cycle. ecDNA inheritance can predict, a priori, some of the aggressive features of ecDNA-containing cancers. These properties are facilitated by the ability of ecDNA to rapidly adapt genomes in a way that is not possible through chromosomal oncogene amplification. These results show how the nonchromosomal random inheritance pattern of ecDNA contributes to poor outcomes for patients with cancer.


Conflict of interest statement

P.S.M. is cofounder of Boundless Bio. He has equity and chairs the scientific advisory board, for which he is compensated. V.B. is a cofounder, consultant, scientific advisory board member and has an equity interest in Boundless Bio. and Abterra Biosciences. The terms of this arrangement have been reviewed and approved in accordance with its conflict-of-interest policies. H.Y.C. is a cofounder of Accent Therapeutics, Boundless Bio, Cartography Biosciences, Orbital Therapeutics, and advisor of 10X Genomics, Arsenal Biosciences and Spring Discovery. J.T.L. was employed by Boundless Bio after completing this work. C.S. acknowledges grant support from AstraZeneca, Boehringer-Ingelheim, Bristol Myers Squibb, Pfizer, Roche-Ventana, Invitae (previously ArcherDX, collaboration in minimal residual disease sequencing technologies) and Ono Pharmaceutical. He is an AstraZeneca advisory board member and chief investigator for the AZ MeRmaiD 1 and 2 clinical trials and is also chief investigator of the NHS-Galleri trial. He has consulted for Amgen, AstraZeneca, Pfizer, Novartis, GSK, MSD, Bristol Myers Squibb, Illumina, Genentech, Roche-Ventana, GRAIL, Medicxi, Metabomed, Bicycle Therapeutics, Roche Innovation Centre Shanghai and the Sarah Cannon Research Institute. C.S. had stock options in ApoGen Biotechnologies and GRAIL until June 2021, has currently stock options in Epic Bioscience and Bicycle Therapeutics, and has stock options and is a cofounder of Achilles Therapeutics. C.S. holds patents relating to assay technology to detect tumor recurrence (PCT/GB2017/053289), targeting neoantigens (PCT/EP2016/059401), identifying patent response to immune checkpoint blockade (PCT/EP2016/071471), determining human leukocyte antigen loss of heterozygosity (PCT/GB2018/052004), predicting survival rates of patients with cancer (PCT/GB2020/050221), identifying patients who respond to cancer treatment (PCT/GB2018/051912), a US patent relating to detecting tumor mutations (PCT/US2017/28013), methods for lung cancer detection (US20190106751A1) and both European and US patents related to identifying insertion/deletion mutation targets (PCT/GB2018/051892). The other authors declare no competing interests.

Figures

Fig. 1
Fig. 1. ecDNA is randomly segregated to daughter cells.
a, Schematic of ecDNA segregation and predicted distribution of ecDNA fractions. b, Representative images of ecDNA distribution to daughter cells, identified by Aurora B midbody staining, in multiple cancer cell lines in late mitosis. c, Frequency histograms of ecDNA fractions in cancer cell lines analyzed in b, showing agreement between simulated random segregations (dotted distributions) and observation (colored distributions) (Kolmogorov–Smirnov test P > 0.05). d, Schematic of the CRISPR-based genetic approach used for live-cell imaging of ecDNA in prostate cancer cells. HA, homology arms. e, Live-cell time-lapse imaging revealed unequal distribution of ecDNA between daughter cells. Time stamps, hh:mm. Scale bars, 5 μm. Source data
Fig. 2
Fig. 2. Random segregation of ecDNA promotes intratumoral heterogeneity of oncogenes in cancer cell lines and patient tumor samples.
a, Schematic showing the quantification of ecDNA copy number heterogeneity from simulations of random ecDNA segregation and ecDNA+ cell lines. b, ecDNA oncogene copy number measured by interphase FISH in cancer cell lines. Agreement between observed (colored histograms) and simulated (dashed histograms) revealed that oncogene copy number heterogeneity largely follows the predicted distribution. Unadjusted P values from Shapiro–Wilks and Kolmogorov–Smirnov tests are shown. c, Schematic showing the quantification of ecDNA copy number heterogeneity from simulations of random ecDNA segregation and ecDNA+ patient data. d, ecDNA copy number distribution in six patients with GBM (dots) e, and four patients with NB (dots) emerges from the same process of random ecDNA segregation (black dashed line). Source data
Fig. 3
Fig. 3. Strong selection for ecDNA in cancer.
a, Schematic depicting the CRISPR-C strategy used to generate a single ecDNA in HAP1 cells containing the DHFR gene. DHFR ecDNA and the chromosomal scar are detected by ddPCR across the new junction sites. b, Tracking mean ecDNA copy number in HAP1 cells by ddPCR after day 0 induction of ecDNA by CRISPR-C. Neutral selection for DHFR ecDNA observed by similarity between hypoxanthine and thymidine omission or inclusion. c, Simulation of mean ecDNA number mimicking the experimental conditions in b. Negative selection s = 0.5, neutral selection s = 1. d, Mean frequency of the chromosomal scar determined by ddPCR across the scar junction. e, Mean ecDNA copy number after ecDNA induction on day 0 ± methotrexate treatment begun on day 4. be, CRISPR-C data from 3 biological replicates; data are presented as mean ± s.e.m.; P values from two-sided t-tests. e,f, Box plots are shown with line at the median and box ranging from the 25th to the 75th percentile, with the whiskers extending to the most extreme value. f, Simulation of mean ecDNA copy number mimicking the experiment in e. Negative selection s = 0.5 for 4 d followed by varying levels of selection strength as indicated for 14 d. Box plots are shown with line at the median and box ranging from the 25th to the 75th percentile, with whiskers extending to the most extreme value. g, Depiction of CRISPR-based strategy to test selective advantage given to COLO320-DM cells by MYC ecDNA. The arrows indicate regions targeted by sgRNA. h, Genome editing of MYC encoded on ecDNA caused massive decrease in cell numbers that exceeded the impact of intergenic ecDNA editing, which is indicative of strong selection for oncogenes on ecDNA. Data shown as the mean ± s.d. with P values from two-sided t-tests; data from two independent replicates. NS, not significant; NT, nontransfected. i, Quantification of ecDNA numbers per metaphase at 6 and 10 d after CRISPR transfection. Data shown with the median marked with vertical lines, P values from Mann–Whitney U-tests. *P ≤ 0.05; **P ≤ 0.005; ***P ≤ 0.0005; ****P ≤ 0.00005.
Fig. 4
Fig. 4. Random ecDNA segregation promotes rapid adaptation and resistance to glucose withdrawal and targeted drug treatment.
a, Schematic depicting how the random segregation of ecDNA and ensuing heterogeneity can drive rapid adaptation and resistance. b, ecDNA-containing GBM cells were resistant to glucose withdrawal, whereas GBM cells in which the same oncogene had lodged onto chromosomal loci at near identical copy number (GBM39-HSRs) did not tolerate glucose withdrawal; data from three independent replicates; presented as the mean ± s.d. c, Adaptation of ecDNA-containing cells to glucose withdrawal was linked to a rapid shift in the distribution of amplicons per cell, unlike the highly sensitive HSR-containing cells, which did. not modulate amplicon copy number. The timeline of the experiment is depicted on the left. The red FISH signal was from the EGFR FISH probe. d, GBM cells with EGFRvIII amplified on ecDNA, after an initial response, rapidly became resistant to the EGFR tyrosine kinase inhibitor erlotinib, whereas GBM39-HSR cells remained highly sensitive. Data are presented as mean ± s.d.; data from 2 independent replicates (day 7 from 4 replicates). e, GBM cells with EGFRvIII amplified on ecDNA rapidly shifted the distribution of EGFRvIII amplicons per cell, measured at 7 d, which can also be rapidly reversed within 1 week by drug withdrawal. The timeline of the experiment is depicted on the left. The red signal is the EGFR FISH probe. f, The NB cell line TR14 shifted the copy number distribution of MYCN ecDNA when treated with 43 nM vincristine for 12 weeks. g, The NB cell line CHP212 shifted the copy number distribution of MYCN ecDNA when treated with 5.3 nM vincristine for 8 weeks. h, Comparison of the distribution of EGFR amplification per cell in two patients with GBM before therapy (naive) and after 7–10 d of lapatinib treatment. The red FISH signal is from the EGFR FISH probe. The green FISH signal is from the Chr. 7 control probe. i, Comparison of MYCN ecDNA copy numbers assessed by MYCN (green) FISH in two patients with NB before and after receiving chemotherapy including vincristine. The red signal is from the Chr. 2 control FISH probe. Scale bar, 5 μm; scale information was not available for clinical tissue images. P values were calculated using a Mann–Whitney U-test for comparisons of distributions and two-sided t-tests for comparisons of cell numbers. *P ≤ 0.05; **P ≤ 0.005; ***P ≤ 0.0005; ****P ≤ 0.0005.
Extended Data Fig. 1
Extended Data Fig. 1. Overview of strategies to develop and test rules of ecDNA behavior with mathematical modeling, computer simulations, cell line and patient data.
a, Overview of the strategies employed to develop and test experimental, patient and theoretical behavior of ecDNA.
Extended Data Fig. 2
Extended Data Fig. 2. ecDNA segregation in cancer cell lines across cancer type and amplified oncogene.
a, Representative metaphase FISH images for cell lines used to quantify segregation dynamics in Fig. 1 Scale bars 10μm. b, The same daughter cells analyzed in Fig. 1c were analyzed by quantifying the pixel intensity of FISH signal in each daughter cell, as a proxy for ecDNA number. Agreement between theoretical predictions (dashed lines) and observation (histograms) shown by KS tests. c, Quantile-quantile plots comparing the distribution of measured ecDNA segregation fraction and simulated random ecDNA segregation.
Extended Data Fig. 3
Extended Data Fig. 3. Live cell tracking of ecDNA through insertion of Tet-O array into the ecDNA of PC3 cells.
a, Representative images of PC3 parental and PC3-TetO cell lines showing extensive MYC amplification on both. PC3-TetO shows significant TetO FISH signal on multiple ecDNA bodies as well. b, PCR amplification of 96-mer TetO repeats. c, PCR amplification of 96-mer TetO repeats from DNA isolated from PC3-TetO cells confirming insertion. d, Sanger sequencing of PCR amplification product from PC3-TetO cells. Both left and right junctions were repaired by homologous recombination at the insertion site.
Extended Data Fig. 4
Extended Data Fig. 4. ecDNA copy number distribution in cell lines.
a, Quantile-quantile plots comparing ecDNA copy number distributions in cell line populations with simulated populations following random segregation of ecDNA.
Extended Data Fig. 5
Extended Data Fig. 5. ecDNA heterogeneity in patient tumours.
a, Histograms of ecDNA copy number assessed by interphase FISH on patient tumor tissue from neuroblastoma (NB) patients with MYCN amplification. b, Quantile-quantile plots for ecDNA copy number comparing measured ecDNA number from patient tissue FISH and simulated ecDNA number from simulated tumour growth.
Extended Data Fig. 6
Extended Data Fig. 6. ecDNA dynamically responds to therapeutics.
a, Schematic depicting the trends in ecDNA copy number frequency and copy number under neutral and positive selection. b, Simulations showing ecDNA prevalence in populations derived from a single ecDNA+ cell with ecDNA under positive or neutral selection. Positive selection s = 3; neutral s = 1. c, Quantification of ecDNA frequency in patient and cell line samples grouped by amplified oncogene compared to expected levels given varying levels of selection as indicated. d, Quantification of ecDNA numbers at Day 6 and Day 10 after CRISPR cutting of regions of the COLO320-DM genome, either on or off of ecDNA. Shows clear evidence for selection of ecDNA both by the severe drop in copy number when targeted and the inidcation that the copy number begins to return to initial levels. Note ecDNA_MYC at day 6 is severely limited in its growth and only 6 metaphases were able to be identified and imaged. P-values shown from 2 sided t-tests.
Extended Data Fig. 7
Extended Data Fig. 7. ecDNA dynamically responds to therapeutics.
a, Representative images of metaphase spread FISH from isogenic GBM39 cell line. b, Stochastic simulations of Shannon diversity under either either random ecDNA inheritance (GBM39-EC) or canonical chromosomal inheritance (GBM39-HSR). 100 stochastic simulations were run for each condition. Boxplots are shown with line at median and box ranging from 25th to 75th percentile, whiskers extendting to most extreme value. c, Flow cytometry analysis of EGFR protein expression in isogenic GBM39-EC and GBM39-HSR cell lines shows pattern of heterogeneity similar to that seen in copy number. X-CV quantifies the % coefficient of variation for the two samples. We used FSC-A/SSC-A to locate the major cell population, and FSC-H/FSC-W to gate the single cells. We used a negative control sample (secondary only) to adjust the voltage for the Alexa-Fluor488 channel. d, Representative images of TR14 cells treated with Abemaciclib or Palbociclib for 60 days. CDK4 FISH signal shown in green, CEN12 control FISH probe shown in red. e, Quantification of experiment described in d shows significant shift in CDK4 ecDNA copy number distribution under both drug conditions. f, Quantification of EGFR ecDNA in GBM39-EC cells after short-term treatment with erlotinib shows rapid change in ecDNA copy number distribution. Lines indicate medians. P values calculated using Mann-Whitney tests. * p ≤ 0.05; **** p ≤ 0.0001. Scale bars 10 µm.
Extended Data Fig. 8
Extended Data Fig. 8. ecDNA dynamics correlate with formation of resistance.
a, Treatment of long term palbociclib resistant populations of TR14 cells with palbociclib or abemaciclib, showing resistance to treatment. b, Treatment of long term abemaciclib resistant populations of TR14 cells with palbociclib or abemaciclib showing resistance to treatment. c, Validation of increased ecDNA copy number by qPCR for CDK4. (a-c) Data presented as mean +/− standard deviation from 3 technical replicates. d, Crystal violet staining of TR14 cells re-challenged with palbociclib or abemaciclib after development of resistance, or not (DMSO). e, Quantification of d showing resistance in populations treated with CDK4 inhibitors for 60 days. Data presented as mean +/− standard deviation from 3 technical replicates.

References

    1. Merlo LMF, Pepper JW, Reid BJ, Maley CC. Cancer as an evolutionary and ecological process. Nat. Rev. Cancer. 2006;6:924–935. doi: 10.1038/nrc2013. - DOI - PubMed
    1. Greaves M, Maley CC. Clonal evolution in cancer. Nature. 2012;481:306–313. doi: 10.1038/nature10762. - DOI - PMC - PubMed
    1. McGranahan N, Swanton C. Clonal heterogeneity and tumor evolution: past, present, and the future. Cell. 2017;168:613–628. doi: 10.1016/j.cell.2017.01.018. - DOI - PubMed
    1. McGranahan N, Swanton C. Biological and therapeutic impact of intratumor heterogeneity in cancer evolution. Cancer Cell. 2015;27:15–26. doi: 10.1016/j.ccell.2014.12.001. - DOI - PubMed
    1. Abbosh C, et al. Phylogenetic ctDNA analysis depicts early-stage lung cancer evolution. Nature. 2017;545:446–451. doi: 10.1038/nature22364. - DOI - PMC - PubMed

Publication types