. 2022 Oct;7(10):1568-1579.
doi: 10.1038/s41564-022-01219-4. Epub 2022 Sep 19.

A functional selection reveals previously undetected anti-phage defence systems in the E. coli pangenome

Affiliations

A functional selection reveals previously undetected anti-phage defence systems in the E. coli pangenome

Christopher N Vassallo et al. Nat Microbiol. 2022 Oct.

Erratum in

Abstract

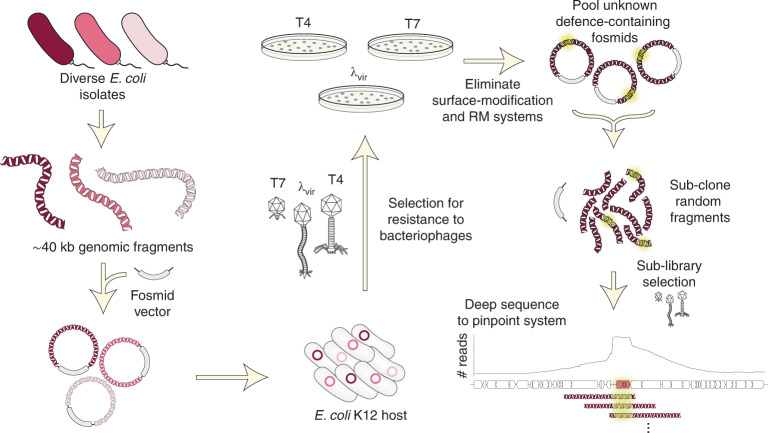
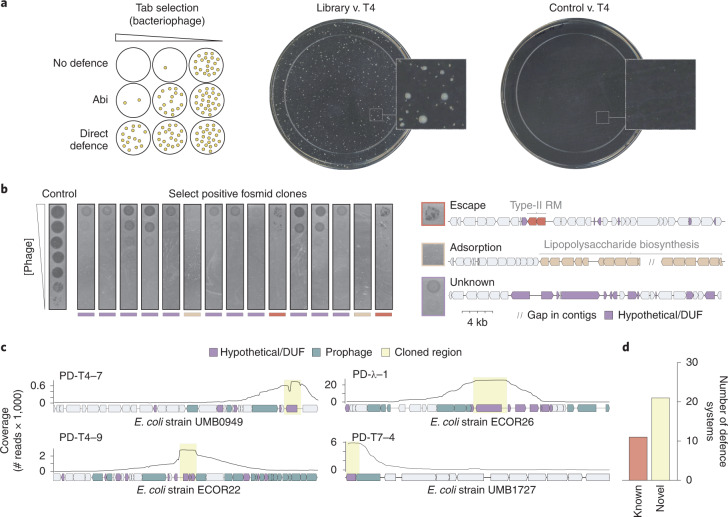
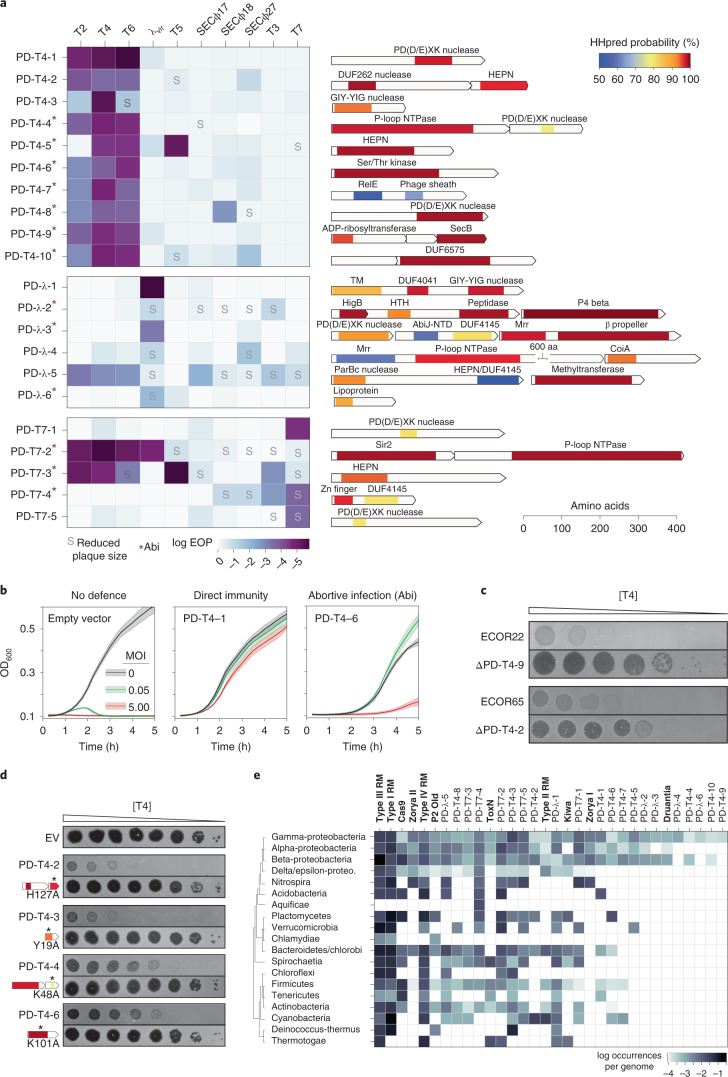
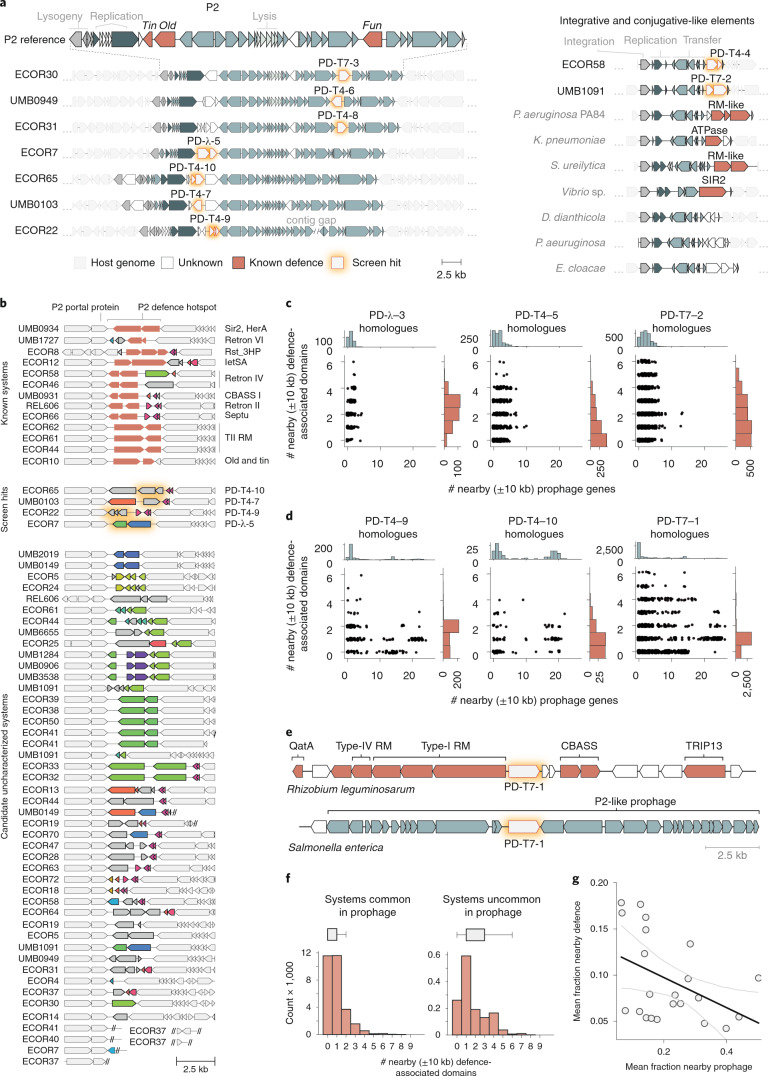
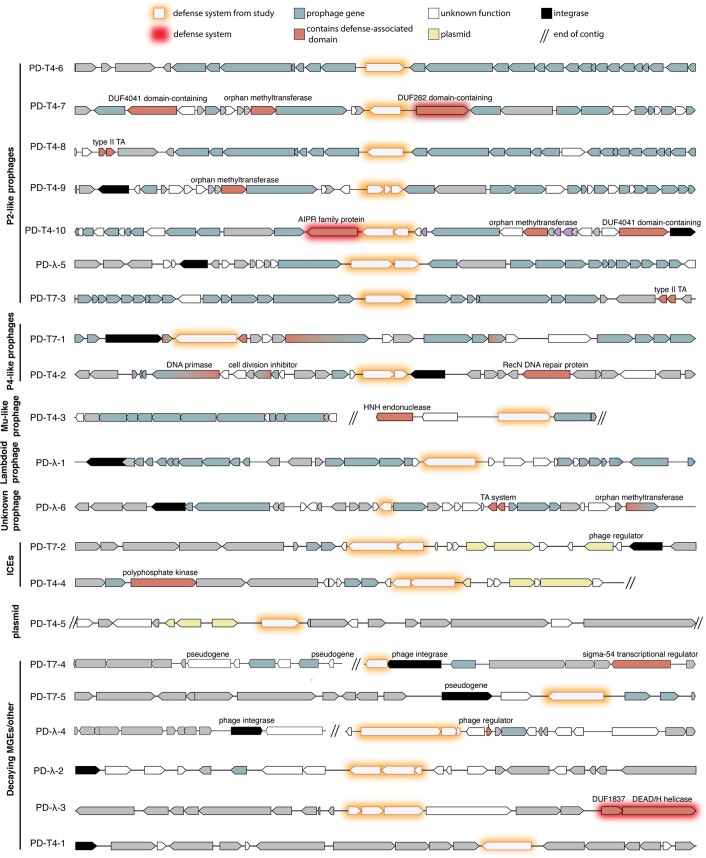
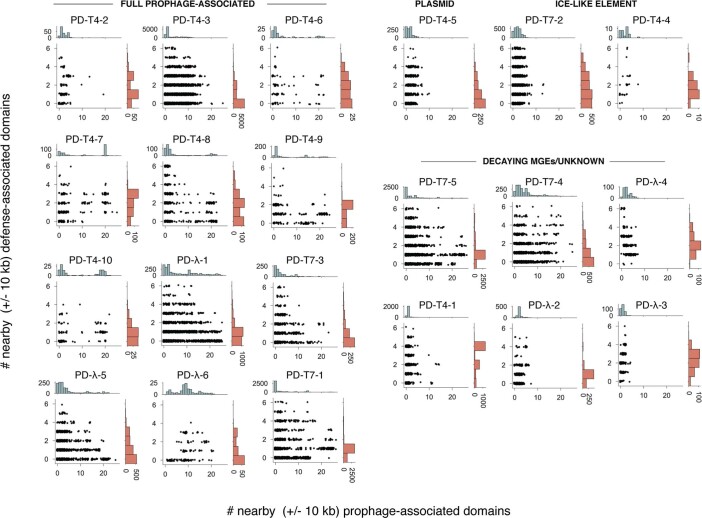
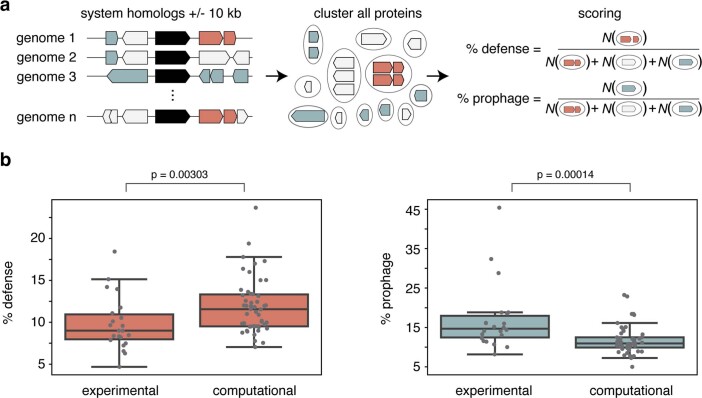
The ancient, ongoing coevolutionary battle between bacteria and their viruses, bacteriophages, has given rise to sophisticated immune systems including restriction-modification and CRISPR-Cas. Many additional anti-phage systems have been identified using computational approaches based on genomic co-location within defence islands, but these screens may not be exhaustive. Here we developed an experimental selection scheme agnostic to genomic context to identify defence systems in 71 diverse E. coli strains. Our results unveil 21 conserved defence systems, none of which were previously detected as enriched in defence islands. Additionally, our work indicates that intact prophages and mobile genetic elements are primary reservoirs and distributors of defence systems in E. coli, with defence systems typically carried in specific locations or hotspots. These hotspots encode dozens of additional uncharacterized defence system candidates. Our findings reveal an extended landscape of antiviral immunity in E. coli and provide an approach for mapping defence systems in other species.


Conflict of interest statement

The authors declare no competing interests.

Figures

Fig. 1
Fig. 1. Selection strategy for identifying phage defence systems.
A fosmid library of random ~40 kb fragments of genomic DNA from 71 E. coli strains was transformed into an E. coli K12 host and then challenged with three different phages. Survivors were isolated and fragments mapped to their genome sequence. After eliminating duplicates, clones affecting adsorption, and clones harbouring restriction-modification or known defence systems, the unique fosmids corresponding to each phage selection were used to construct plasmid libraries, which were subjected to a second selection. Surviving clones were deep-sequenced and candidate defence loci pinpointed by mapping sub-library reads to genome sequences of the original fosmid inserts.
Fig. 2
Fig. 2. Identification of phage defence systems.
a, Left: schematic of the ‘tab’ selection method. At intermediate concentrations of phage, tab selection facilitates the survival of cells with either abortive infection or direct defences. Right: examples of T4 selection plates for cells containing the fosmid library or an empty vector control. b, Left: tenfold dilutions of λvir phages on lawns of a sample of 15 positive clones from the λvir screen. Multiple phenotypes were observed, including reduction of plaquing with individual escape plaques indicative of a restriction-modification system; no lysis at any concentration of phage typically reflecting a loss of adsorption; or reduction of plaquing, generally indicative of a phage defence system. Right: examples of fosmid inserts corresponding to exemplar phenotypes in b (left), with relevant genes coloured. c, Examples of read coverage (100 bp moving average) from deep sequencing of sub-libraries generated from positive fosmid clones, with maxima delineating defence system candidates. Genes were coloured or shaded as indicated at the top. d, Summary counts of defence systems identified.
Fig. 3
Fig. 3. Summary and annotation of 21 previously uncharacterized defence system loci.
a, Left: each defence system was cloned into a low-copy plasmid with its native promoter and the EOP tested for a panel of ten phages. Darker colours indicate a higher level of protection. Systems leading to smaller plaque sizes are noted with an ‘S’, and systems that protect via an Abi mechanism are indicated with an asterisk. Right: for each defence system identified, the operon structure and predicted domain composition of each component are shown. Shaded regions correspond to domain predictions using HHpred, summarized by association to the PFAM clan, with short descriptions at the top. TM, transmembrane domain; HTH, helix-turn-helix. b, Bacterial growth in the presence of phage at MOIs of 0, 0.05 or 5. Robust growth at MOI 0.05 but not at MOI 5 indicates an Abi mechanism. Lines represent the mean of three technical replicates, with shaded regions indicating s.d. (see Extended Data Fig. 3 for extended MOI data). c, Plaquing of T4 on E. coli isolates ECOR22 and ECOR65 or the isogenic defence system deletions. Dilutions were done on two different plates and images combined for presentation. d, Plaquing of T4 on strains harbouring the indicated defence system or isogenic site-directed mutants of predicted domains. Asterisks indicate approximate location of mutations made. e, Instances of homologues of defence systems by bacterial class, sorted by number of instances, descending from left to right. Known systems are listed in bold for comparison to newly identified systems.
Fig. 4
Fig. 4. Prophages and MGEs are major sources of defence systems.
a, Hotspots of previously uncharacterized defence systems. Left: the native genome context of seven defence systems identified here, showing the boundaries of P2-like prophages in the genome from which they originated. Genes are colour-coded as indicated at the bottom. Right: two defence systems were identified in the accessory region of an ICE-like element within the indicated genome. Homologous elements from other bacterial genomes contain known and putative defence systems in the same location. b, All identified instances of P2 defence hotspot #1 in our 73-strain E. coli collection. White genes are flanking conserved P2 genes. Each colour of gene within the hotspot represents a protein cluster (30% identity). All grey genes belong to a lone cluster. Double slashes denote the end of a contig. c, Number of defence and prophage-associated genes ±10 kb from system homologues. The scatterplots indicate, for each homologous system, the numbers of prophage and defence-associated genes within ±10 kb. Examples in c represent systems that were found outside of prophages in our genome collection. For all 21 systems, see Extended Data Fig. 5. d, Same as c but for systems we found in prophages. e, Examples of the ±10 kb context for PD-T7-1 homologues in a defence island or prophage. f, Distribution of the number of nearby defence-domain-containing genes in homologues of systems commonly found in prophages (>10% homologue-containing regions with 8+ prophage genes in proximity) or not; n = 12 and 9 systems, respectively. Boxes indicate bounds of the distribution as median ± quartiles, and limits exclude outliers. g, Linear least squares regression for total nearby prophage gene and defence-domain-containing genes for each system. Pearson r = −0.442, P = 0.045; error indicates 95% CI.
Fig. 5
Fig. 5. Previously uncharacterized toxin-antitoxin-derived defence systems.
a, Schematics of PD-T4-9, PD-T4-10 and PD-λ-2 defence system operons and their domain predictions. Representative homologues of the systems are shown in their genomic contexts and indicate conservation and order of the system components. Blue, putative antitoxin; red, putative toxin; green, accessory factor. b,d,f,i, Each component or pair of components indicated was expressed (+) or not (−) from an inducible promoter and assayed for viable colony-forming units in tenfold serial dilutions. c,e, Plaquing assays for the phage indicated on cells harbouring an empty vector or a vector containing a given defence system with all components (WT) or lacking the component indicated. g,j, Plaquing of phages on TAC-containing strains expressing a second copy of the chaperone component to varying levels during infection. h, Schematic and T2 plaquing assay of the mqsRAC TAC system.
Extended Data Fig. 1
Extended Data Fig. 1. Diversity of the E. coli isolate pangenome used in this study.
(a) (Left) Phylogenetic tree of E. coli strain collection used to construct the genomic library screened. E. coli K-12 (MG1655) and B (REL606) are also included. (Right) Bars indicate presence/absence (red/white) of individual gene clusters (95% identity threshold). (b) Plot of the number of gene clusters versus the number of strains they are found in, for example ~8,000 clusters are each found in only one genome. These sparsely conserved clusters represent the accessory genome, whereas ~3,000 clusters are found in all 73 genomes and represent the E. coli core genome.
Extended Data Fig. 2
Extended Data Fig. 2. Adsorption of bacteriophage on various strains.
(a) Mean adsorption of T4 on control (EV) and LPS-containing fosmid strains (T4F17). Error bars represent standard deviation of three biological replicates. (b) Adsorption of T4, λvir, or T7 on strains expressing defense systems against their respective phages.
Extended Data Fig. 3
Extended Data Fig. 3. Mechanisms of defense and defense system function in other strains.
(a) Growth of control (EV) or defense system-expressing strains with phage MOIs of 0, 0.05 or 5. Phages used in each experiment are shown on the right. Asterisks indicate systems not showing direct immunity and likely representing abortive infection mechanisms. Lines represent the mean of three technical replicates with shaded regions indicating standard deviation. (b) EOP measurements for T4 and λvir on E. coli strains MG1655, ECOR13, or C expressing various defense systems indicated.
Extended Data Fig. 4
Extended Data Fig. 4. Native genomic neighborhoods of newly identified defense systems.
Genome maps of native locations of the defense systems, showing the flanking 10 kb regions, unless interrupted by the end of a contig. Prophage and defense-domain containing genes were called as described in the Methods.
Extended Data Fig. 5
Extended Data Fig. 5. Genome context of defense system homologs.
Data as in Fig. 4c, extended to all systems discovered here and sorted by the MGE context in which they were found.
Extended Data Fig. 6
Extended Data Fig. 6. Comparison of defense and prophage enrichments between experimentally and computationally discovered systems.
(a) Overview of method. Genes + /- 10 kb of homologs of defense systems were predicted as defense- or prophage-associated. To minimize the effects of sequence/genome redundancy, proteins were clustered to 95% identity. % scores were calculated as the number of prophage or defense-associated clusters over total clusters. (b) Boxplots of % prophage- and defense-associated genes near the experimentally discovered systems (this study) or computationally predicted and validated systems,. p values indicate significance from two-sided Mann-Whitney U test. Boxes indicate bounds of the distribution as median + /- quartiles, and limits exclude outliers.

References

    1. Mushegian, A. R. Are there 1031 virus particles on Earth, or more, or fewer? J. Bacteriol.10.1128/JB.00052-20 (2020). - PMC - PubMed
    1. Suttle CA. The significance of viruses to mortality in aquatic microbial communities. Microb. Ecol. 1994;28:237–243. doi: 10.1007/BF00166813. - DOI - PubMed
    1. Rostøl, J. T. & Marraffini, L. Ph)ighting phages: how bacteria resist their parasites. Cell Host Microbe25, 184–194 (2019). - PMC - PubMed
    1. Cohen D, et al. Cyclic GMP–AMP signalling protects bacteria against viral infection. Nature. 2019;574:691–695. doi: 10.1038/s41586-019-1605-5. - DOI - PubMed
    1. Burroughs, A. M. & Aravind, L. Identification of uncharacterized components of prokaryotic immune systems and their diverse eukaryotic reformulations. J. Bacteriol.10.1128/JB.00365-20 (2020). - PMC - PubMed

Publication types