. 2022 Sep 19;5(1):953.
doi: 10.1038/s42003-022-03874-z.

Asymmetric chromatin retention and nuclear envelopes separate chromosomes in fused cells in vivo

Affiliations

Asymmetric chromatin retention and nuclear envelopes separate chromosomes in fused cells in vivo

Bharath Sunchu et al. Commun Biol. .

Abstract

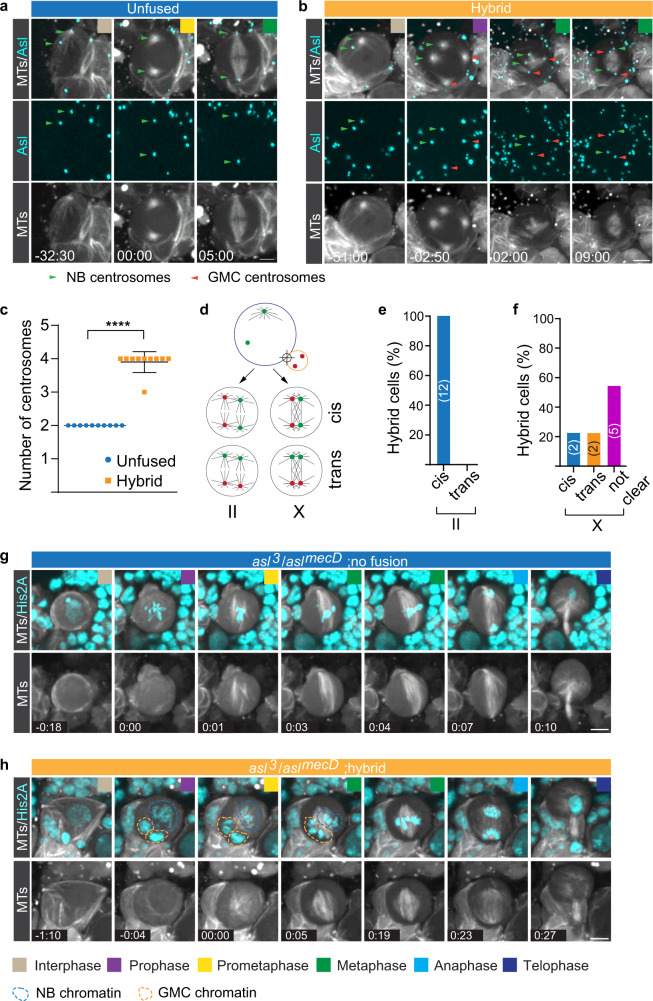
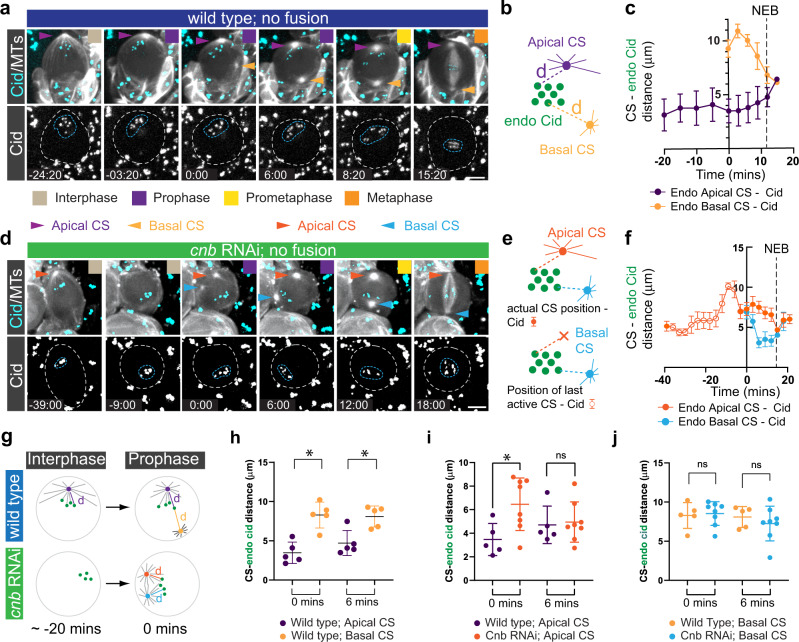
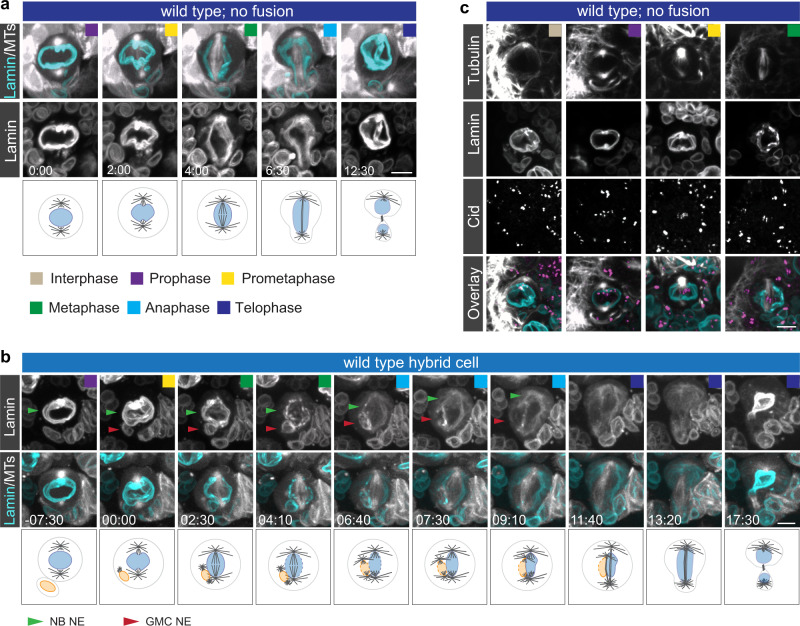
Hybrid cells derived through fertilization or somatic cell fusion recognize and separate chromosomes of different origins. The underlying mechanisms are unknown but could prevent aneuploidy and tumor formation. Here, we acutely induce fusion between Drosophila neural stem cells (neuroblasts; NBs) and differentiating ganglion mother cells (GMCs) in vivo to define how epigenetically distinct chromatin is recognized and segregated. We find that NB-GMC hybrid cells align both endogenous (neuroblast-origin) and ectopic (GMC-origin) chromosomes at the metaphase plate through centrosome derived dual-spindles. Physical separation of endogenous and ectopic chromatin is achieved through asymmetric, microtubule-dependent chromatin retention in interphase and physical boundaries imposed by nuclear envelopes. The chromatin separation mechanisms described here could apply to the first zygotic division in insects, arthropods, and vertebrates or potentially inform biased chromatid segregation in stem cells.


Conflict of interest statement

The authors declare no competing interests.

Figures

Fig. 1
Fig. 1. NB-GMC hybrid cells can independently align NB and GMC chromatin at the metaphase plate.
a Potential outcomes of NB-GMC fusions: NB–GMC derived hybrid cells could (1) only align neuroblast chromosomes, (2) congress a mix of endogenous and ectopic chromosomes or (3) separately align NB and GMC chromosomes at the metaphase plate. b Representative image sequence of a dividing third instar larval NB-GMC hybrid cell obtained from an interphase fusion, expressing the histone marker His2A::GFP (dashed blue circle; endogenous chromatin, dashed orange circle; ectopic chromatin). c Alignment of endogenous and ectopic chromatin in hybrid cells derived from interphase (inter), prophase (pro), prometaphase (prometa) or metaphase (meta) fusions were quantified with angle measurements in metaphase. d Chromosome alignment time for NB (endogenous; blue circles) and GMC-derived (ectopic) chromosomes (orange squares) compared to unfused control neuroblasts (grey triangles). e The time difference (Ta; time of alignment) between NB/endogenous (blue line) and GMC/ectopic (yellow ball) chromatin was measured and plotted. f Metaphase to anaphase onset was measured for NB/endogenous (blue lines) and GMC/ectopic (orange lines) chromatin, using chromatid separation as a reference. g Time difference between NB and GMC chromatin anaphase onset in NB-GMC hybrid cells. h Representative images of wild type hybrid cells expressing Mad2::GFP (cyan, top row; white, bottom row) and the spindle marker cherry::Jupiter (white top row). Orange, blue and yellow arrowheads refer to GMC-derived, NB-derived and merged Mad2, respectively. AO; Anaphase onset. Colored boxes represent corresponding cell cycle stages. One-way ANOVA was used for c, d, f. Error bars correspond to standard deviation (SD). *p < 0.05, **p < 0.01, ***p < 0.001, ****p < 0.0001. For this and subsequent figures, exact p values and complete statistical information can be found in Supplementary Data 1. Time in min:sec. Scale bar is 5 μm.
Fig. 2
Fig. 2. Dual spindles align endogenous and ectopic spindles separately at the metaphase plate.
a Hypothetical outcomes of spindle organization after NB-GMC fusions: hybrid cells could align neuroblast and GMC chromosomes either through a single or dual-spindle mechanism. b Representative third instar larval NB-GMC hybrid cell, expressing the histone marker His2A::GFP (white in top row; cyan in merged channel below) and the MT marker cherry::Jupiter (white in middle and bottom row). 00:00 refers to the start of nuclear envelope breakdown (NEB). NB- and GMC-derived chromatin is outlined with a blue and orange dashed line, respectively. c Quantification of hybrid cells containing dual- or multiple spindles for hybrid cells derived from interphase (inter), prophase (pro), prometaphase (prometa) or metaphase (meta) fusions. d Hybrid cells either form clearly distinct parallel (II) or interconnected (X) spindles, quantified in e. f Time difference between NEB and fusion induction for parallel and interconnected spindles. g For hybrid cells with parallel spindles, the time difference between endogenous and ectopic spindle formation was measured and plotted in h. i For hybrid cells with parallel spindles, spindle angle and inter-spindle distances were measured during mitosis. A representative example is shown in j. Quantification of inter-spindle k distances and l angles at prometaphase and metaphase. Colored boxes represent corresponding cell cycle stages. Error bars correspond to SDs. Unpaired t-test was used in Fig. 2f, n. Two-sided paired t-test was used in Fig. 2k, l. *p < 0.05, **p < 0.01, ****p < 0.0001. Time in min:sec. Scale bar is 5 μm.
Fig. 3
Fig. 3. asl mutant hybrid cells contain unfocused spindles.
a Representative third instar larval control NB and b NB-GMC hybrid cell, expressing the centriole marker Asl::GFP (cyan) and the spindle marker cherry::Jupiter (MTOCs; white in top and bottom row). Neuroblast-derived and GMC-derived MTOCs were highlighted with green and red arrowheads, respectively. c Comparison of centrosome number between unfused wild type and hybrid cells. d The two NB-derived centrosomes (green) can either form a bipolar spindle (cis), or pair with ectopic, GMC-derived (red) centrosomes to form a bipolar spindle (trans). e, f Quantification of cis and trans spindles in wild type hybrid cells. g Unfused asl mutant neuroblasts and h asl mutant hybrid cells, expressing the chromatin marker His2A::GFP (cyan) together with the spindle marker cherry::Jupiter (white). Colored boxes represent corresponding cell cycle stages. Error bars correspond to SDs. Unpaired t-test was used in Fig. 3c. ****p < 0.0001. Time in mins:secs. Scale bar is 5 mm.
Fig. 4
Fig. 4. Biased MTOC activity retains Cid in the apical neuroblast hemisphere during interphase and early mitosis.
a Representative third instar larval neuroblast expressing the centromere specific Histone-3 variant marker, EGFP::Cid (cyan; top, white; bottom) and the microtubule marker cherry::Jupiter (white; top). Colored boxes represent corresponding cell cycle stages. b The distance (purple and yellow dashed lines) between the apical (purple) and basal (yellow) centrosome (CS), and individual Cid clusters (green circles) were measured throughout the cell cycle and plotted in c. d Representative third instar larval neuroblast expressing cnb RNAi, cherry::Jupiter (white; top) and EGFP::Cid (cyan; top, white; bottom row). Orange arrowheads highlight the apical MTOC. Blue arrowheads highlight the maturing basal MTOC. Note that cnb mutant neuroblasts lose the active MTOC in interphase (-9:00). The blue and white dashed circle highlights Cid clusters and the cell outline, respectively. ‘Apical’ centrosome refers to the centrosome destined to be positioned on the apical cortex, whereas ‘basal’ centrosome will be inherited by the basal GMC. e CS – Cid distance measurements were performed in cnb RNAi expressing NBs. Once the apical CS disappeared in interphase, the last detectable position was used as a reference point (orange cross in the schematic below; open circles in the graph). f CS – Cid measurements for cnb RNAi expressing NBs. Closed arrows refer to actual CS – Cid measurements. Open circles denote Cid – previous active CS measurements. g Wild type neuroblasts maintain apical CS – Cid attachments in prophase, due to asymmetric MTOC activity and microtubule-dependent interphase centrosome – Cid attachments. cnb RNAi expressing neuroblasts lose MTOC activity in interphase, randomizing the position of Cid clusters. When centrosomes mature again in prophase, both centrosomes simultaneously attach to Cid clusters. h Centrosome – Cid distance of an unperturbed wild type neuroblast at the time of basal centrosome maturation (0 min) and 6 min thereafter. i, j Cid – centrosome distance measurements, comparing wild type with cnb RNAi expressing neuroblasts. Error bars correspond to SDs. Two-sided paired or unpaired t-test was used in Fig. 4h, i, j. ns; no significance. *p < 0.05. Time in mins:secs. Scale bar is 5 μm.
Fig. 5
Fig. 5. Asymmetric microtubule dependent centrosome-chromatin attachments contribute to the separation of endogenous and ectopic chromosomes in hybrid cells.
Representative third instar larval (a) wild type or (b) cnb RNAi hybrid cell, expressing EGFP::Cid (top row; cyan, bottom row; white) and the microtubule marker cherry::Jupiter (white; top row). Neuroblast-derived and GMC-derived Cid clusters are outlined with a blue and orange dashed line, respectively. Indistinguishable GMC and NB Cid clusters are highlighted with yellow dashed circles. Centrosome and Cid tracks are shown below the snapshots. Scatter plot showing the distance of endogenous Cid in relation to GMC- and NB-derived centrosomes (CS) for c wild type (blue square) and e cnb RNAi expressing hybrid cells (green square). Scatter plot showing the distance of ectopic Cid in relation to GMC- and NB-derived centrosomes (CS) for d wild type (blue square) and f cnb RNAi expressing hybrid cells (green square). g The distance of endogenous-to-ectopic Cid, or endogenous-to-endogenous Cid was measured and Delta T – the time difference between NEB and when Ecto-Endo Cid distance is the same as Endo-Endo Cid distance (T) - plotted for h wild type, cnb RNAi and cnb PACT. i Percentage of II vs X spindles in cnb RNAi and cnb PACT. j Scatter plot showing the time between fusion induction and NEB for cnb RNAi or cnb PACT hybrid cells containing ‘II’ and ‘X’ spindles. Error bars correspond to SDs. h, j Two-sided unpaired t-test. ns; no significance. *p < 0.05, **p < 0.01, ***p < 0.001, ****p < 0.0001. Time in mins:secs. Scale bar is 10 μm.
Fig. 6
Fig. 6. Nuclear envelopes contribute to the separation of endogenous and ectopic chromatin in NB – GMC hybrid cells.
a Unfused wild type neuroblasts or b hybrid cell expressing the nuclear envelope marker Lamin::GFP (cyan on top; white in the bottom row) and the spindle marker cherry::Jupiter (white on top). Schematics are shown below the image sequence. Green arrow; nuclear envelope (NE) of the neuroblast (NB). Red arrow; nuclear envelope (NE) of the ganglion mother cell (GMC). c Wild type neuroblasts expressing Lamin::GFP (cyan in merge) and stained for anti-Tubulin (white in merge) and anti-Cid (magenta in merge). Time in mins:secs. Scale bar is 5 μm.
Fig. 7
Fig. 7. Ectopic chromosomes in hybrid cells segregate erroneously.
a Representative examples of delayed (top row) and simultaneous (bottom row) segregation of endogenous (blue dashed circle) and ectopic (orange dashed circle) chromosomes in wild type hybrid cells expressing the chromatin marker His2A::GFP. b Bar graph showing percentage of NB-GMC hybrid cells with lagging chromosomes, chromosomal bridges, or both. c Representative third instar larval NB-GMC hybrids expressing histone marker His2A::GFP showing missegregating chromatids (yellow arrowheads) during anaphase, resulting in micronuclei (top row), heterokaryon (middle row) or synkaryon (bottom row) formation. Time stamps are in relation to NEB (=0:00). d Bar graph quantifying the percentage of fused cells with micronuclei, heterokaryons or synkaryons. e Summary and model. Time in mins:secs. Scale bar is 5 μm.

References

    1. McIntosh, J. R. Mitosis. Csh Perspect. Biol.8, a023218 (2016). - PMC - PubMed
    1. Maiato H, Gomes AM, Sousa F, Barisic M. Mechanisms of chromosome congression during mitosis. Biology. 2017;6:13. doi: 10.3390/biology6010013. - DOI - PMC - PubMed
    1. Thomas GE, Renjith MR, Manna TK. Kinetochore–microtubule interactions in chromosome segregation: lessons from yeast and mammalian cells. Biochem J. 2017;474:3559–3577. doi: 10.1042/BCJ20170518. - DOI - PubMed
    1. Yu K, Zhong N, Xiao Y, She Z. Mechanisms of kinesin‐7 CENP‐E in kinetochore–microtubule capture and chromosome alignment during cell division. Biol. Cell. 2019;111:143–160. doi: 10.1111/boc.201800082. - DOI - PubMed
    1. Snook RR, Hosken DJ, Karr TL. The biology and evolution of polyspermy: insights from cellular and functional studies of sperm and centrosomal behavior in the fertilized egg. Reproduction. 2011;142:779–792. doi: 10.1530/REP-11-0255. - DOI - PubMed

Publication types

LinkOut - more resources