. 2022 Sep 16;3(3):101533.
doi: 10.1016/j.xpro.2022.101533.

Robust neuronal differentiation of human embryonic stem cells for neurotoxicology

Affiliations

Robust neuronal differentiation of human embryonic stem cells for neurotoxicology

Athina Samara et al. STAR Protoc. .

Abstract

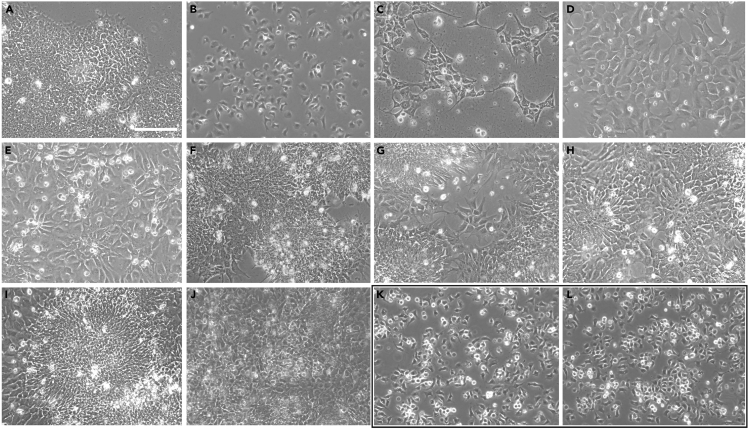
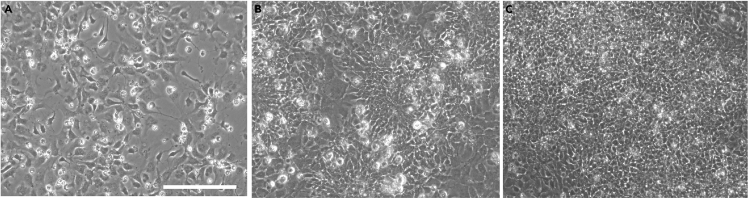
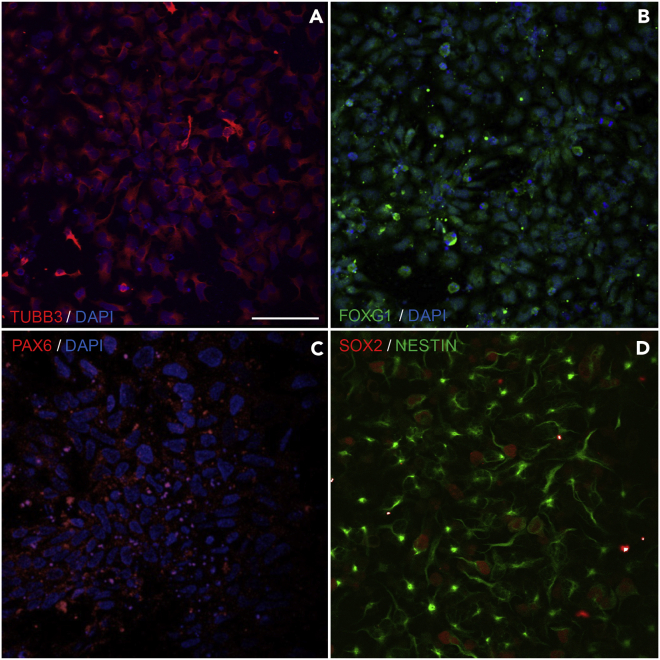
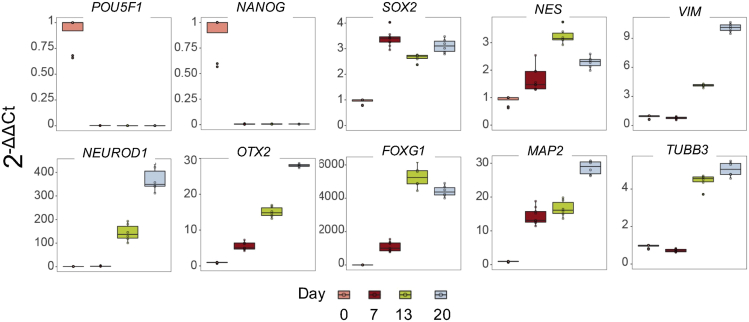
Here, we describe a protocol for rapid neuronal differentiation from human embryonic stem cells (hESCs) toward a heterogenous population of telencephalic progenitors, immature and mature neurons, for drug-screening and early-brain differentiation studies. hESC neuronal differentiation depends on adhesion and minimal cell-passaging to avert monolayer cross-connectivity rupture. In this protocol, we detail optimized cell-seeding densities and coating conditions with high cell viability suitable for neurotoxicology and high-resolution single-cell omics studies. Daily media changes reduce compound instability and degradation for optimal screening. For complete details on the use and execution of this protocol, please refer to Samara et al. (2022).

Keywords: Cell Differentiation; Cell culture; Developmental biology; Gene Expression; Neuroscience; Stem Cells.


Conflict of interest statement

Declaration of interests The authors declare no competing interests.

Figures

None
Graphical abstract
Figure 1
Figure 1
A series of representative brightfield images demonstrating the characteristic formation of rosettes during stage I neural induction (A) The protocol starts with the addition of Accutase to the hESC cells in culture (A), and cell counts and seeding for Stage I initiation. (A) Characteristic morphology of the hESCs with the small cytoplasm growing in E8 medium showing no signs of spontaneous differentiation. (B) Day 0, showing the cells 1 h after plating. (C) Representative image of the culture at Day 1, demonstrating the grid-like formation typical after ROCKi supplementation at Day 1. (D and E) Proliferation and confluency are enhanced at Day 2 and already at Day 3 the initiation of the columnar arrangement of rosettes can be observed (E). (F–H) The formation and maturation of rosettes and their compaction to neural tube-like structures is the characteristic feature of this part of the protocol. Although some less populated areas may be observed, (as shown at the Day 5 image, (G), other than few areas at the borders of the culture wells, the cells are highly confluent without viability issues (as assessed by the cell counts). (I) Rosettes at this stage may be looser (H) or reach high compaction (I). (J) At day 7 the cells are collected to be transitioned to Stage II. Images were taken with an EVOS FL microscope at 20× magnification and scale bar corresponds to 100 μm. Pause point. (K and L) Cells can be collected and frozen at this point (Day 7). The black-framed panel shows the cells 1 h after passaging (K), if the protocol continues uninterrupted or if cells are frozen and reseeded at a later stage (L). Images were taken with an EVOS FL microscope at 20× magnification and scale bar corresponds to 100 μm.
Figure 2
Figure 2
Representative phase contrast images at day 8, day 11 and day 13, showing how the neural stem cells and neuronal precursors (NSCs/NPCs) organize in the self-patterning stage (A) Image taken at day 8, the day after plating cells for Stage II. (B) The expanded cells, by day 11 have the morphology of neural progenitors. (C) By day 13 the culture forms as a heterogeneous cell population composed of precursors and immature neurons. All images were taken before routine media changes. As described, daily culture medium replacement is not accompanied with washing steps, thus by day 13, dead cells and debris may be accumulating. Images were taken with an EVOS FL microscope at 20× magnification and scale bar corresponds to 100 μm.
Figure 3
Figure 3
Representative brightfield images at day 14, day 17, and day 20, showing how the culture organizes in the maturation stage of the protocol (A) Image taken at day 14, the first day after plating cells for Stage III. (B) The cells have, by day 17 acquired the morphology of expanded NSCs/NPCs. (C) By day 20 the culture forms a tightly packed and dense small-cell-body population highly reminiscent of a network of NSCs/NPCs and neurons. Images were routinely taken before media changes. As described, daily culture medium replacement is not accompanied with washing steps, thus by day 20, dead cells and debris may be accumulating. Images were taken with an EVOS FL microscope at 20× magnification and scale bar corresponds to 100 μm.
Figure 4
Figure 4
Immunocytochemistry (ICC) / Immunofluorescence analysis at Day 13 To assess the self-patterning stage beyond the characterization by brightfield microscopy, immunofluorescence imaging analysis was performed at day 13. (A) Cells at this stage show abundant expression of the structural cytoskeletal protein expressed in early neurons, beta-3 tubulin (TUBB3 in red) commonly used as an immature neuronal marker (A; DAPI in blue). (B and C) Additionally, cells are immunostained for the early telencephalic marker FOXG1 (B in green; DAPI in blue), and PAX6 (C in red; DAPI in blue). (D) SOX2 is also highly expressed at this stage (D in red) and the progenitor cells also express the intermediate filament NESTIN (D in green). Scale bar corresponds to 20 μm.
Figure 5
Figure 5
qPCR analysis of pluripotency and neuronal markers In order to characterize the derivative cell populations, hESCs collected at the onset of the protocol (Day 0), and cells derived at all 3 time points of the differentiation protocol (i.e., at Day 7, Day 13 and Day 20) were analyzed for specific pluripotency markers (POU5F1, NANOG, SOX2, NES), major neuronal development transcription factors (SOX2, OTX2, FOXG1, NEUROD1) and genes related to cytoskeletal rearrangement during differentiation towards neuronal maturation (NES, VIM, TUBB3 and MAP2) by qRT-PCR. The expression of the pluripotency transcription factors POU5F1 and NANOG decreases to zero already at Day 7, while SOX2 and NES expression increases as hESCs commit to neuronal fate. NES expression decreases at Day 20, consistent with an arising neuronal, non-proliferative cell population of Day 20. Similar expression pattern was observed with FOXG1, one of the earliest telencephalic specific transcription factors. The expression of the transcription factor OTX2, which is known as a regulator of neurogenesis, increases as cells differentiate, promoting their commitment. This increasing pattern of expression from Day 0 to Day 20 is also seen in the expression of the key bHLH enhancer of transcriptional regulators of neurogenesis NEUROD1, the mature dendritic marker MAP2, the neuronal specific TUBB3, and the intermediate filament VIM. For the qPCR analysis we used samples collected from 3 separate experiments (cells collected from one well were considered one sample, 3 samples were collected per experiment, and each sample collected for analysis was run in technical triplicate.) Each value is plotted as a point (average value of technical triplicates), on top of the box plot. The box represents 25th to the 75th percentile, and the midline represents the median value, and the line goes from minimum to maximum.
Figure 6
Figure 6
A timeline of differentiation for HS360 hESCs Representative phase contrast images of cells through differentiation (Days 1–20). The images were taken with the EVOS FL microscope, and the scale bar corresponds to 100 μm.
Figure 7
Figure 7
A timeline of differentiation when the protocol was replicated using H9 hESCs Representative phase contrast images of cells through differentiation (Days 1–20). The images were taken with the EVOS FL microscope, and the scale bar corresponds to 100 μm.

References

    1. Biffi E., Regalia G., Menegon A., Ferrigno G., Pedrocchi A. The influence of neuronal density and maturation on network activity of hippocampal cell cultures: a methodological study. PLoS One. 2013;8:e83899. doi: 10.1371/journal.pone.0083899. - DOI - PMC - PubMed
    1. Cakir B., Xiang Y., Tanaka Y., Kural M.H., Parent M., Kang Y.J., Chapeton K., Patterson B., Yuan Y., He C.S., et al. Engineering of human brain organoids with a functional vascular-like system. Nat. Methods. 2019;16:1169–1175. doi: 10.1038/s41592-019-0586-5. - DOI - PMC - PubMed
    1. Carmona-Fontaine C., Matthews H., Kuriyama S., Moreno M., Dunn G.A., Parsons M., Stern C.D., Mayor R. Contact inhibition of locomotion in vivo controls neural crest directional migration. Nature. 2008;456:957–961. doi: 10.1038/nature07441. - DOI - PMC - PubMed
    1. Claassen D.A., Desler M.M., Rizzino A. ROCK inhibition enhances the recovery and growth of cryopreserved human embryonic stem cells and human induced pluripotent stem cells. Mol. Reprod. Dev. 2009;76:722–732. doi: 10.1002/mrd.21021. - DOI - PMC - PubMed
    1. Desai N., Rambhia P., Gishto A. Human embryonic stem cell cultivation: historical perspective and evolution of xeno-free culture systems. Reprod. Biol. Endocrinol. 2015;13:9. doi: 10.1186/s12958-015-0005-4. - DOI - PMC - PubMed

Publication types

LinkOut - more resources