. 2022 Nov 1:401:115541.
doi: 10.1016/j.cma.2022.115541. Epub 2022 Sep 15.

Modeling nonlocal behavior in epidemics via a reaction-diffusion system incorporating population movement along a network

Affiliations

Modeling nonlocal behavior in epidemics via a reaction-diffusion system incorporating population movement along a network

Malú Grave et al. Comput Methods Appl Mech Eng. .

Abstract

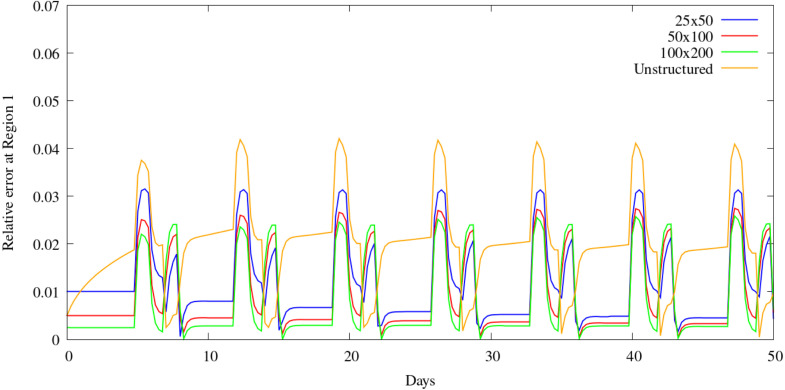
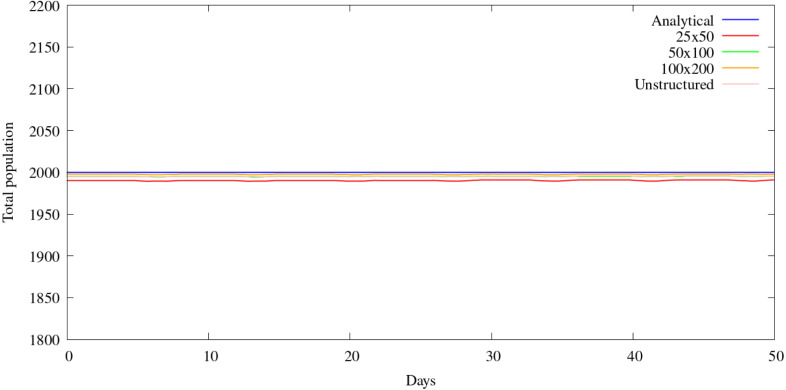
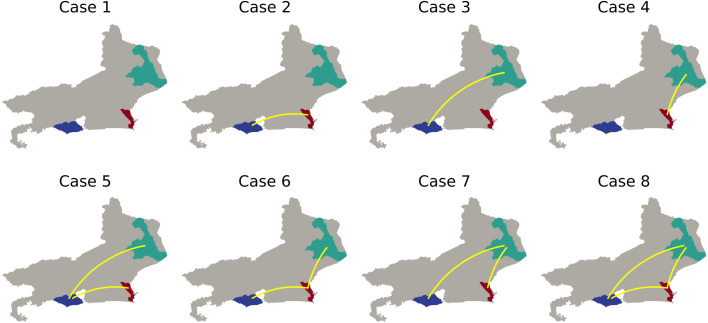
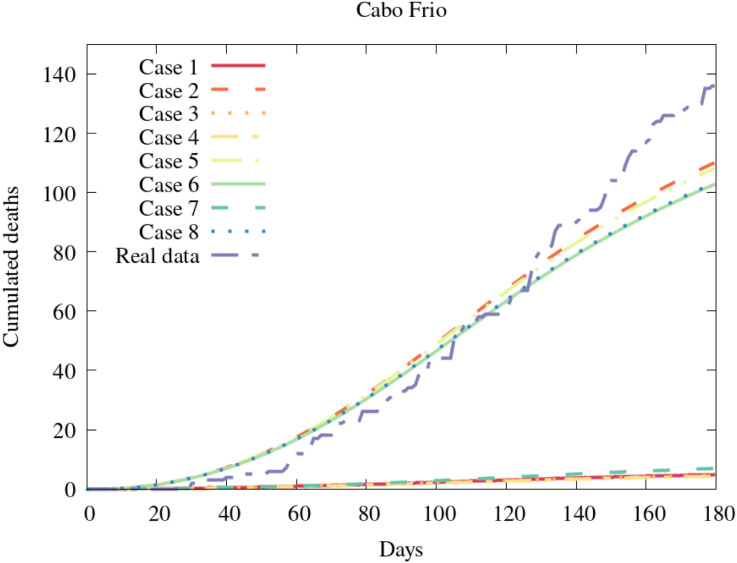
The outbreak of COVID-19, beginning in 2019 and continuing through the time of writing, has led to renewed interest in the mathematical modeling of infectious disease. Recent works have focused on partial differential equation (PDE) models, particularly reaction-diffusion models, able to describe the progression of an epidemic in both space and time. These studies have shown generally promising results in describing and predicting COVID-19 progression. However, people often travel long distances in short periods of time, leading to nonlocal transmission of the disease. Such contagion dynamics are not well-represented by diffusion alone. In contrast, ordinary differential equation (ODE) models may easily account for this behavior by considering disparate regions as nodes in a network, with the edges defining nonlocal transmission. In this work, we attempt to combine these modeling paradigms via the introduction of a network structure within a reaction-diffusion PDE system. This is achieved through the definition of a population-transfer operator, which couples disjoint and potentially distant geographic regions, facilitating nonlocal population movement between them. We provide analytical results demonstrating that this operator does not disrupt the physical consistency or mathematical well-posedness of the system, and verify these results through numerical experiments. We then use this technique to simulate the COVID-19 epidemic in the Brazilian region of Rio de Janeiro, showcasing its ability to capture important nonlocal behaviors, while maintaining the advantages of a reaction-diffusion model for describing local dynamics.

Keywords: COVID-19; Compartmental models; Diffusion–reaction; Partial differential equations; Population movement.


Conflict of interest statement

The authors declare that they have no known competing financial interests or personal relationships that could have appeared to influence the work reported in this paper.

Figures

Fig. 1
Fig. 1
Simple test problem schematic.
Fig. 2
Fig. 2
Simple test problem meshes. (A) 25 × 50 elements mesh. (B) unstructured mesh.
Fig. 3
Fig. 3
Population at Region 1. (For interpretation of the references to color in this figure legend, the reader is referred to the web version of this article.)
Fig. 4
Fig. 4
Population at Region 2. (For interpretation of the references to color in this figure legend, the reader is referred to the web version of this article.)
Fig. 5
Fig. 5
Population relative error at Region 1. (For interpretation of the references to color in this figure legend, the reader is referred to the web version of this article.)
Fig. 6
Fig. 6
Population relative error at Region 2.
Fig. 7
Fig. 7
Total population.
Fig. 8
Fig. 8
Total population relative error for each grid. (For interpretation of the references to color in this figure legend, the reader is referred to the web version of this article.)
Fig. 9
Fig. 9
Sketch of the Rio de Janeiro state, Brazil, highlighting the Rio de Janeiro, Cabo Frio and Campos de Goytacazes counties.
Fig. 10
Fig. 10
Initial exposed/infected population at Rio de Janeiro state. (For interpretation of the references to color in this figure legend, the reader is referred to the web version of this article.)
Fig. 11
Fig. 11
Initial susceptible population at Rio de Janeiro state. (For interpretation of the references to color in this figure legend, the reader is referred to the web version of this article.)
Fig. 12
Fig. 12
Definition of the movement for each case. The region in blue is Rio de Janeiro city (RJ), red is Cabo Frio (CF) and green is Campos dos Goytacazes (CG). (For interpretation of the references to color in this figure legend, the reader is referred to the web version of this article.)
Fig. 13
Fig. 13
Cabo Frio cumulative deaths. (For interpretation of the references to color in this figure legend, the reader is referred to the web version of this article.)
Fig. 14
Fig. 14
Campos dos Goytacazes cumulative deaths. (For interpretation of the references to color in this figure legend, the reader is referred to the web version of this article.)
Fig. 15
Fig. 15
Rio de Janeiro city cumulative deaths. (For interpretation of the references to color in this figure legend, the reader is referred to the web version of this article.)
Fig. 16
Fig. 16
Total population relative error considering population movement. (For interpretation of the references to color in this figure legend, the reader is referred to the web version of this article.)
Fig. 17
Fig. 17
Spatial distribution of the deceased population at t=180 days for Case 1 (no population movement) and Case 8 (population movement network between RJ, CF and CG). (For interpretation of the references to color in this figure legend, the reader is referred to the web version of this article.)
Fig. 18
Fig. 18
Relative error between the deceased population at t=180 days for Case 1 (no population movement) and Case 8 (population movement network between RJ, CF and CG). Left: negative values. Right: positive values. (For interpretation of the references to color in this figure legend, the reader is referred to the web version of this article.)

References

    1. Zhang S., Ponce J., Zhang Z., Lin G., Karniadakis G. An integrated framework for building trustworthy data-driven epidemiological models: Application to the COVID-19 outbreak in New York City. PLoS Comput. Biol. 2021;17(9) - PMC - PubMed
    1. Viguerie A., Barros G.F., Grave M., Reali A., Coutinho A.L. Coupled and uncoupled dynamic mode decomposition in multi-compartmental systems with applications to epidemiological and additive manufacturing problems. Comput. Methods Appl. Mech. Engrg. 2022;391
    1. Jha P.K., Cao L., Oden J.T. Bayesian-based predictions of COVID-19 evolution in Texas using multispecies mixture-theoretic continuum models. Comput. Mech. 2020;66(5):1055–1068. - PMC - PubMed
    1. Calvetti D., Hoover A.P., Rose J., Somersalo E. Metapopulation network models for understanding, predicting, and managing the coronavirus disease COVID-19. Front. Phys. 2020:261.
    1. Bhouri M.A., Costabal F.S., Wang H., Linka K., Peirlinck M., Kuhl E., Perdikaris P. COVID-19 dynamics across the US: A deep learning study of human mobility and social behavior. Comput. Methods Appl. Mech. Engrg. 2021;382

LinkOut - more resources