. 2022 Sep 16:2:116.
doi: 10.1038/s43856-022-00176-7. eCollection 2022.

Germany's fourth COVID-19 wave was mainly driven by the unvaccinated

Affiliations

Germany's fourth COVID-19 wave was mainly driven by the unvaccinated

Benjamin F Maier et al. Commun Med (Lond). .

Abstract

Background: While the majority of the German population was fully vaccinated at the time (about 65%), COVID-19 incidence started growing exponentially in October 2021 with about 41% of recorded new cases aged twelve or above being symptomatic breakthrough infections, presumably also contributing to the dynamics. So far, it remained elusive how significant this contribution was and whether targeted non-pharmaceutical interventions (NPIs) may have stopped the amplification of the crisis.

Methods: We develop and introduce a contribution matrix approach based on the next-generation matrix of a population-structured compartmental infectious disease model to derive contributions of respective inter- and intragroup infection pathways of unvaccinated and vaccinated subpopulations to the effective reproduction number and new infections, considering empirical data of vaccine efficacies against infection and transmission.

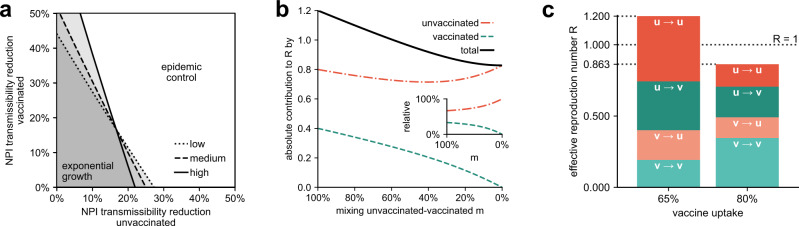
Results: Here we show that about 61%-76% of all new infections were caused by unvaccinated individuals and only 24%-39% were caused by the vaccinated. Furthermore, 32%-51% of new infections were likely caused by unvaccinated infecting other unvaccinated. Decreasing the transmissibility of the unvaccinated by, e. g. targeted NPIs, causes a steeper decrease in the effective reproduction number R than decreasing the transmissibility of vaccinated individuals, potentially leading to temporary epidemic control. Reducing contacts between vaccinated and unvaccinated individuals serves to decrease R in a similar manner as increasing vaccine uptake.

Conclusions: A minority of the German population-the unvaccinated-is assumed to have caused the majority of new infections in the fall of 2021 in Germany. Our results highlight the importance of combined measures, such as vaccination campaigns and targeted contact reductions to achieve temporary epidemic control.

Keywords: Computational biology and bioinformatics; Viral infection.


Conflict of interest statement

Competing interestsThe authors declare no competing interests.

Figures

Fig. 1
Fig. 1. Estimated contributions of infection pathways towards new cases within vaccinated and unvaccinated subpopulations.
Estimated contributions of infection pathways to R in the (a) “high efficacy”, (b) “medium efficacy”, and (c) “low efficacy” scenarios as a graphical representation of Tabs. 2–4. The charts can be read as follows: Consider an infected population that caused a new generation of 100 new infecteds. Then for (a), 51 of those newly infected individuals will be unvaccinated people that have been infected by other unvaccinated people. Likewise, 25 newly infected individuals will be vaccinated people that have been infected by unvaccinated individuals. Hence, 76 new infections will have been caused by the unvaccinated. Along the same line, 15 newly infecteds will be unvaccinated people that have been infected by vaccinated individuals and 9 newly infecteds will be vaccinated people that have been infected by other vaccinated individuals, totaling 24 new infections that have been caused by vaccinated individuals.
Fig. 2
Fig. 2. Efficacy of potential interventions to achieve temporary epidemic control.
a Required additional transmissibility reduction for the unvaccinated (horizontal axis) and vaccinated (vertical axis) population to lower R to values below one, based on the assumption that the initial effective reproduction number is equal to R=1.2. b The absolute contributions to R of the unvaccinated (orange) and vaccinated population (green) as well as their sum (black) with decreasing mixing m between both groups, based on the “medium efficacy” scenario. The inset shows the respective relative contributions. Note that if heterogeneous mixing was already present during our observational period, the monotonically increasing contribution of the unvaccinated displayed in the inset implies that our results of Fig. 1 are actually lower bounds of the true contribution. c Absolute contributions to R for infections between and across groups of vaccinated and unvaccinated individuals at the vaccine uptake during the observational period (left bar) and a hypothetical vaccine uptake of 80% in the total population, i.e., 90% in the age groups that were, at the time, eligible for vaccination (right bar), based on the “medium efficacy” scenario. The latter would have sufficed to suppress R sufficiently below one, assuming that other factors determining the base transmissibility remained on the same level.
Fig. 3
Fig. 3. Fraction of new cases caused by the unvaccinated and vaccinated population for varying age-independent vaccine efficacy s.
We consider an optimistic scenario with constant r = 0.1 and b = 3/2 (solid lines), and a pessimistic estimation in which r and b decrease according to r = s/10 and b = s/2 + 1 (dashed lines). As long as s remains larger than approximately 22% (optimistic, r=40%) or 41% (pessimistic, r=20%), the unvaccinated minority still causes the majority of infections, see also Supplementary Methods, Sec. 1.3.1 and Sec. 1.3.7.

References

    1. World Health Organisation. WHO Coronavirus (COVID-19) Dashboard (2021). https://covid19.who.int. Accessed: 2021-11-19.
    1. Keeling, M. J. & Rohani, P. Modeling infectious diseases in humans and animals (Princeton University Press, 2011). 10.2307/j.ctvcm4gk0.
    1. Haug N, et al. Ranking the effectiveness of worldwide COVID-19 government interventions. Nat. Human Behav. 2020;4:1303–1312. doi: 10.1038/s41562-020-01009-0. - DOI - PubMed
    1. Maier BF, Brockmann D. Effective containment explains subexponential growth in recent confirmed COVID-19 cases in China. Science. 2020;368:742–746. doi: 10.1126/science.abb4557. - DOI - PMC - PubMed
    1. Habersaat KB, et al. Ten considerations for effectively managing the COVID-19 transition. Nat. Human Behav. 2020;4:677–687. doi: 10.1038/s41562-020-0906-x. - DOI - PubMed