. 2022 Sep 3;25(10):105057.
doi: 10.1016/j.isci.2022.105057. eCollection 2022 Oct 21.

Deletion of mdig enhances H3K36me3 and metastatic potential of the triple negative breast cancer cells

Affiliations

Deletion of mdig enhances H3K36me3 and metastatic potential of the triple negative breast cancer cells

Chitra Thakur et al. iScience. .

Abstract

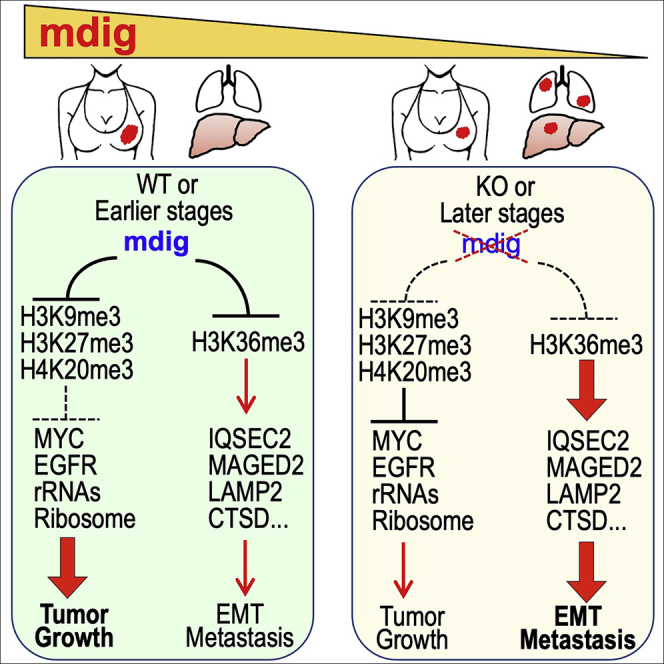
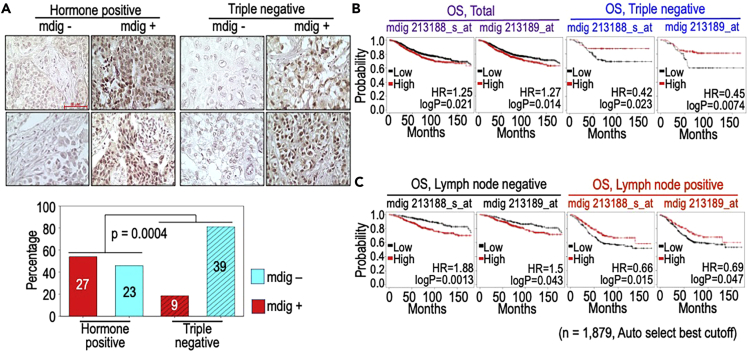
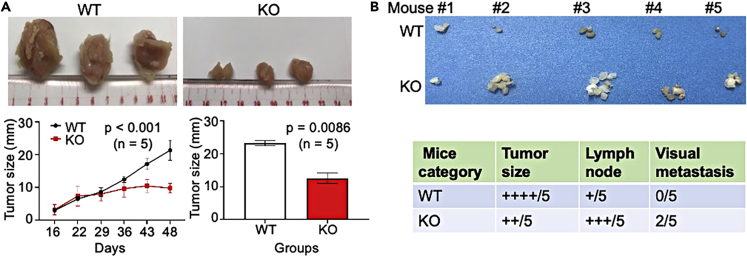
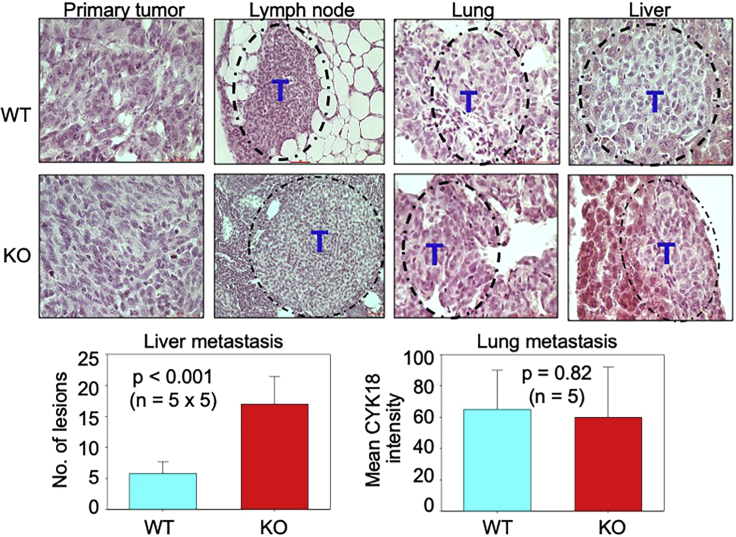
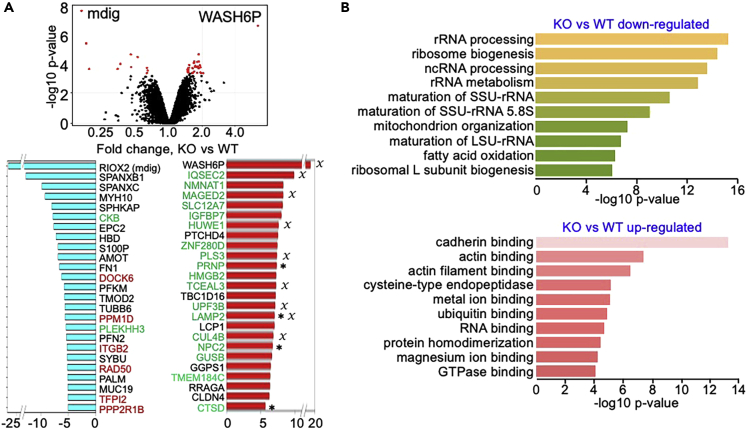
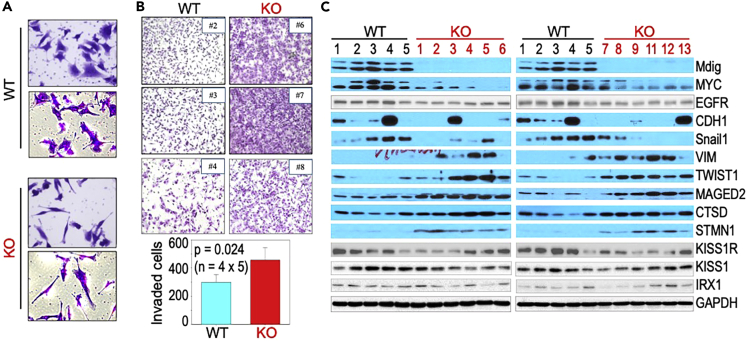
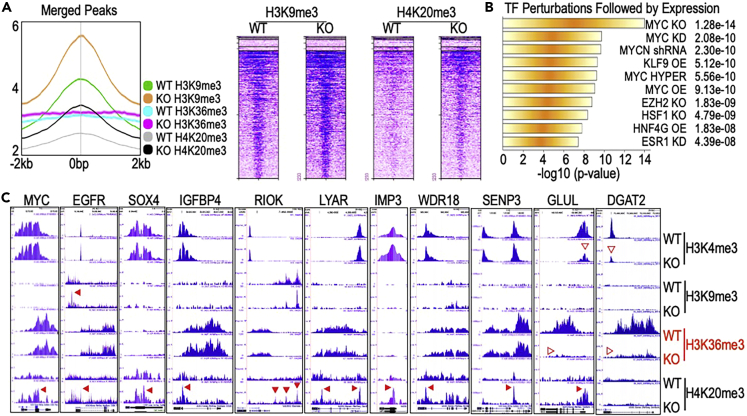
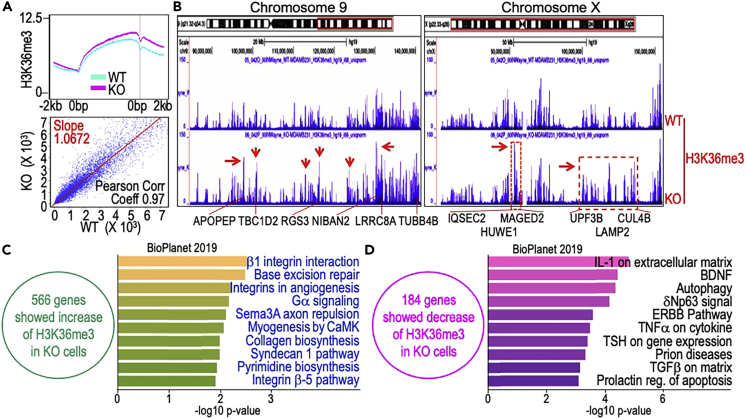
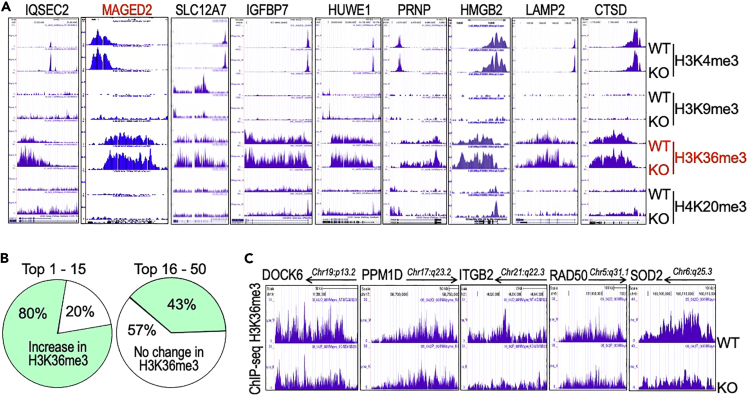
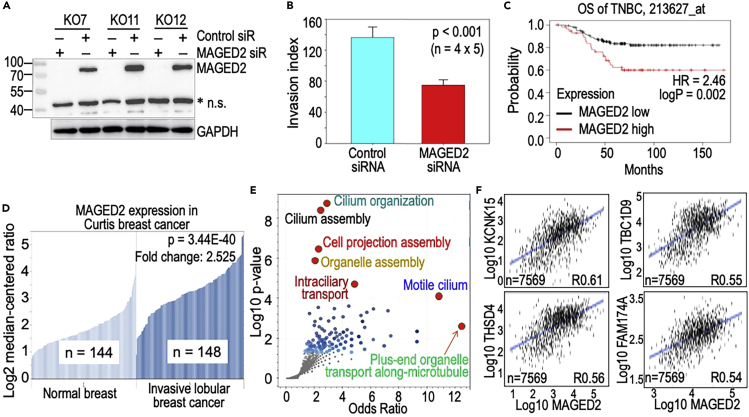
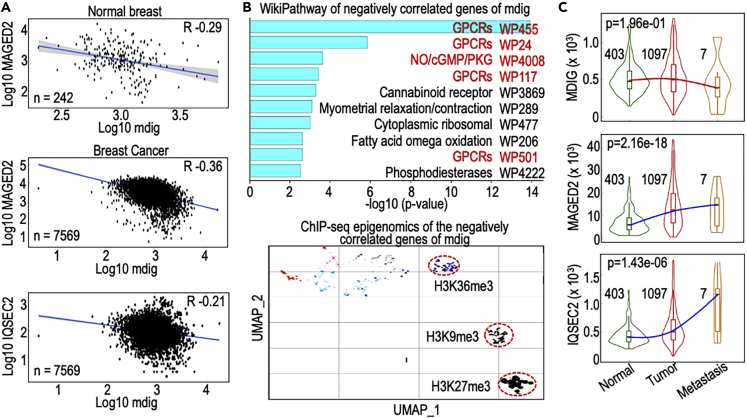
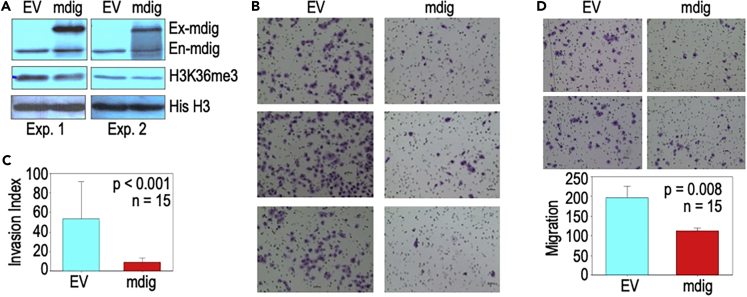
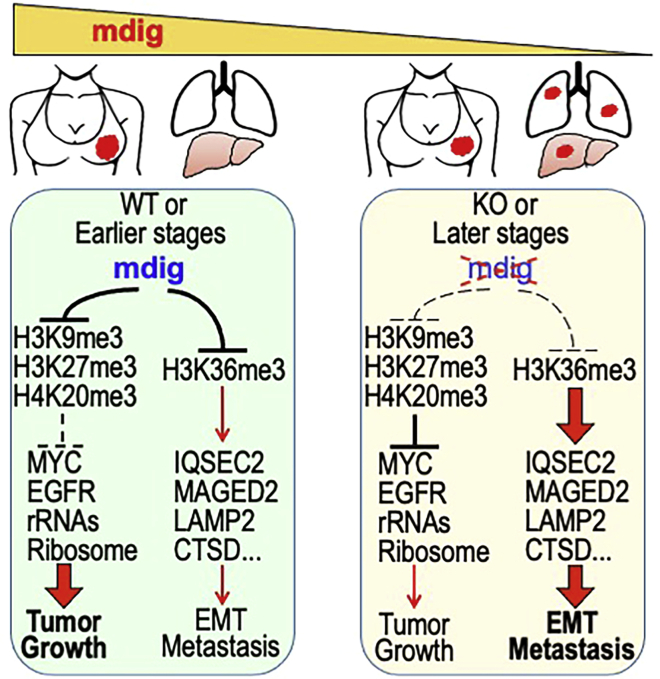
In this report, we provide evidence showing diminished expression of the mineral dust-induced gene (mdig), a previously identified oncogenic gene, in human triple negative breast cancer (TNBC). Using a mouse model of orthotopic xenograft of the TNBC MDA-MB-231 cells, we demonstrate that mdig promotes the growth of primary tumors but inhibits metastasis of these cells in vivo. Knockout of mdig resulted in an enhancement of H3K36me3 in the genome and upregulation of some X chromosome-linked genes for cell motility, invasion, and metastasis. Silencing MAGED2, one of the most upregulated and H3K36me3-enriched genes resulted from mdig depletion, can partially reverse the invasive migration of the mdig knockout cells. The anti-metastatic and inhibitory role of mdig on H3K36me3 was cross-validated in another cell line, A549 lung cancer cells. Together, our data suggest that mdig is antagonist against H3K36me3 that enforces expression of genes, such as MAGED2, for cell invasion and metastasis.

Keywords: Cancer; Molecular biology; Molecular mechanism of gene regulation.


Conflict of interest statement

The authors declare no competing interests.

Figures

None
Graphical abstract
Figure 1
Figure 1
Loss of mdig expression in triple negative breast cancer (TNBC) (A) Immunohistochemistry (IHC) of mdig expression in hormone positive breast cancer and TNBC. Both groups of tumors contain mdig positive and mdig negative cancer tissue samples. In hormone positive group, 54% of tumor samples are mdig positive. In TNBC, only 18% of these samples are mdig positive. Scale bar = 50 μm, magnification is 40×. (B) Kaplan-Meier overall survival (OS) analysis of 1,879 cases of breast cancer with high and low mdig expression. Right two panels show the prognostic outcomes of mdig expression in 201 TNBC cases. Both probes of mdig in the database are shown. (C) High level of mdig predicts poor survival of the patients without lymph node metastasis (left two panels) but predicts better survival of the patients with lymph node metastasis (right two panels).
Figure 2
Figure 2
Breast tumor formation in NSG mice injected with WT and mdig KO MDA-MB-231 cells (A) Photographs of the freshly resected mammary tumors from the mice injected with WT and KO cells, respectively. The WT cells form large tumors than the KO cells. Lower panels show quantification of the tumor size. Data are represented as mean ± SD. Tumors from the KO cells not only grow much slower (left panel) but are significantly smaller in size at the end of experiments (right panel). Only three tumors from each group of mice were shown. (B) Photographs of the resected axillary and lumbar lymph nodes from the mice received with WT and KO cells. An overall enlargement of lymph nodes in the mice received with KO cells was observed. Bottom panel shows the summary of the tumor size, lymph node and the visually observed metastasis in the mice received with WT and KO cells.
Figure 3
Figure 3
Histological evaluation of the primary tumors and distant organs for metastasis Paraffin embedded tissue sections were stained for H&E and microscopic examination of the tumors formed by WT and KO MDA-MB-231 cells. Primary tumors as well as tumor cells in the lymph nodes, lung, and liver tissues were shown. Dashed line circles show metastasized tumors in lymph node, lung and liver. Images are representatives from 5 mice received WT cells and 5 mice received KO cells. T: Tumor. Scale bar = 50 μm, magnification is 40× except for lymph nodes which is 20×. Bottom panels show the quantification of the cytokeratin 18 positive lesions in the liver (left) and the lung (right). Data are represented as mean ± SD.
Figure 4
Figure 4
Quantitative proteomics analysis for protein expression between WT and KO MDA-MB-231 cells (A) Volcano plot shows increased and decreased proteins in the mdig KO cells (upper panel). Bottom panel shows top-25 the most downregulated (left) and upregulated proteins (right) in the KO cells. Gene names with red color are those genes with decreased enrichment of H3K36me3. Gene names with green color are the genes with an enhanced enrichment of H3K36me3 in the mdig KO cells. Asterisks indicate proteins located in lysosomes. X denotes the proteins that are encoded by genes located in chromosome X. (B) Ontology GO molecular function assay of the downregulated proteins (upper panel) and the upregulated proteins (bottom panel) in the KO cells.
Figure 5
Figure 5
Knockout of mdig enhances invasive migration of the MDA-MB-231 cells and affects the expression of genes associated with invasion and EMT (A) Cell morphology of the WT and KO cells. (B)Trans-well invasion assay of the WT and KO cells. WT clones 2, 3 and 4, and KO clones 6, 7 and 8 were shown. Bottom panel shows relative numbers of invasive cells of the WT and KO cells. Data are represented as mean ± SD. (C) Immunoblotting of the indicated proteins between 5 WT clones and 12 KO clones.
Figure 6
Figure 6
Enhanced repressive histone trimethylation and down-regulation of MYC signaling in the mdig KO cells (A) Average plots of the merged peaks of ChIP-seq for H3K9me3, H3K36me3 and H4K20me3 in the regions from -2 kb to 2 kb of gene loci in WT and mdig KO cells. Right panel shows heatmaps of the merged peak distribution of H3K9me3 and H4K20me3 between WT and mdig KO cells. (B) Transcription factor pathway analysis using Enrichr TF Perturbations Followed by Expression for the 980 downregulated proteins in the mdig KO MDA-MB-231 cells. (C) Histone trimethylation profiles of the selected MYC pathway genes in both WT and mdig KO cells. Block arrowheads depict the enhanced enrichment of the repressive histone trimethylation markers on the indicated genes in KO cells. Empty arrowheads indicate diminished active histone trimethylation markers in the indicated gene in WT and KO cells.
Figure 7
Figure 7
Enhanced enrichment of H3K36me3 in the mdig KO cells (A) ChIP-seq shows global enrichment levels of H3K36me3 on the gene bodies between WT and KO cells (top panel) and Pearson correlation of H3K36me3 between WT and KO cells (bottom panel). (B) Genome browser screenshots of H3K36me3 between WT and KO cells using examples of chromosomes 9 (left panel) and X (right panel). Red arrows and dashed red boxes show regions in the chromosomes with an enhanced enrichment of H3K36me3 in the KO cells. Typical genes with enhanced enrichment of H3K36me3 are listed at the bottom of the panels. (C) Ontology molecular function assay of the genes with a more than 2-fold increase of H3K36me3 in the KO cells. (D) Ontology molecular function assay of the genes with a more than 2-fold decrease of H3K36me3 in the KO cells.
Figure 8
Figure 8
Correlation between the most increased expression of genes in metastasis and enhanced enrichment of H3K36me3 in the KO cells (A) Genome browser screenshots of the histone methylation pattern on the selected most upregulated genes in mdig KO cells. (B) Different degrees of correlation between the upregulated genes and the enhanced enrichment of H3K36me3 in KO cells. The top 50 most upregulated genes in KO cells were analyzed for an increase of H3K36me3. In the top 1 to 15 range, 80% of these genes showed an elevated enrichment of H3K36me3, whereas from top 16 to 50 range, 43% of the genes showed an increase in H3K36me3. (C) Genome browser screenshots depicts representative downregulated genes with a pronounced diminishment of H3K36me3 in the KO cells.
Figure 9
Figure 9
MAGED2 positively regulates the invasive migration of the breast cancer cells (A) Three clones of mdig KO MDA-MB-231 cells were silenced for MAGED2 gene using siRNA targeting MAGED2. GAPDH was used as loading control for the Western blotting. MAGED2 was completely silenced by the MAGED2 siRNA, but not the control siRNA. (B) Loss of MAGED2 through siRNA silencing resulted in lower invasion capability of the KO cells, indicating MAGED2 is a positive regulator for the invasive migration. Data are represented as mean ± SD. (C) High MAGED2 predicts poorer relapse free survival (RFS) of breast cancer patients, concomitant with p53 mutation. (D) High MAGED2 expression is a common feature of the invasive breast cancer. Data are derived from Curtis Breast cancer that showed a more than 2-fold elevation of MAGED2 gene in invasive lobular breast cancer compared to normal breast tissue. (E) Volcano plot shows strong correlation of MAGED2 expression with the genes involved in the organization, assembly and regulation of cilium for cell locomotion. (F) Selected examples of top-correlated genes of MAGED2 in breast cancer.
Figure 10
Figure 10
Negative correlation of mdig with MAGED2 and other metastasis-related genes (A) Negative correlation of mdig with MAGED2 in both normal breast tissues and breast cancer tissues. Bottom panel shows negative correlation of mdig with IQSEC2. (B) WikiPathways analysis of 3,299 genes that showed more than 20% of negative correlation with mdig. The genes enriched on the major GPCRs pathways are marked in red. Bottom panel shows epigenomics clustering of the negatively correlated genes with mdig in breast cancer samples. (C) Inverse correlation of mdig with MAGED2 and IGSEC2 in metastatic breast cancers.
Figure 11
Figure 11
Overexpression of mdig represses H3K36me3 in and invasion of the A549 lung cancer cell (A) Western blotting for mdig, H3K36me3 and histone H3 (His H3) in A549 cells transfected with an empty expression vector (EV) or mdig expressing vector. Ex-mdig: exogenous mdig; En-mdig: endogenous mdig. (B) Invasive migration assay of the A549 cells expressing empty vector or mdig. (C) Quantification of invasive cells in B. Data are represented as mean ± SD. (D) Migration assay of the A549 cells transfected with empty vector and mdig. Lower panel shows quantification of the migrated cells. Data are represented as mean ± SD.
Figure 12
Figure 12
Schematic diagram shows the regulatory roles of mdig on histone protein methylations, tumor cells growth and metastasis In earlier stage breast cancer or WT breast cancer cells, increased expression of mdig antagonizes the repressive trimethylation of histone proteins, including H3K9me3, H3K27me3, and H4K20me3, leading to derepression of the major oncogenes, such as MYC, EGFR, and others, that promote tumor growth. Mdig is also antagonistic toward H3K36me3 that preferentially enforces expression of the genes in cancer cell motility, EMT and metastasis. In later stage breast cancer or the mdig KO breast cancer cells, because of the loss of mdig expression, the repressive trimethylations of histone proteins compromise the expression of the growth promoting oncogenes. Meanwhile, loss of mdig causes enhanced enrichment of H3K36me3 that boosts transcriptional elongation of the genes involved in cell motility, EMT and metastasis. Thus, metastasis or uplifted metastatic potential is dominant in the later stage breast cancer or the breast cancer cells with mdig knockout.

Similar articles

Cited by

References

    1. Aytes A., Giacobbe A., Mitrofanova A., Ruggero K., Cyrta J., Arriaga J., Palomero L., Farran-Matas S., Rubin M.A., Shen M.M., et al. NSD2 is a conserved driver of metastatic prostate cancer progression. Nat. Commun. 2018;9:5201. - PMC - PubMed
    1. Baquero M.T., Hanna J.A., Neumeister V., Cheng H., Molinaro A.M., Harris L.N., Rimm D.L. Stathmin expression and its relationship to microtubule-associated protein tau and outcome in breast cancer. Cancer. 2012;118:4660–4669. - PMC - PubMed
    1. Bi Z., Zhang Q., Fu Y., Seno A., Wadgaonkar P., Qiu Y., Almutairy B., Xu L., Zhang W., Thakur C., Chen F. Cooperation between NRF2-mediated transcription and MDIG-dependent epigenetic modifications in arsenic-induced carcinogenesis and cancer stem cells. Semin. Cancer Biol. 2021;76:310–318. - PMC - PubMed
    1. Birkbak N.J., McGranahan N. Cancer genome evolutionary trajectories in metastasis. Cancer Cell. 2020;37:8–19. - PubMed
    1. Bott A.J., Peng I.C., Fan Y., Faubert B., Zhao L., Li J., Neidler S., Sun Y., Jaber N., Krokowski D., et al. Oncogenic Myc induces expression of glutamine synthetase through promoter demethylation. Cell Metab. 2015;22:1068–1077. - PMC - PubMed