. 2022 Aug 24;3(9):100565.
doi: 10.1016/j.patter.2022.100565. eCollection 2022 Sep 9.

Knowledge-guided deep learning models of drug toxicity improve interpretation

Affiliations

Knowledge-guided deep learning models of drug toxicity improve interpretation

Yun Hao et al. Patterns (N Y). .

Abstract

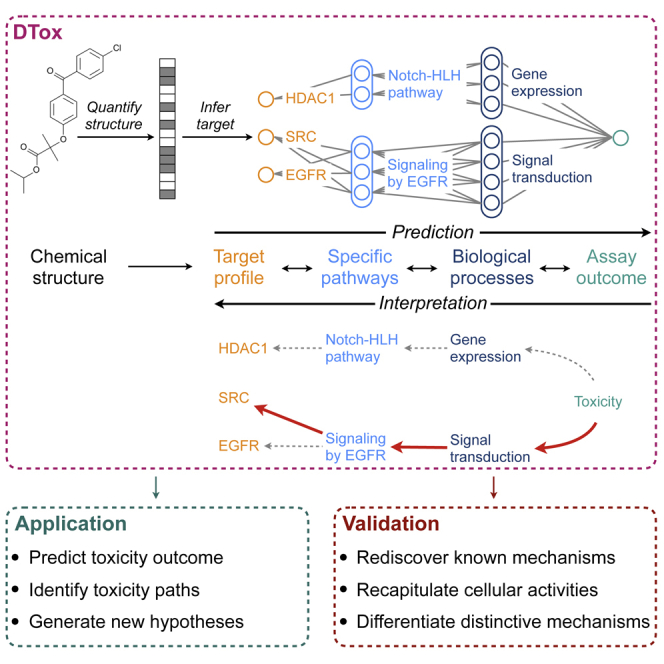
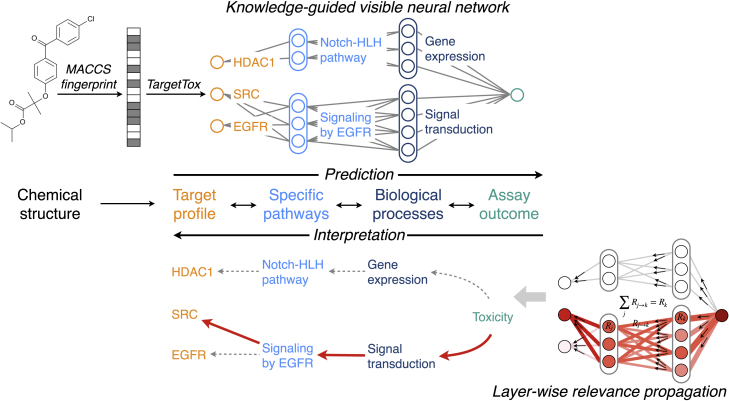
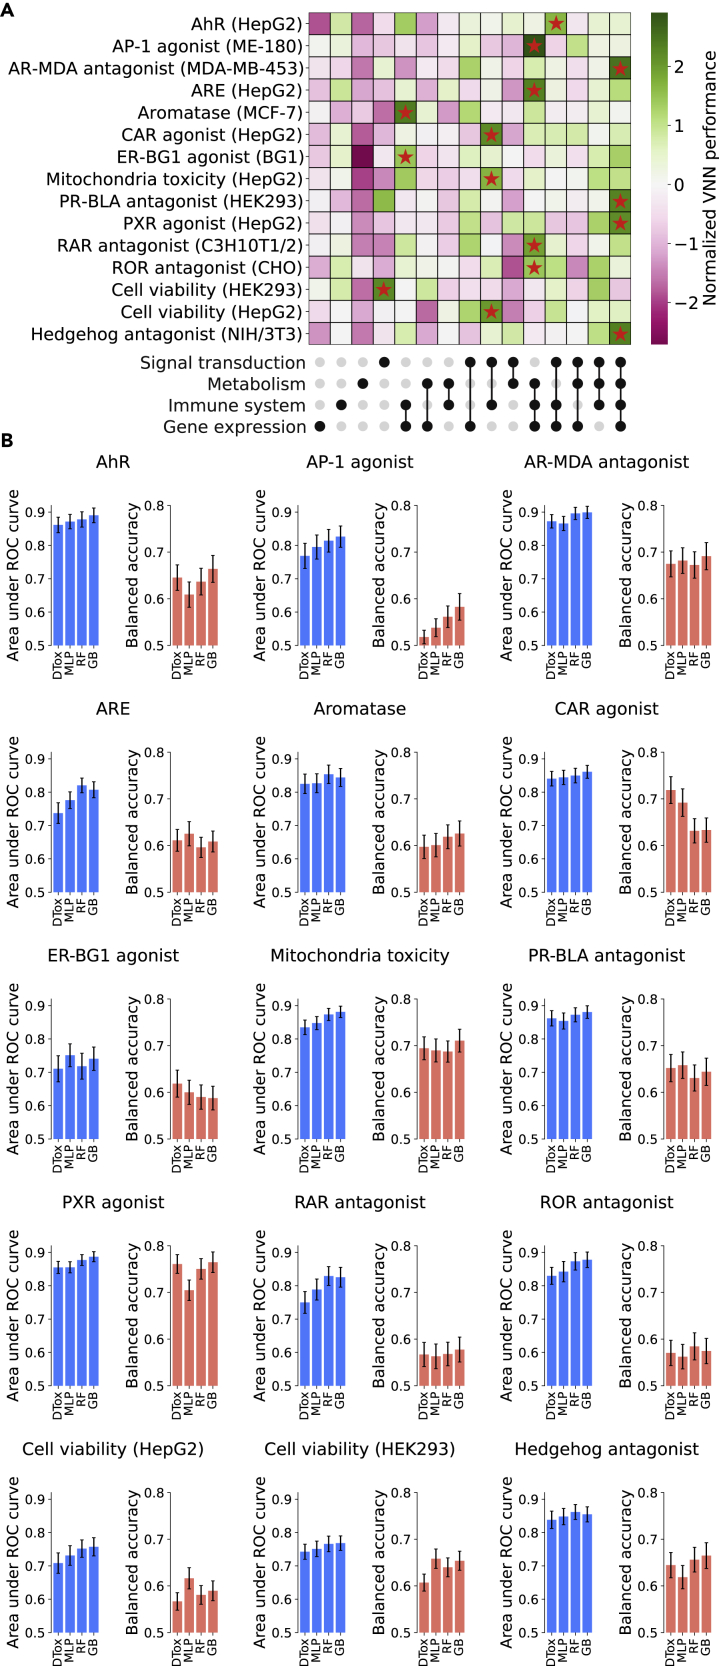
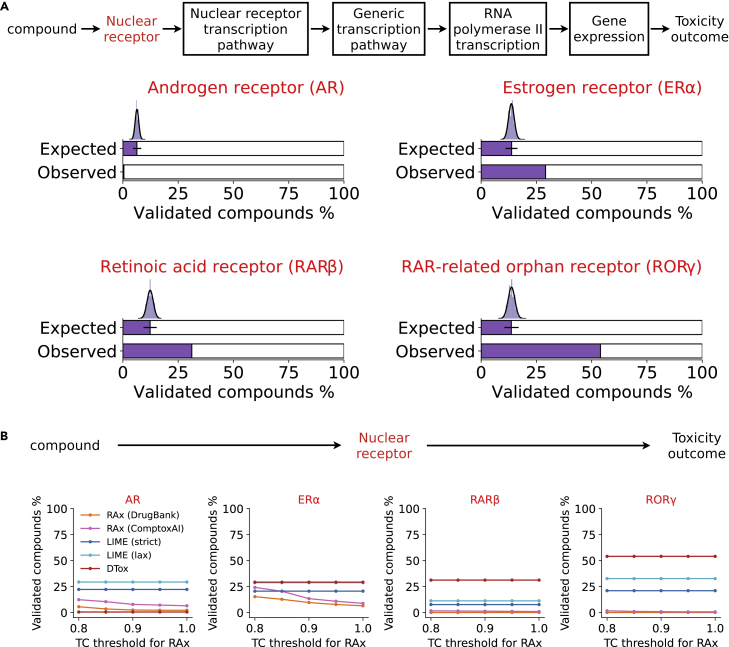
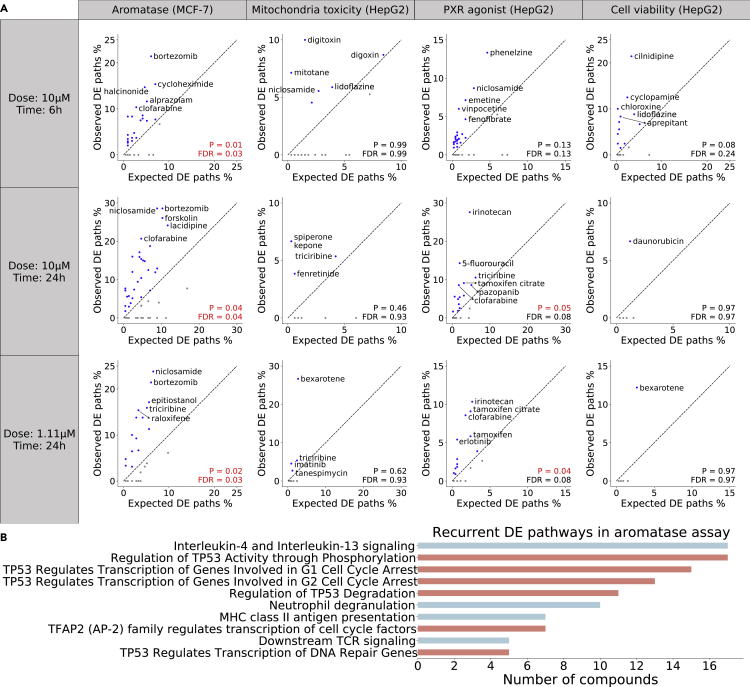
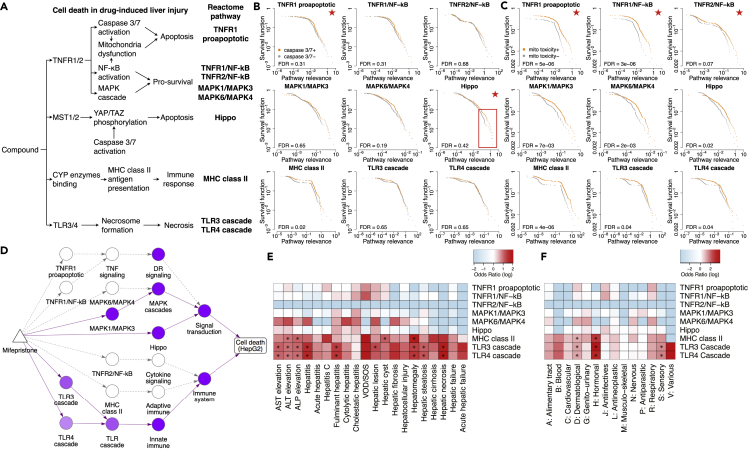
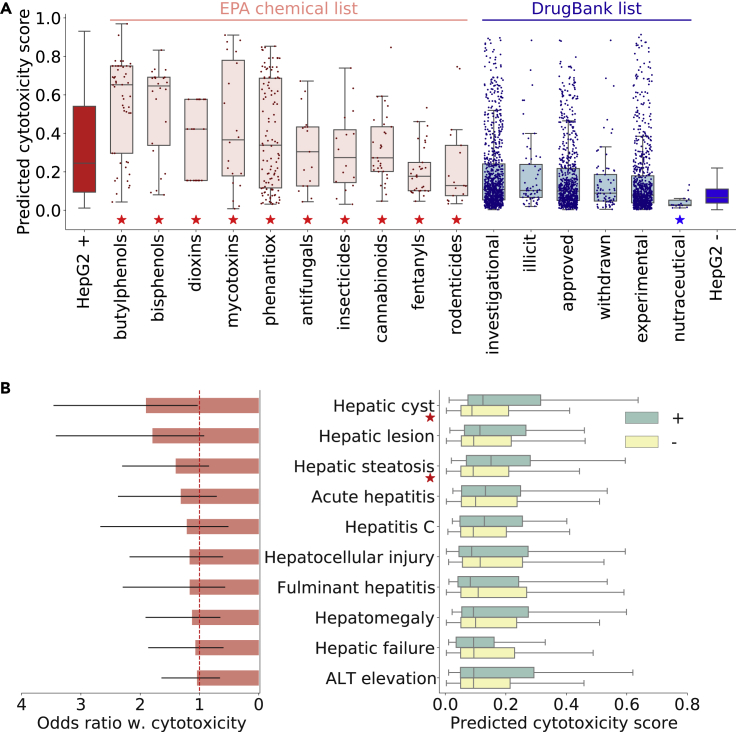
In drug development, a major reason for attrition is the lack of understanding of cellular mechanisms governing drug toxicity. The black-box nature of conventional classification models has limited their utility in identifying toxicity pathways. Here we developed DTox (deep learning for toxicology), an interpretation framework for knowledge-guided neural networks, which can predict compound response to toxicity assays and infer toxicity pathways of individual compounds. We demonstrate that DTox can achieve the same level of predictive performance as conventional models with a significant improvement in interpretability. Using DTox, we were able to rediscover mechanisms of transcription activation by three nuclear receptors, recapitulate cellular activities induced by aromatase inhibitors and pregnane X receptor (PXR) agonists, and differentiate distinctive mechanisms leading to HepG2 cytotoxicity. Virtual screening by DTox revealed that compounds with predicted cytotoxicity are at higher risk for clinical hepatic phenotypes. In summary, DTox provides a framework for deciphering cellular mechanisms of toxicity in silico.

Keywords: deep learning; drug toxicity; model interpretation; molecular toxicology.


Conflict of interest statement

J.H.M. is a member of the advisory board of Patterns.

Figures

None
Graphical abstract
Figure 1
Figure 1
Modeling compound response to toxicity assay with DTox For toxicity prediction, the chemical structure of a compound is quantified using MACCS fingerprint before being converted to target profile by our previously developed method, TargetTox. The target profile is then fed into a VNN, whose structure is guided by Reactome pathway hierarchy. Specific pathways and biological processes are coded as hidden modules with a series of neurons. For model interpretation, the network output is propagated backward onto each neuron as relevance score using the layer-wise relevance propagation technique. A permutation-based strategy is then employed to identify the VNN paths of high relevance. Each path connects a compound to its toxicity outcome via the target protein, specific pathways, and biological process.
Figure 2
Figure 2
Prediction of compound response to 15 toxicity assays (A) Heatmap showing the training performance of VNN built under different combinations of root biological processes (shown as upset plot at the bottom). To facilitate comparison, the model performance is normalized within each assay using Z-transform. The optimal combination for each assay is highlighted with a red star. The name of each assay is annotated on the left, with the name of the assay cell line included in parentheses. (B) Bar plot showing the validation performance in all 15 Tox21 datasets. The performance of DTox is compared against three other models: a multi-layer perceptron with the same number of hidden layers and neurons as DTox (MLP), random forest (RF), and gradient boosting (GB). Performance is measured by two metrics: area under ROC curve and balanced accuracy, with error bar showing the 95% confidence interval. AhR, aryl hydrocarbon receptor; AP-1, activator protein-1; ARE, antioxidant response element; AR-MDA, androgen receptor in MDA-kb2 AR-luc cell line; CAR, constitutive androstane receptor; ER-BG1, estrogen receptor in BG1 cell line, PR-BLA, progesterone receptor in PR-UAS-bla HEK293T cell line; PXR, pregnane X receptor; RAR, retinoid acid receptor; ROR, retinoid-related orphan receptor.
Figure 3
Figure 3
Validation of identified VNN paths by known mechanisms (A) Bar plots comparing the observed versus expected proportion of validated compounds in four nuclear receptor assays. The “ground truth” VNN path placed at the top represents the known mechanism of transcription activation by nuclear receptor. A compound is considered to be validated by the known mechanism if the ground truth path is identified by DTox. The expected proportion is computed by random sampling, with the histogram and fitted density curve showing the sampled distribution (95% confidence interval shown as error bar). (B) Line charts comparing the proportion of validated compounds (y axis) among models. Performance of DTox interpretation framework (DTox) is compared against two other methods: Read-across (RAx) with knowledge source from ComptoxAI or DrugBank, LIME with strict or lax threshold for target feature relevance. RAx models were implemented under five different thresholds of Tanimoto coefficient (TC; x axis). A compound is considered to be validated if it can be connected to the nuclear receptor of interest.
Figure 4
Figure 4
Validation of identified VNN paths by differential expression (A) A VNN path is considered to be differentially expressed (DE) if all pathways along the path are enriched for DE genes from the matched LINCS experiment. The validation analysis is performed for four assays (columns) in three different dose-time groups (rows), with each scatterplot comparing the observed versus expected proportion of DE paths for a single group. The observed proportion is computed with VNN paths identified for each compound, while the expected proportion is computed with all possible VNN paths. A Wilcoxon signed-rank test is employed to examine whether the average observed proportion of each group is significantly higher than the average expected proportion (p value and FDR shown at the bottom right). The diagonal is shown as black dashed line, with compounds in the upper triangle (observed > expected) shown in blue and compounds in the lower triangle (observed < expected) shown in gray. Compounds with the top five observed proportions in each group are annotated with their names. (B) Bar plot showing the DE VNN paths that are recurrently identified for at least five aromatase inhibitors. Each VNN path is named after its lowest-level pathway. Paths that contain the “transcriptional regulation by TP53” pathway are highlighted in salmon, while the remaining paths are colored in cyan.
Figure 5
Figure 5
In-depth analysis of HepG2 cytotoxicity using identified VNN paths (A) Established mechanisms for cell death in drug-induced liver injury. Reactome pathways relevant to the mechanisms are identified and used as reference for the analysis. (B and C) Survival plots comparing the pathway relevance scores among active (orange curve) versus inactive (gray curve) compounds of two mechanisms of action assays: caspase-3/7 induction (B) and disruption of the mitochondrial membrane potential (C). Comparisons are made for nine cell death-related pathways, with each plot showing the comparison for a single pathway. Red star at the top right denotes that the pathway is related to the respective mechanism of action. Log-rank test is employed to examine whether the two distributions in each plot are significantly different (FDR value shown at the bottom left). (D) Network diagram showing the simplified DTox structure connecting mifepristone (triangle node) to the HepG2 cytotoxicity (rectangle node) via pathway modules (round nodes). Pathways with relevance score > 0 are colored in purple, with the scale proportional to relevance scale. The VNN paths identified for mifepristone by DTox are shown in solid lines, while the rest are shown in dashed lines. (E and F) Heatmaps showing the enrichment of nine cell death-related pathways among compounds associated with 20 drug-induced liver injury phenotypes (E) and among compounds of 14 ATC classes (F). Cells are colored based on odds ratio. Fisher’s exact test is employed to examine the significance of enrichment (asterisk denotes FDR < 0.05). VOD/SOS, veno-occlusive disease and sinusoidal obstruction syndrome.
Figure 6
Figure 6
Application of predicted cytotoxicity score among DSSTox compounds (A) Boxplot showing the distribution of predicted HepG2 cytotoxicity scores among positive controls (leftmost box in red), 10 EPA chemical lists (boxes in light red), six DrugBank lists (boxes in light blue), and negative controls (rightmost box in blue). Mann-Whitney U test is employed to examine whether the cytotoxicity scores of each list exhibit no significant difference from the positive controls (red star above list name), or no significant difference from the negative controls (blue star above list name). (B) Boxplot on the right compares the predicted HepG2 cytotoxicity scores among drugs associated with clinical hepatic phenotypes (green box) versus negative controls (yellow box), while bar plot on the left shows the odds ratio between HepG2 cytotoxicity and each phenotype (95% confidence interval shown as error bar). Results for 10 phenotypes with odds ratio > 1 are shown in the plot. Mann-Whitney U test is employed to examine whether the drugs associated with each phenotype are predicted with higher cytotoxicity scores than the negative controls (red star next to the phenotype name denotes p < 0.05). See also Figure S8.

Similar articles

Cited by

References

    1. Richard A.M., Huang R., Waidyanatha S., Shinn P., Collins B.J., Thillainadarajah I., Grulke C.M., Williams A.J., Lougee R.R., Judson R.S., et al. The Tox21 10K compound library: collaborative chemistry advancing toxicology. Chem. Res. Toxicol. 2021;34:189–216. doi: 10.1021/acs.chemrestox.0c00264. - DOI - PMC - PubMed
    1. Kleinstreuer N.C., Yang J., Berg E.L., Knudsen T.B., Richard A.M., Martin M.T., Reif D.M., Judson R.S., Polokoff M., Dix D.J., et al. Phenotypic screening of the ToxCast chemical library to classify toxic and therapeutic mechanisms. Nat. Biotechnol. 2014;32:583–591. doi: 10.1038/nbt.2914. - DOI - PubMed
    1. Huang R., Xia M., Sakamuru S., Zhao J., Shahane S.A., Attene-Ramos M., Zhao T., Austin C.P., Simeonov A. Modelling the Tox21 10 K chemical profiles for in vivo toxicity prediction and mechanism characterization. Nat. Commun. 2016;7:10425. doi: 10.1038/ncomms10425. - DOI - PMC - PubMed
    1. Chan H.C.S., Shan H., Dahoun T., Vogel H., Yuan S. Advancing drug discovery via artificial intelligence. Trends Pharmacol. Sci. 2019;40:592–604. doi: 10.1016/j.tips.2019.06.004. - DOI - PubMed
    1. Hemmerich J., Ecker G.F. In silico toxicology: from structure–activity relationships towards deep learning and adverse outcome pathways. WIREs Comput. Mol. Sci. 2020;10:e1475. - PMC - PubMed