Meta-Analysis
. 2022 Jul-Sep;24(114):107-129.
doi: 10.4103/nah.nah_83_21.

Impact of Noise Exposure on Risk of Developing Stress-Related Health Effects Related to the Cardiovascular System: A Systematic Review and Meta-Analysis

Affiliations
Meta-Analysis

Impact of Noise Exposure on Risk of Developing Stress-Related Health Effects Related to the Cardiovascular System: A Systematic Review and Meta-Analysis

Kapeena Sivakumaran et al. Noise Health. 2022 Jul-Sep.

Abstract

Background: : Exposure to acute noise can cause an increase in biological stress reactions, which provides biological plausibility for a potential association between sustained noise exposure and stress-related health effects. However, the certainty in the evidence for an association between exposures to noise on short- and long-term biomarkers of stress has not been widely explored. The objective of this review was to evaluate the strength of evidence between noise exposure and changes in the biological parameters known to contribute to the development of stress-related adverse cardiovascular responses.

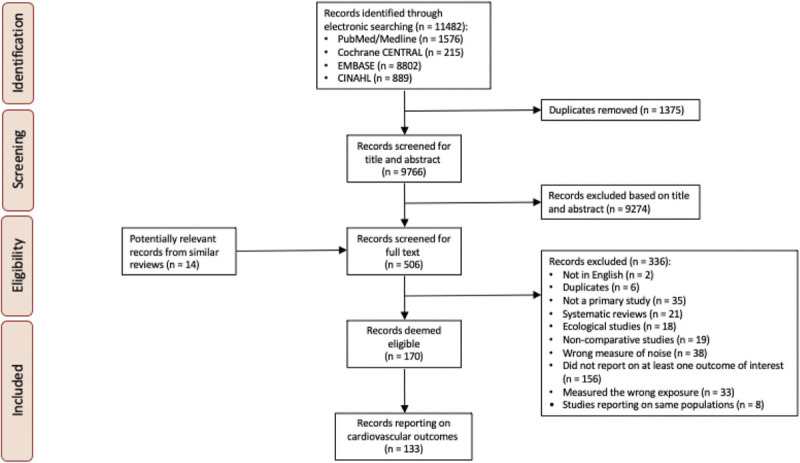
Materials and methods: This systematic review comprises English language comparative studies available in PubMed, Cochrane Central, EMBASE, and CINAHL databases from January 1, 1980 to December 29, 2021. Where possible, random-effects meta-analyses were used to examine the effect of noise exposure from various sources on stress-related cardiovascular biomarkers. The risk of bias of individual studies was assessed using the risk of bias of nonrandomized studies of exposures instrument. The certainty of the body of evidence for each outcome was assessed using the Grading of Recommendations Assessment, Development, and Evaluation approach.

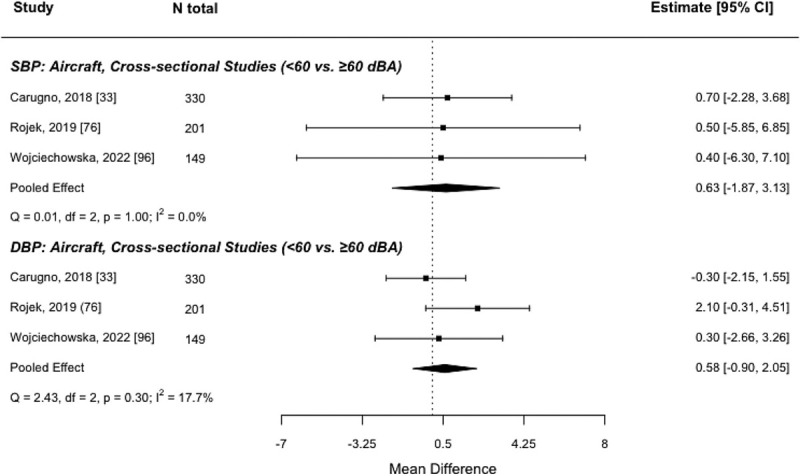
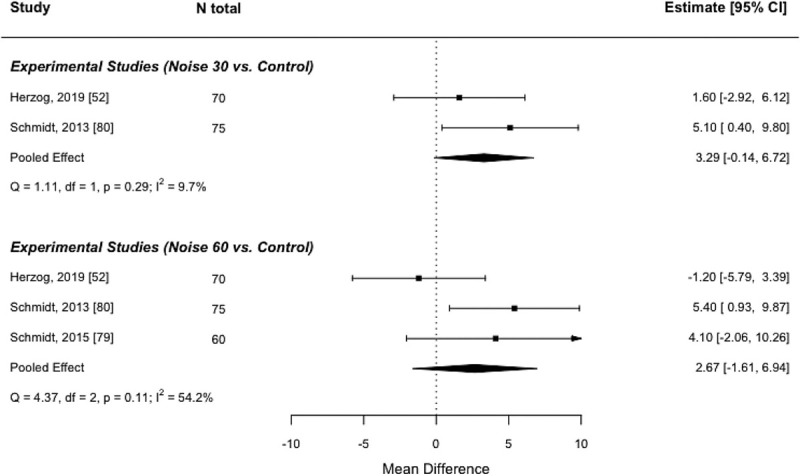
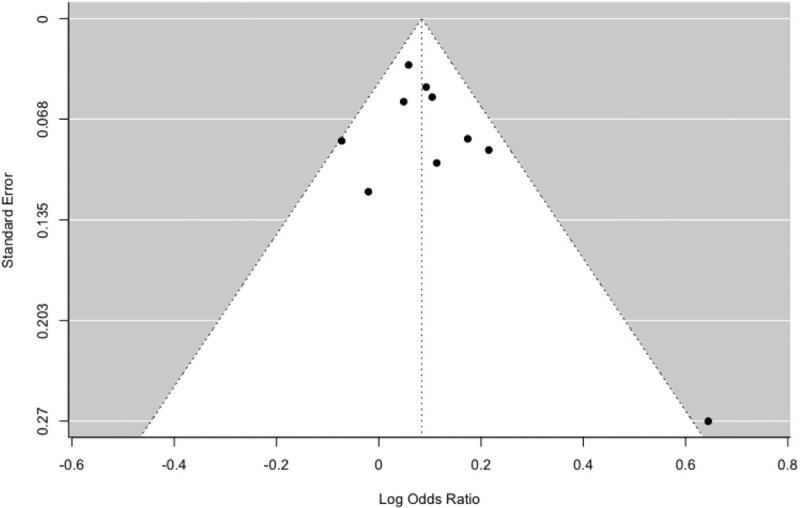
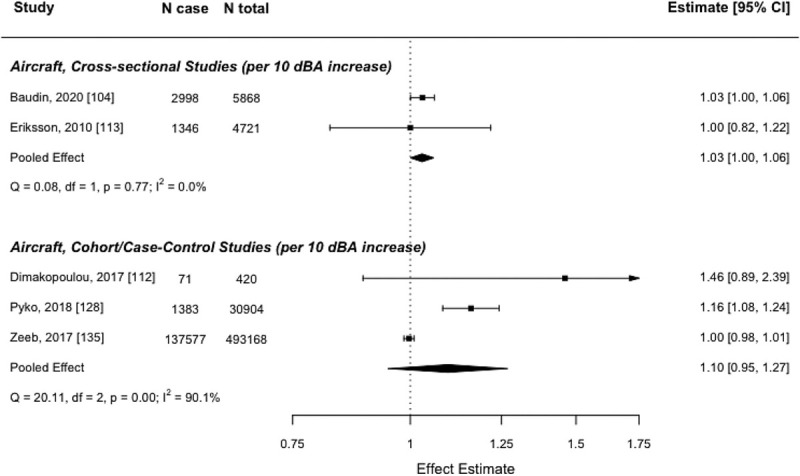
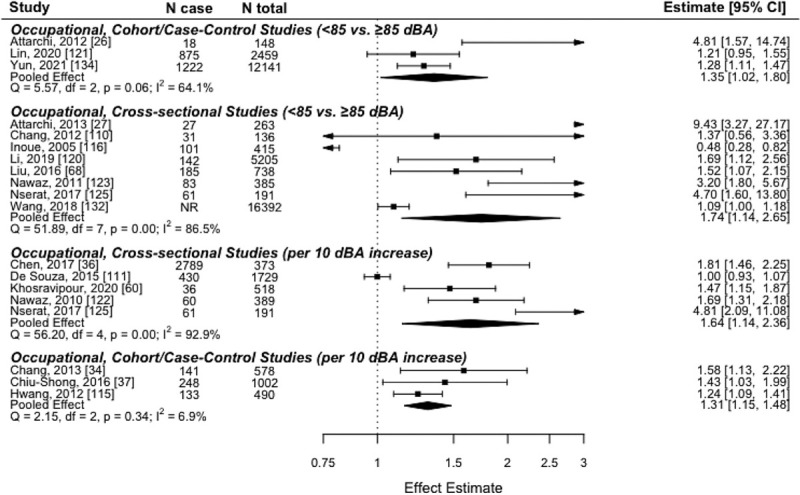
Results: : The search identified 133 primary studies reporting on blood pressure, hypertension, heart rate, cardiac arrhythmia, vascular resistance, and cardiac output. Meta-analyses of blood pressure, hypertension, and heart rate suggested there may be signals of increased risk in response to a higher noise threshold or incrementally higher levels of noise. Across all outcomes, the certainty of the evidence was very low due to concerns with the risk of bias, inconsistency across exposure sources, populations, and studies and imprecision in the estimates of effects.

Conclusions: : This review identifies that exposure to higher levels of noise may increase the risk of some short- and long-term cardiovascular events; however, the certainty of the evidence was very low. This likely represents the inability to compare across the totality of the evidence for each outcome, underscoring the value of continued research in this area. Findings from this review may be used to inform policies of noise reduction or mitigation interventions.

Keywords: Assessment; Cardiovascular; Development; Grading of Recommendations; and Evaluation; environmental noise; hemodynamics; sound; stress.


Conflict of interest statement

None

Figures

Figure 1
Figure 1
PRISMA flow diagram. PRISMA, Preferred Reporting Items for Systematic Reviews and Meta-Analyses
Figure 2
Figure 2
Forest plot of road traffic noise and mean difference in blood pressure (in mmHg) for cross-sectional studies (per 10 dBA increase in noise exposure). Note: pooled effect estimate presented as mean difference (MD) with lower and upper 95% confidence limits.
Figure 3
Figure 3
Forest plot of road traffic noise and mean difference in blood pressure (in mmHg) for cross-sectional studies among children/teenagers (<60 vs. ≥60 dBA or per 10 dBA increase). Note: pooled effect estimate presented as mean difference (MD) with lower and upper 95% confidence limits.
Figure 4
Figure 4
Forest plot of road traffic noise and mean difference in blood pressure (in mmHg) for cohort/case-control studies among children/teenagers (<60 vs. ≥60 dBA or per 10 dBA increase). Note: pooled effect estimate presented as mean difference (MD) with lower and upper 95% confidence limits.
Figure 5
Figure 5
Forest plot of aircraft noise and mean difference in blood pressure (in mmHg) for cross-sectional studies (<60 vs. ≥60 dBA). Note: pooled effect estimate presented as mean difference (MD) with lower and upper 95% confidence limits.
Figure 6
Figure 6
Forest plots of occupational noise and mean difference in blood pressure (in mmHg) for cross-sectional studies, for A) continuous measures (per 10 dBA increase) and B) categorized measures (<85 vs. ≥85 dBA or <70 vs. ≥70 dBA). Note: pooled effect estimate presented as mean difference (MD) with lower and upper 95% confidence limits.
Figure 7
Figure 7
Forest plots of occupational noise and mean difference in blood pressure (in mmHg) for cohort/case-control studies, for A) continuous measures (per 10 dBA increase) and B) categorized measures (<85 vs. ≥85 dBA or <80 vs. ≥80 dBA). Note: pooled effect estimate presented as mean difference (MD) with lower and upper 95% confidence limits.
Figure 8
Figure 8
Forest plot of lab-simulated noise and mean difference in blood pressure (in mmHg) for experimental studies (control vs. Noise 30 or Noise 60). Notes: pooled effect estimate presented as mean difference (MD) with lower and upper 95% confidence limits; Noise 30: playback of 30 aircraft noise events, Noise 60: playback of 60 aircraft noise events.
Figure 9
Figure 9
Forest plot of road noise and risk of hypertension (per 10 dBA increase). Note: pooled effect estimate presented as a relative risk (RR) with lower and upper 95% confidence limits.
Figure 10
Figure 10
Funnel plot of road noise and risk of hypertension for cross-sectional studies.
Figure 11
Figure 11
Forest plot of aircraft noise and risk of hypertension (per 10 dBA increase). Note: pooled effect estimate presented as a relative risk (RR) with lower and upper 95% confidence limits.
Figure 12
Figure 12
Funnel plot of aircraft noise and risk of hypertension for cross-sectional studies.
Figure 13
Figure 13
Forest plot of occupational noise and risk of hypertension (<85 vs ≥85 dBA or per 10 dBA increase). RR, relative risk. *Pooled effect estimate presented as RR with lower and upper 95% confidence limits.
Figure 14
Figure 14
Forest plot of railway noise and risk of hypertension (per 10 dBA increase). RR, relative risk. *Pooled effect estimate presented as RR with lower and upper 95% confidence limits.
Figure 15
Figure 15
Forest plot of various noise exposures and mean difference in heart rate (in bpm). MD, a mean difference. *Pooled effect estimate presented as MD with lower and upper 95% confidence limits.

References

    1. Anisman H. Stress and Your Health: From Vulnerability to Resilience. West Sussex: Wiley; 2015.
    1. McEwen BS, Wingfield JC. The concept of allostasis in biology and biomedicine. Horm Behav. 2003;43:2–15. - PubMed
    1. van Kempen E, Casas M, Pershagen G, Foraster M. WHO environmental noise guidelines for the European region: a systematic review on environmental noise and cardiovascular and etabolic effects: a summary. Int J Environ Res Public Health. 2018;15:379. - PMC - PubMed
    1. An R, Wang J, Ashrafi SA, Yang Y, Guan C. Chronic noise exposure and adiposity: a systematic review and meta-analysis. Am J Prev Med. 2018;55:403–11. - PubMed
    1. Wenning F, Chao W, Li Z, et al. Association between exposure to noise and risk of hypertension: a meta-analysis of observational epidemiological studies. J Hypertens. 2017;35:2358–66. - PubMed