. 2022 Sep 20:11:e74777.
doi: 10.7554/eLife.74777.

Diverse ancestry whole-genome sequencing association study identifies TBX5 and PTK7 as susceptibility genes for posterior urethral valves

Collaborators, Affiliations

Diverse ancestry whole-genome sequencing association study identifies TBX5 and PTK7 as susceptibility genes for posterior urethral valves

Melanie M Y Chan et al. Elife. .

Abstract

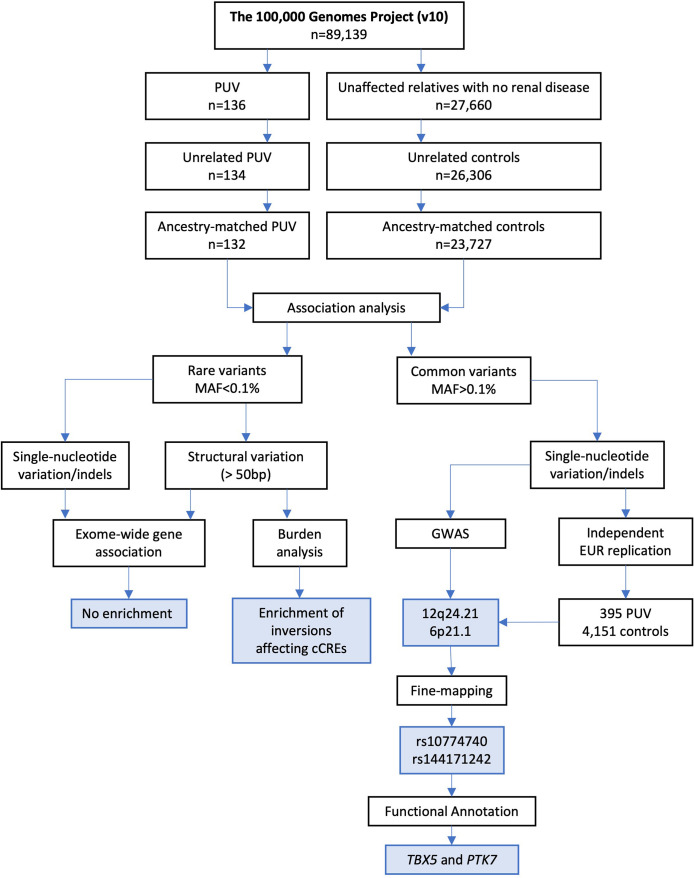
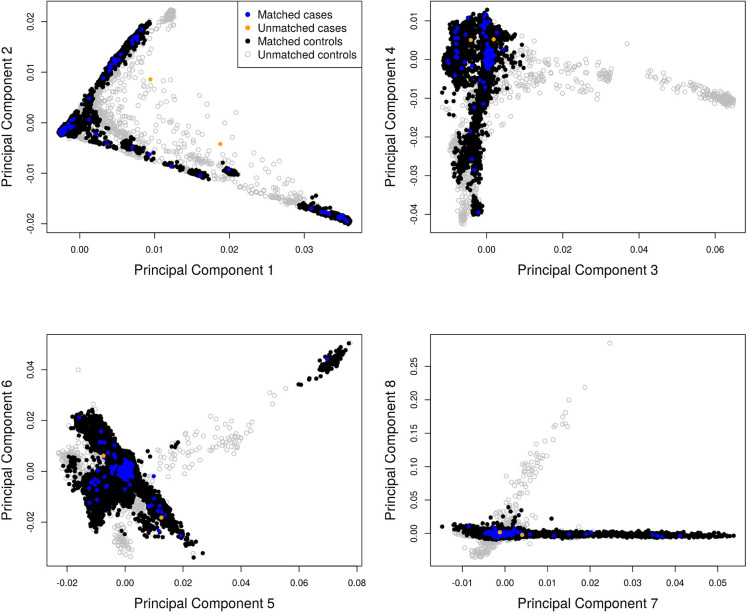
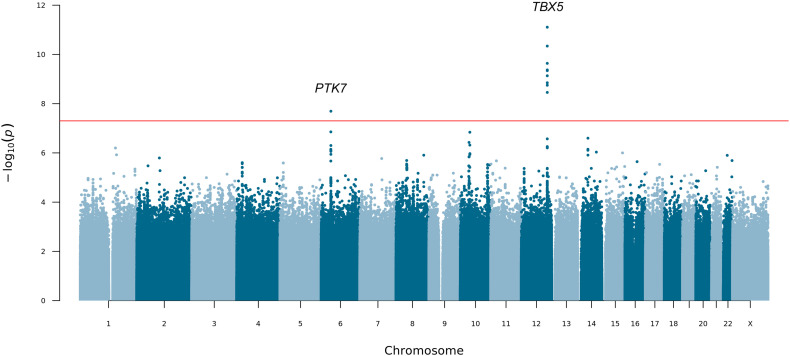
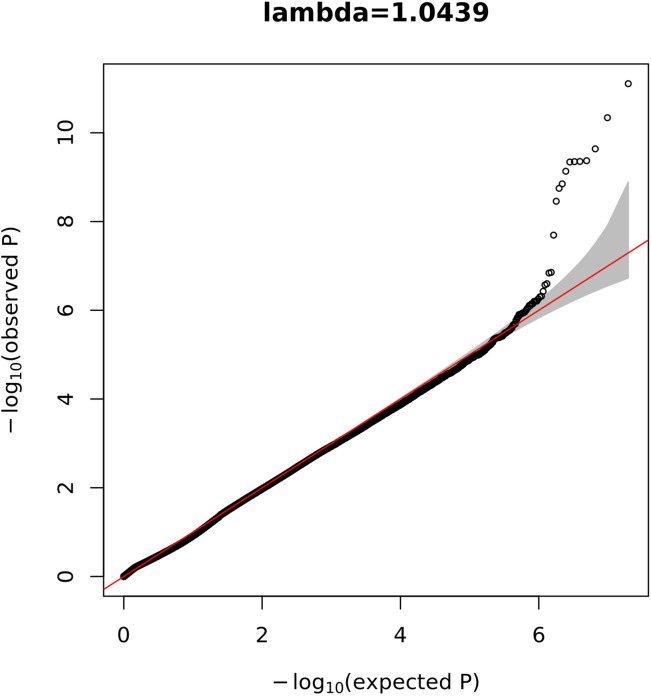
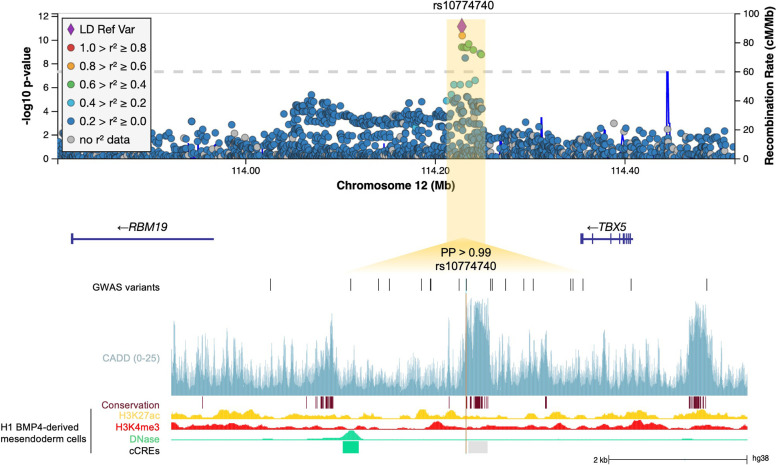
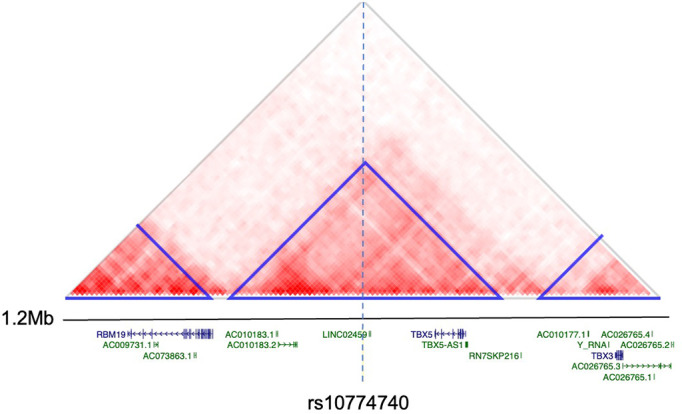
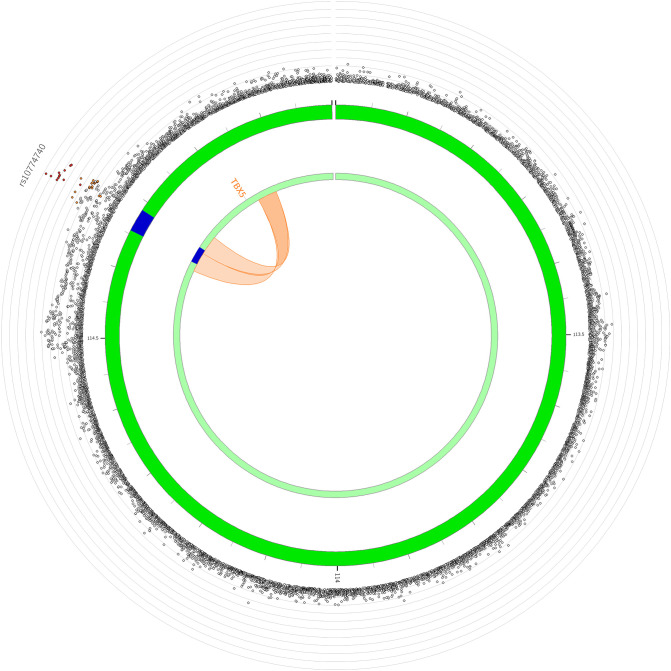
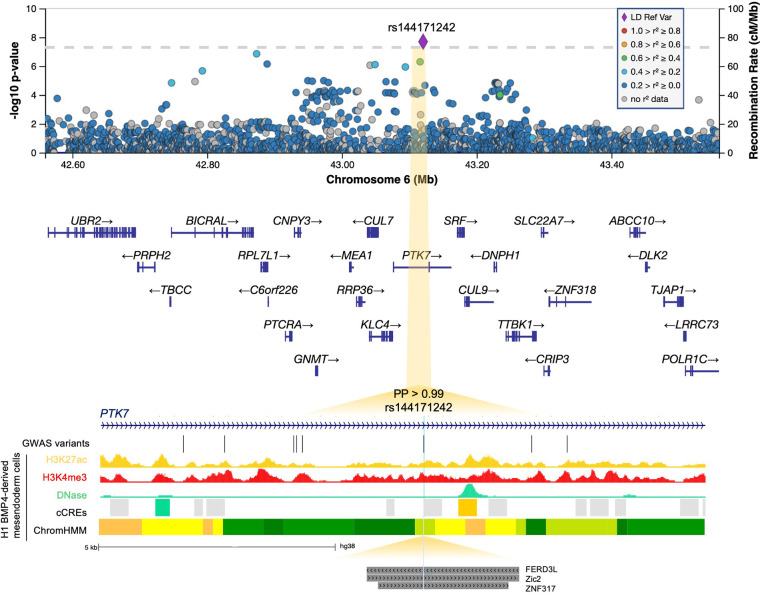
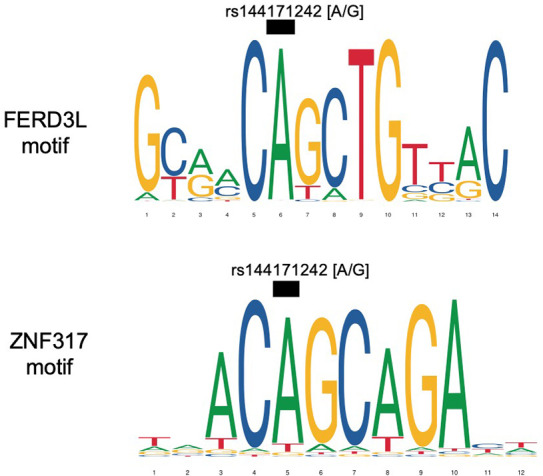
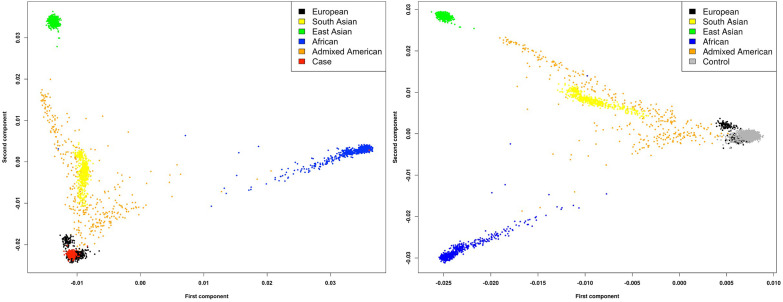
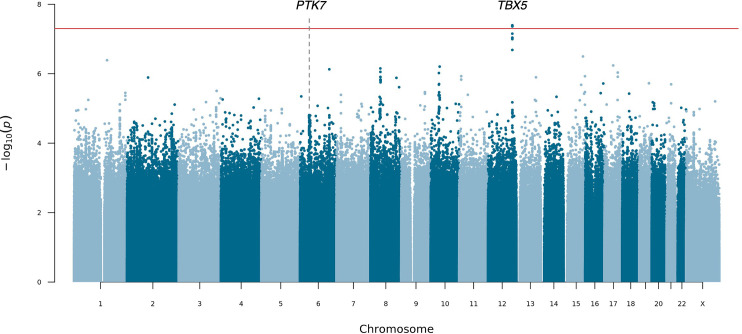
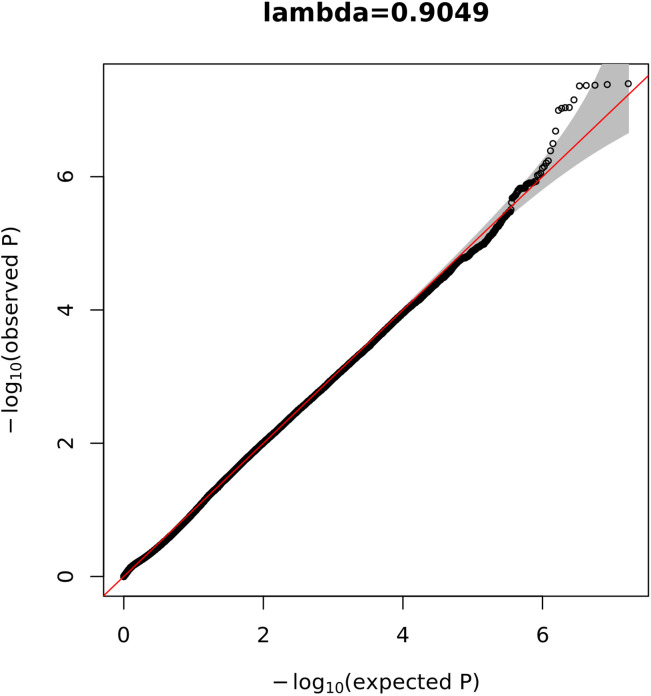
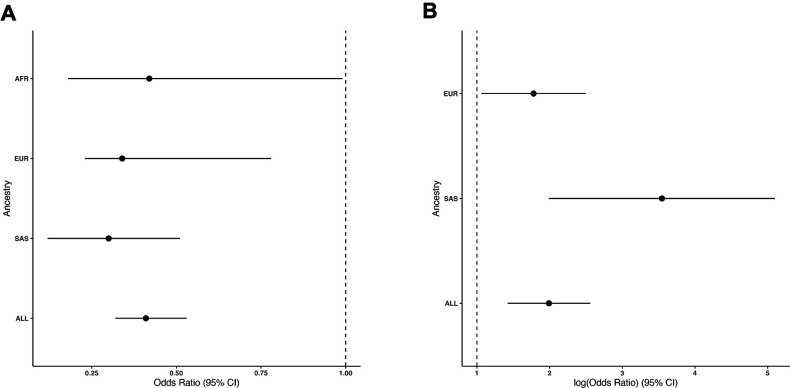
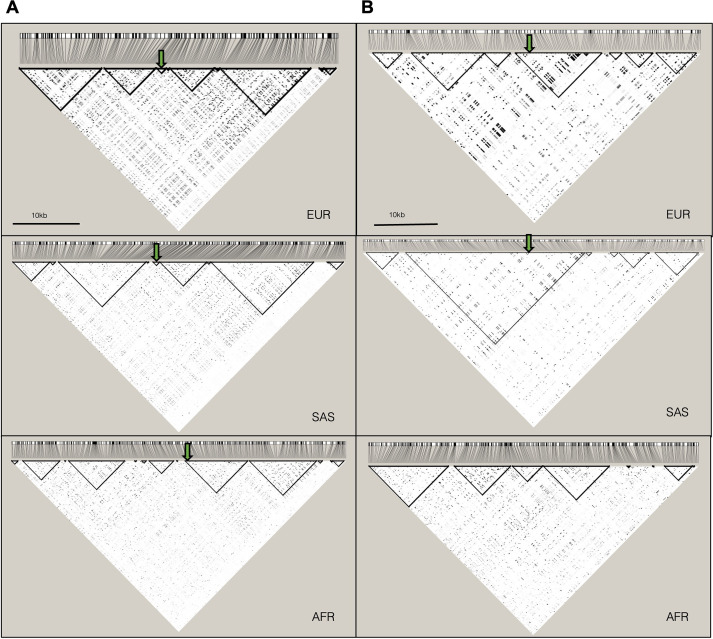
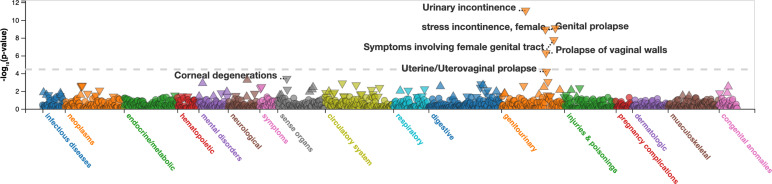
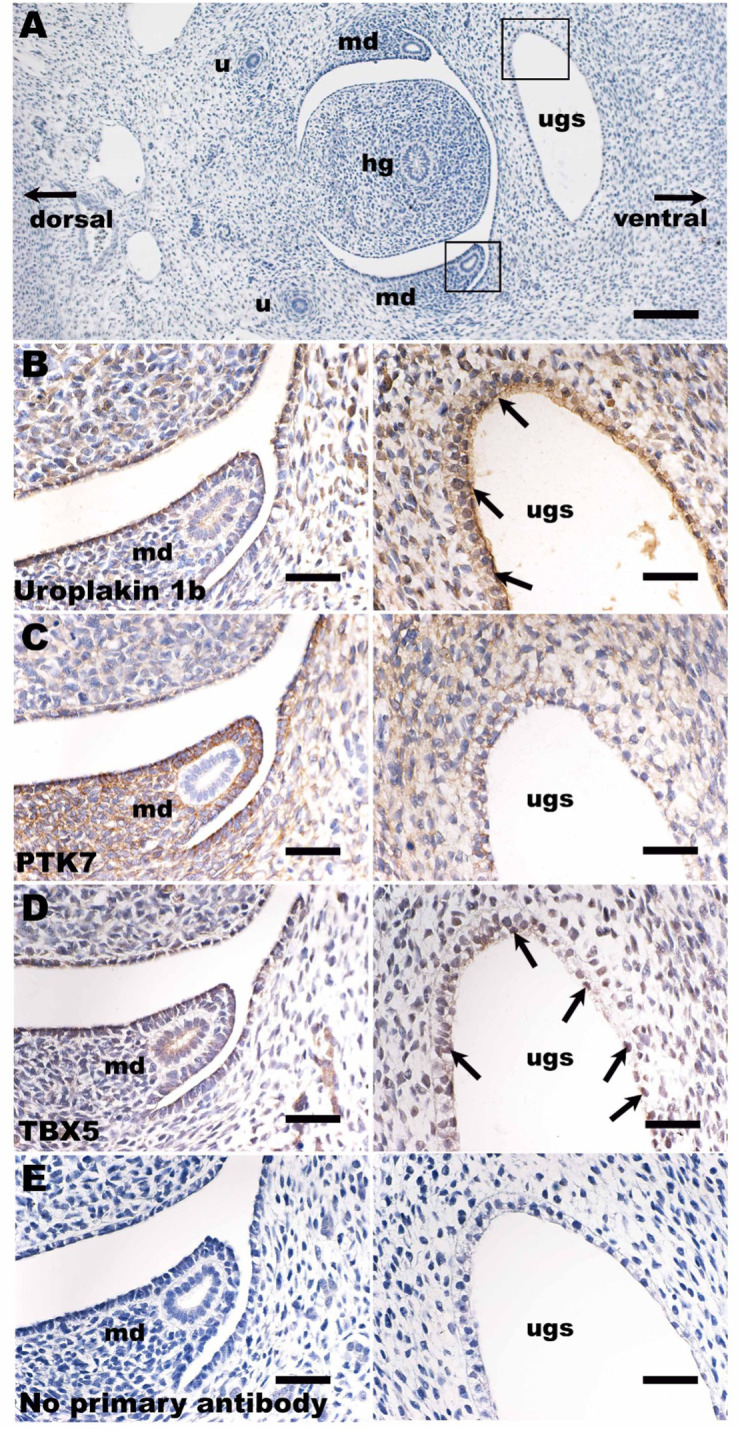
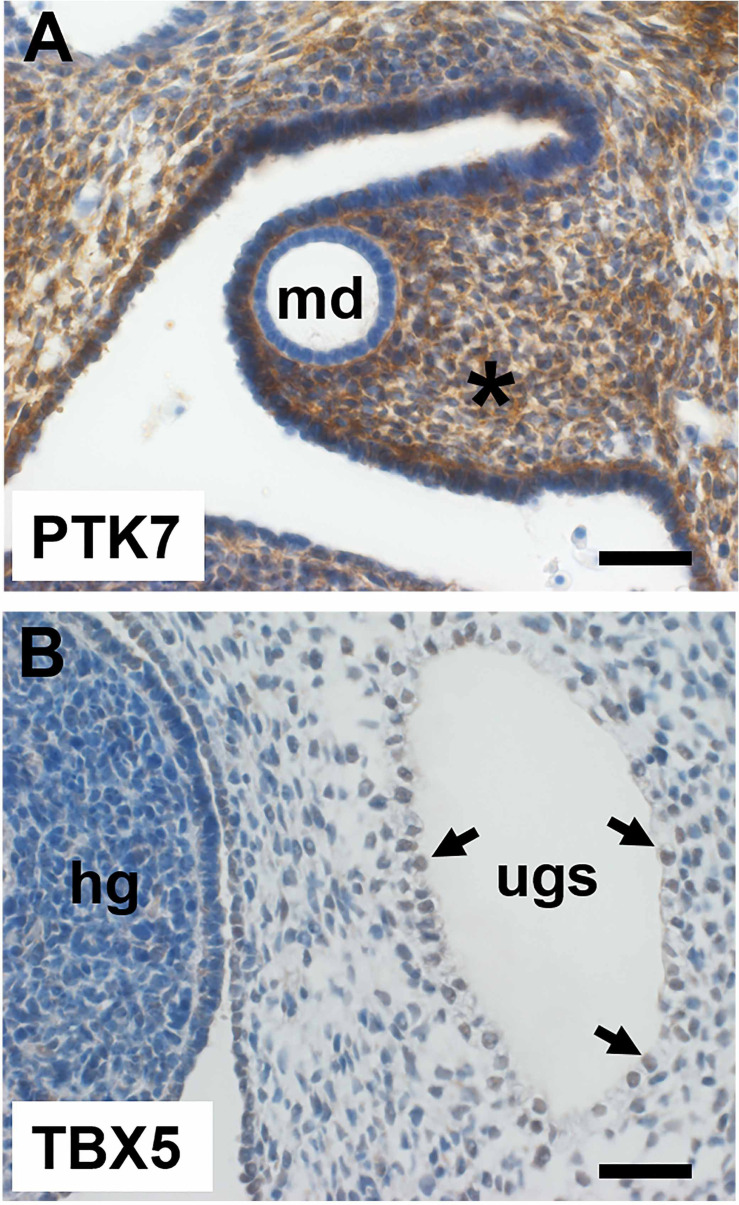
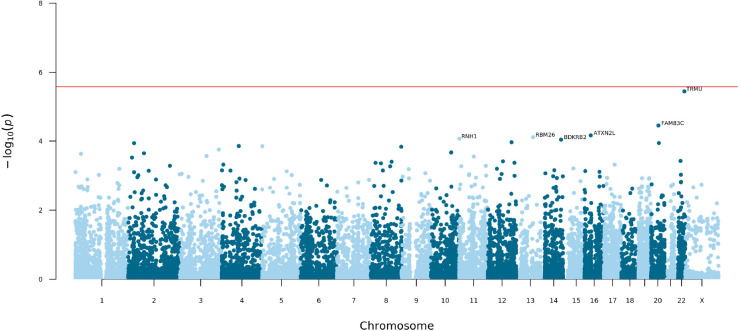
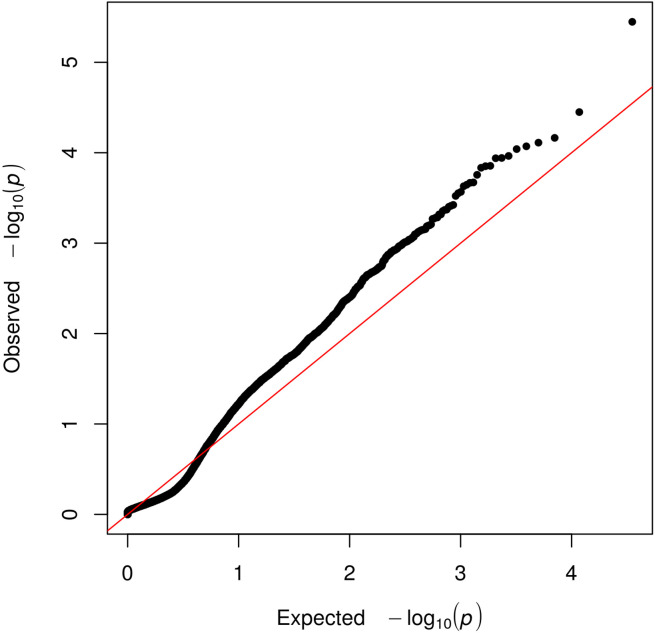
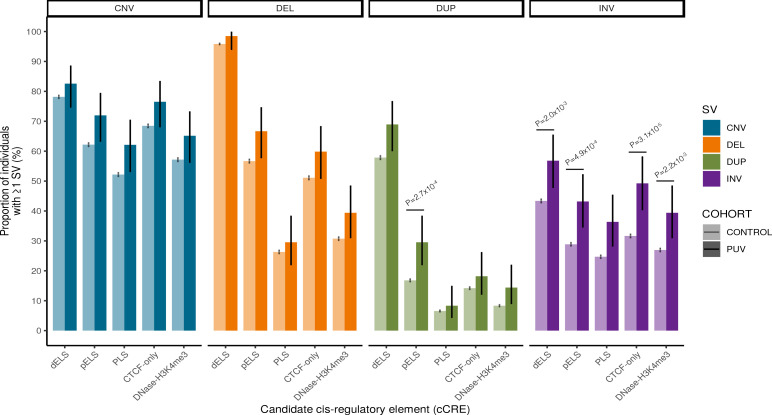
Posterior urethral valves (PUV) are the commonest cause of end-stage renal disease in children, but the genetic architecture of this rare disorder remains unknown. We performed a sequencing-based genome-wide association study (seqGWAS) in 132 unrelated male PUV cases and 23,727 controls of diverse ancestry, identifying statistically significant associations with common variants at 12q24.21 (p=7.8 × 10⁻¹²; OR 0.4) and rare variants at 6p21.1 (p=2.0 × 10⁻⁸; OR 7.2), that were replicated in an independent European cohort of 395 cases and 4151 controls. Fine mapping and functional genomic data mapped these loci to the transcription factor TBX5 and planar cell polarity gene PTK7, respectively, the encoded proteins of which were detected in the developing urinary tract of human embryos. We also observed enrichment of rare structural variation intersecting with candidate cis-regulatory elements, particularly inversions predicted to affect chromatin looping (p=3.1 × 10⁻⁵). These findings represent the first robust genetic associations of PUV, providing novel insights into the underlying biology of this poorly understood disorder and demonstrate how a diverse ancestry seqGWAS can be used for disease locus discovery in a rare disease.

Keywords: CAKUT; PUV; developmental biology; genetics; genome-wide association study; genomics; human; posterior urethral valves; seqGWAS; whole-genome sequencing.


Conflict of interest statement

MC, OS, FL, AH, HS, CV, GB, WN, MZ, SW, YH, JC, DW, CM, AS, AK, RK, AW, DB, AL, DG No competing interests declared

Figures

Figure 1.
Figure 1.. Study workflow.
The flowchart shows the number of samples included at each stage of filtering, the analytical strategies employed, and the main findings (blue boxes). PUV, posterior urethral valves; MAF, minor allele frequency; GWAS, genome-wide association study; EUR, European; cCRE, candidate cis-regulatory element.
Figure 1—figure supplement 1.
Figure 1—figure supplement 1.. Principal component analysis (PCA) showing the first eight principal components for matched cases (blue) and controls (black) and unmatched cases (orange) and controls (grey).
Two cases and 2579 controls were excluded from downstream analyses.
Figure 2.
Figure 2.. Manhattan plot for mixed-ancestry sequencing-based genome-wide association study (seqGWAS).
A genome-wide single-variant association study was carried out in 132 unrelated posterior urethral valves (PUV) cases and 23,727 controls for 19,651,224 variants with minor allele frequency (MAF) >0.1%. Chromosomal position (GRCh38) is denoted along the x axis and strength of association using a –log10(p) scale on the y axis. Each dot represents a variant. The red line indicates the Bonferroni adjusted threshold for genome-wide significance (p<5 × 10⁻⁸). The gene in closest proximity to the lead variant at significant loci is listed.
Figure 2—figure supplement 1.
Figure 2—figure supplement 1.. Quantile-quantile (Q–Q) plot for the mixed-ancestry genome-wide association study (GWAS) displaying the observed vs. the expected –log10(p) for each variant tested.
The grey shaded area represents the 95% confidence interval of the null distribution.
Figure 2—figure supplement 2.
Figure 2—figure supplement 2.. Power calculations for the mixed-ancestry genome-wide association study (GWAS) were performed at various minor allele frequencies (MAF) using 132 cases and 23,727 controls under an additive genetic model to achieve genome-wide significance of p<5 × 10⁻⁸.
Figure 3.
Figure 3.. 12q24.21.
Regional association plot with chromosomal position (GRCh38) denoted along the x axis and strength of association using a –log10(p) scale on the y axis. The lead variant (rs10774740) is represented by a purple diamond. Variants are coloured based on their linkage disequilibrium (LD) with the lead variant using 1000 Genomes data from all population groups. Functional annotation of the lead prioritized variant rs10774740 is shown, intersecting with CADD score (version 1.6), PhastCons conserved elements from 100 vertebrates, and ENCODE H3K27ac ChIP-seq, H3K4me3 ChIP-seq, and DNase-seq from mesendoderm cells. ENCODE cCREs active in mesendoderm are represented by shaded boxes; low DNase (grey), DNase-only (green). Genome-wide association study (GWAS) variants with p<0.05 are shown. Note that rs10774740 has a relatively high CADD score for a non-coding variant and intersects with a highly conserved region. PP, posterior probability derived using PAINTOR; cCRE, candidate cis-regulatory element.
Figure 3—figure supplement 1.
Figure 3—figure supplement 1.. Heatmap of Hi-C interactions from H1 BMP4-derived mesendoderm cells demonstrating that rs10774740 is located within the same topologically associating domain (TAD) as TBX5.
TADs are represented by blue triangles. Protein-coding genes are denoted in blue, non-coding genes in green.
Figure 3—figure supplement 2.
Figure 3—figure supplement 2.. Circos plot illustrating significant chromatin interactions between 12q24.21 and the promoter of TBX5.
The outer layer represents a Manhattan plot with variants plotted against strength of association. Only variants with p<0.05 are displayed. Genomic risk loci are highlighted in blue in the second layer. Significant chromatin loops detected in H1 BMP4-derived mesendoderm cultured cells are represented in orange.
Figure 4.
Figure 4.. 6p21.1.
Regional association plot with chromosomal position (GRCh38) along the x axis and strength of association using a –log10(p) scale on the y axis. The lead variant (rs144171242) is represented by a purple diamond. Variants are coloured based on their linkage disequilibrium (LD) with the lead variant using 1000 Genomes data from all population groups. Functional annotation of the lead prioritized variant rs144171242 is shown intersecting with ENCODE H3K27ac ChIP-seq, H3K4me3 ChIP-seq, and DNase-seq from mesendoderm cells. ENCODE cCREs active in mesendoderm are represented by shaded boxes; low DNase (grey), DNase-only (green), and distal enhancer-like (orange). ChromHMM illustrates predicted chromatin states using Roadmap Epigenomics imputed 25-state model for mesendoderm cells; active enhancer (orange), weak enhancer (yellow), strong transcription (green), transcribed and weak enhancer (lime green). Predicted transcription factor-binding sites (TFBS) from the JASPAR 2020 CORE collection (Fornes et al., 2020) are indicated by dark grey shaded boxes. Genome-wide association study (GWAS) variants with p<0.05 are shown. Note that rs144171242 intersects with both a predicted regulatory region and TFBS. PP, posterior probability derived using PAINTOR; cCREs, candidate cis-regulatory elements.
Figure 4—figure supplement 1.
Figure 4—figure supplement 1.. Sequence logos representing the DNA-binding motifs of transcription factors FERD3L and ZNF317.
The black boxes indicate where the risk allele [G] may disrupt binding.
Figure 5.
Figure 5.. Principal component analysis for the replication cohort.
Principal component analysis showing the first two principal components for a subset of cases (red) for whom genome-wide genotyping data was available (n=204), and the control (grey) cohort from 100,000 Genomes Project (100KGP) (n=4151) projected onto samples from the 1000 Genomes Project (Phase 3). Both cases and controls had confirmed European ancestry.
Figure 6.
Figure 6.. Manhattan plot for European sequencing-based genome-wide association study (seqGWAS).
A genome-wide single-variant association study was carried out in 88 cases and 17,993 controls for 16,938,500 variants with MAF ≥0.1%. All cases and controls had genetically determined European ancestry. Chromosomal position (GRCh38) is denoted along the x axis and strength of association using a –log10(p) scale on the y axis. Each dot represents a variant. The red line indicates the Bonferroni adjusted threshold for genome-wide significance (p<5 × 10⁻⁸). The gene in closest proximity to the lead variant at significant loci are listed.
Figure 6—figure supplement 1.
Figure 6—figure supplement 1.. Quantile-quantile (Q-Q) plot displaying the observed vs. the expected –log10(p) for each variant tested.
The grey shaded area represents the 95% confidence interval of the null distribution.
Figure 6—figure supplement 2.
Figure 6—figure supplement 2.. Comparison of (A) −log10(p) and (B) BETA from the diverse ancestry and European-only genome-wide association study (GWAS).
All variants with p<10–5 in both cohorts are shown. The shaded grey area represents the 95% confidence interval.
Figure 6—figure supplement 3.
Figure 6—figure supplement 3.. Ancestry-specific minor allele frequencies for (A) rs10774740 (T) at 12q24.21 and (B) rs144171242 (G) at 6p21.1.
Error bars represent 95% confidence intervals. The lead variant in (B) was not identified in individuals with African ancestry in this study. AFR, African ancestry (11 cases; 483 controls); EUR, European ancestry (89 cases; 17,993 controls); SAS, South Asian ancestry (18 cases; 2948 controls).
Figure 6—figure supplement 4.
Figure 6—figure supplement 4.. Forest plots demonstrating ancestry-specific odds ratios for (A) rs10774740 (T) and (B) rs144171242 (G).
Error bars represent 95% confidence intervals. The lead variant in (B) was not identified in individuals with African ancestry in this study. AFR, African ancestry (11 cases; 483 controls); EUR, European ancestry (89 cases; 17,993 controls); SAS, South Asian ancestry (18 cases; 2948 controls); ALL, mixed-ancestry cohort (132 cases; 23,727 controls).
Figure 6—figure supplement 5.
Figure 6—figure supplement 5.. Linkage disequilibrium (LD) plots for 503 European (EUR), 489 South Asian (SAS), and 661 African (AFR) ancestry individuals from the 1000 Genomes Project (Phase 3).
Haploview (version 4.2) was used to compute pairwise LD statistics (r2) between variants for each population. The darker the shading, the higher the LD between variants. Black outlined triangles indicate haploblocks. (A) LD plot for chr12:114,663,967–114,667,916 (GRCh37) with the position of the lead variant rs10774740 represented by a green arrow; (B) LD plot for chr6:43,084,099–43,092,650 (GRCh37) with the lead variant rs144171242 represented by a green arrow. rs144171242 was not seen in the AFR population group.
Figure 7.
Figure 7.. Manhattan plot of PheWAS for rs10774740 (T) at 12q24.21.
Plot downloaded from https://pheweb.org/UKB-SAIGE. The PheWAS was performed using imputed data from ~400,000 White British participants in the UK Biobank using SAIGE. The triangles indicate the direction of effect. The dashed grey line indicates a Bonferroni adjusted significance level of p< 3.6 x 10⁻⁵ (1403 phenotype codes).
Figure 8.
Figure 8.. Immunohistochemistry in human embryogenesis.
(A) Overview of transverse section of a normal human embryo 7 weeks after fertilization. The section has been stained with haematoxylin (blue nuclei). Boxes around the urogenital sinus and the mesonephric duct mark similar areas depicted under high power in (B–E). In (B–D), sections were reacted with primary antibodies, as indicated; in (E) the primary antibody was omitted. (B–E) were counterstained with haematoxylin. In (B–E), the left-hand frame shows the region around the mesonephric duct, while the right-hand frame shows one lateral horn of the urogenital sinus. (B) Uroplakin 1b immunostaining revealed positive signal (brown) in the apical aspect of epithelia lining the urogenital sinus (arrows, right frame), the precursor of the urinary bladder and proximal urethra. Uroplakin 1b was also detected in the flat monolayer of mesothelial cells (left frame) that line the body cavity above the mesonephric duct. (C) There were strong PTK7 signals (brown cytoplasmic staining) in stromal-like cells around the mesonephric duct (left frame), whereas the epithelia of the duct itself were negative. PTK7 was also detected in a reticular pattern in epithelia lining the urogenital sinus (right frame) and in stromal cells near the sinus. (D) A subset of epithelial cells lining the urogenital sinus (right frame) immunostained for TBX5 (brown nuclei; some are arrowed). The mesothelial cells near the mesonephric duct (left frame) were also positive for TBX5. (E) This negative control section had the primary antibody omitted; no specific (brown) signal was noted. Bar is 400 μm in (A), and bars are 100 μm in (B–E). ugs, urogenital sinus; md, mesonephric duct; hg, hindgut; u, ureter.
Figure 8—figure supplement 1.
Figure 8—figure supplement 1.. Immunohistochemistry of a second 7-week human embryo counterstained with haematoxylin.
(A) View of the mesonephric duct (the epithelial tube with md in its lumen). Note the prominent signal (brown) for PTK7 in the stromal cells surrounding the duct. (B) View of the urogenital sinus (ugs) with a subset of nuclei (three shown by arrows) in its monolayer epithelium that stain (light brown) for the transcription factor TBX5. The hindgut (hg) is nearby. Bars are 100 μm.
Figure 9.
Figure 9.. Manhattan plot of exome-wide rare coding variant analysis.
Chromosomal position (GRCh38) is shown on the x axis and strength of association using a –log10(p) scale on the y axis. Each dot represents a gene. The red line indicates the Bonferroni adjusted threshold for exome-wide significance (p=2.58 × 10⁻⁶). Genes with p<10–4 are labelled.
Figure 9—figure supplement 1.
Figure 9—figure supplement 1.. Quantile-quantile (Q-Q) plot displaying the observed vs. the expected –log10(p) for each gene tested.
The grey shaded area represents the 95% confidence interval of the null distribution.
Figure 10.
Figure 10.. Rare structural variant burden analysis.
The proportion of individuals with ≥1 rare autosomal structural variant intersecting with an ENCODE candidate cis-regulatory element (cCRE) in cases and controls was enumerated using a two-sided Fisher’s exact test. Note that inversions affecting cCRE are enriched in PUV. Vertical black bars indicate 95% confidence intervals. Unadjusted p-values shown are significant after correction for multiple testing (p<2.5 × 10⁻³). CNV, copy number variant; DEL, deletion; DUP, duplication; INV, inversion; PUV, posterior urethral valves; dELS, distal enhancer-like signature; pELS, proximal enhancer-like signature; PLS, promoter-like signature; cCRE, candidate cis-regulatory element.

Similar articles

  • Genome-wide association study in patients with posterior urethral valves.
    van der Zanden LFM, Maj C, Borisov O, van Rooij IALM, Quaedackers JSLT, Steffens M, Schierbaum L, Schneider S, Waffenschmidt L, Kiemeney LALM, de Wall LLL, Heilmann S, Hofmann A, Gehlen J, Schumacher J, Szczepanska M, Taranta-Janusz K, Kroll P, Krzemien G, Szmigielska A, Schreuder MF, Weber S, Zaniew M, Roeleveld N, Reutter H, Feitz WFJ, Hilger AC. van der Zanden LFM, et al. Front Pediatr. 2022 Sep 27;10:988374. doi: 10.3389/fped.2022.988374. eCollection 2022. Front Pediatr. 2022. PMID: 36238604 Free PMC article.
  • Rare copy number variants implicated in posterior urethral valves.
    Boghossian NS, Sicko RJ, Kay DM, Rigler SL, Caggana M, Tsai MY, Yeung EH, Pankratz N, Cole BR, Druschel CM, Romitti PA, Browne ML, Fan R, Liu A, Brody LC, Mills JL. Boghossian NS, et al. Am J Med Genet A. 2016 Mar;170(3):622-33. doi: 10.1002/ajmg.a.37493. Epub 2015 Dec 14. Am J Med Genet A. 2016. PMID: 26663319 Free PMC article.
  • Variants identified in PTK7 associated with neural tube defects.
    Lei Y, Kim SE, Chen Z, Cao X, Zhu H, Yang W, Shaw GM, Zheng Y, Zhang T, Wang HY, Finnell RH. Lei Y, et al. Mol Genet Genomic Med. 2019 Apr;7(4):e00584. doi: 10.1002/mgg3.584. Epub 2019 Jan 28. Mol Genet Genomic Med. 2019. PMID: 30689296 Free PMC article.
  • Identification of Genetic Susceptibility Loci for Colorectal Tumors in a Genome-Wide Meta-analysis.
    Peters U, Jiao S, Schumacher FR, Hutter CM, Aragaki AK, Baron JA, Berndt SI, Bézieau S, Brenner H, Butterbach K, Caan BJ, Campbell PT, Carlson CS, Casey G, Chan AT, Chang-Claude J, Chanock SJ, Chen LS, Coetzee GA, Coetzee SG, Conti DV, Curtis KR, Duggan D, Edwards T, Fuchs CS, Gallinger S, Giovannucci EL, Gogarten SM, Gruber SB, Haile RW, Harrison TA, Hayes RB, Henderson BE, Hoffmeister M, Hopper JL, Hudson TJ, Hunter DJ, Jackson RD, Jee SH, Jenkins MA, Jia WH, Kolonel LN, Kooperberg C, Küry S, Lacroix AZ, Laurie CC, Laurie CA, Le Marchand L, Lemire M, Levine D, Lindor NM, Liu Y, Ma J, Makar KW, Matsuo K, Newcomb PA, Potter JD, Prentice RL, Qu C, Rohan T, Rosse SA, Schoen RE, Seminara D, Shrubsole M, Shu XO, Slattery ML, Taverna D, Thibodeau SN, Ulrich CM, White E, Xiang Y, Zanke BW, Zeng YX, Zhang B, Zheng W, Hsu L; Colon Cancer Family Registry and the Genetics and Epidemiology of Colorectal Cancer Consortium. Peters U, et al. Gastroenterology. 2013 Apr;144(4):799-807.e24. doi: 10.1053/j.gastro.2012.12.020. Epub 2012 Dec 22. Gastroenterology. 2013. PMID: 23266556 Free PMC article. Review.
  • External validation and reliability assessment of posterior urethral morphology on initial voiding cystourethrogram as a predictor for infants with posterior urethral valves.
    Khondker A, Chelliahpillai Y, Machado M, Kaab A, Richter J, Kim JK, Chua M, Dos Santos J, Rickard M, Lorenzo AJ. Khondker A, et al. J Pediatr Urol. 2024 Apr;20(2):253.e1-253.e6. doi: 10.1016/j.jpurol.2023.11.051. Epub 2023 Dec 1. J Pediatr Urol. 2024. PMID: 38129272 Review.

Cited by

References

    1. Auton A, Brooks LD, Durbin RM, Garrison EP, Kang HM, Korbel JO, Marchini JL, McCarthy S, McVean GA, Abecasis GR, 1000 Genomes Project Consortium A global reference for human genetic variation. Nature. 2015;526:68–74. doi: 10.1038/nature15393. - DOI - PMC - PubMed
    1. Basson CT, Bachinsky DR, Lin RC, Levi T, Elkins JA, Soults J, Grayzel D, Kroumpouzou E, Traill TA, Leblanc-Straceski J, Renault B, Kucherlapati R, Seidman JG, Seidman CE. Mutations in human tbx5 [corrected] cause limb and cardiac malformation in holt-oram syndrome. Nature Genetics. 1997;15:30–35. doi: 10.1038/ng0197-30. - DOI - PubMed
    1. Berger H, Wodarz A, Borchers A. PTK7 faces the wnt in development and disease. Frontiers in Cell and Developmental Biology. 2017;5:31. doi: 10.3389/fcell.2017.00031. - DOI - PMC - PubMed
    1. Berndt SI, Wang Z, Yeager M, Alavanja MC, Albanes D, Amundadottir L, Andriole G, Beane Freeman L, Campa D, Cancel-Tassin G, Canzian F, Cornu JN, Cussenot O, Diver WR, Gapstur SM, Grönberg H, Haiman CA, Henderson B, Hutchinson A, Hunter DJ, Key TJ, Kolb S, Koutros S, Kraft P, Le Marchand L, Lindström S, Machiela MJ, Ostrander EA, Riboli E, Schumacher F, Siddiq A, Stanford JL, Stevens VL, Travis RC, Tsilidis KK, Virtamo J, Weinstein S, Wilkund F, Xu J, Lilly Zheng S, Yu K, Wheeler W, Zhang H, Sampson J, Black A, Jacobs K, Hoover RN, Tucker M, Chanock SJ, African Ancestry Prostate Cancer GWAS Consortium Two susceptibility loci identified for prostate cancer aggressiveness. Nature Communications. 2015;6:6889. doi: 10.1038/ncomms7889. - DOI - PMC - PubMed
    1. Boghossian NS, Sicko RJ, Kay DM, Rigler SL, Caggana M, Tsai MY, Yeung EH, Pankratz N, Cole BR, Druschel CM, Romitti PA, Browne ML, Fan R, Liu A, Brody LC, Mills JL. Rare copy number variants implicated in posterior urethral valves. American Journal of Medical Genetics Part A. 2016;170:622–633. doi: 10.1002/ajmg.a.37493. - DOI - PMC - PubMed

Associated data