. 2022 Sep 23;50(17):9814-9837.
doi: 10.1093/nar/gkac747.

EWS/FLI mediated reprogramming of 3D chromatin promotes an altered transcriptional state in Ewing sarcoma

Affiliations

EWS/FLI mediated reprogramming of 3D chromatin promotes an altered transcriptional state in Ewing sarcoma

Iftekhar A Showpnil et al. Nucleic Acids Res. .

Abstract

Ewing sarcoma is a prototypical fusion transcription factor-associated pediatric cancer that expresses EWS/FLI or a highly related FET/ETS chimera. EWS/FLI dysregulates transcription to induce and maintain sarcomagenesis, but the mechanisms utilized are not fully understood. We therefore sought to define the global effects of EWS/FLI on chromatin conformation and transcription in Ewing sarcoma cells using a well-validated 'knock-down/rescue' model of EWS/FLI function in combination with next generation sequencing assays to evaluate how the chromatin landscape changes with loss, and recovery, of EWS/FLI expression. We found that EWS/FLI (and EWS/ERG) genomic localization is largely conserved across multiple patient-derived Ewing sarcoma cell lines. This EWS/FLI binding signature is associated with establishment of topologically-associated domain (TAD) boundaries, compartment activation, enhancer-promoter looping that involve both intra- and inter-TAD interactions, and gene activation. In addition, EWS/FLI co-localizes with the loop-extrusion factor cohesin to promote chromatin loops and TAD boundaries. Importantly, local chromatin features provide the basis for transcriptional heterogeneity in regulation of direct EWS/FLI target genes across different Ewing sarcoma cell lines. These data demonstrate a key role of EWS/FLI in mediating genome-wide changes in chromatin configuration and support the notion that fusion transcription factors serve as master regulators of three-dimensional reprogramming of chromatin.


Figures

Graphical Abstract
Graphical Abstract
Schematic depicting reorganization of chromatin and changes to gene expression by EWS/FLI in Ewing sarcoma.
Figure 1.
Figure 1.
EWS/FLI reprograms the global interaction profile in Ewing sarcoma. (A) Multidimensional scaling (MDS) plot of top 1000 interactions (1 mb resolution) in each Hi-C replicate. (B) Genome-wide interaction frequency over interaction distance (bp) calculated for each 1 kb region in EF-Endo, EF-KD and EF-Rescue A673 cells. (C) Volcano plot showing differential interactions (DI) detected at 1mb resolution for EF-Endo versus EF-KD A673 cells using diffHiC R package. DI, FDR < 0.05 and |fold change (FC)| > 4. See also Supplementary Figure S2C. (D) Percent DIs gained (FDR < 0.05 & FC > 4) or lost (FDR < 0.05 & FC < –4) at 1mb resolution. (E) Violin plots of interaction distance (bp) for DIs (EF-Endo versus EF-KD). **** P value < 0.0001 (Unpaired t-test with Welch's correction). See also Supplementary Figure S2D and Table S23. (F) Example of lost and gained interactions (EF-Endo versus EF-KD) spanning a 59.7 mb region in chromosome 7. 1 mb loop anchors are depicted by horizontal bars at the ends of each loop. Stable interactions not shown. See also Supplementary Figure S2E.
Figure 2.
Figure 2.
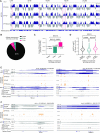
Alterations in compartment structure associate highly with enhancer landscape and gene expression changes. (A) Hi-C compartment profiles (PC1 values) for chromosome 2 show active (A, blue) and inactive (B, gray) compartments in EF-Endo, EF-KD and EF-Rescue. Highlighted regions show compartment alterations in EF-KD compared to EF-Endo and EF-Rescue. See also Supplementary Figure S3A. (B) Pie chart showing percentage of the genome undergoing compartment shifting in EF-Endo versus EF-KD. ΔPC1 = EF-Endo PC1 – EF-KD PC1. A-like shift, ΔPC1 ≥ 0.4; B-like shift, ΔPC1 ≤ –0.4. See also Supplementary Figure S3B. (C) Average log2 fold-change (log2FC) of gene expression at shifting compartments (EF-Endo versus EF-KD). Mean ± SEM shown. ****P value < 0.0001 (Games–Howell's multiple comparisons test). See also Supplementary Figure S3C and Table S19. (D) Violin plots showing log2FC enrichment of H3K27Ac at shifting compartments for EF-Endo versus EF-KD. ****P value < 0.0001 (Tukey's multiple comparisons test). Differential H3K27Ac binding analysis was performed using DiffBind and DeSeq2 R packages. See also Supplementary Figure S3D and Table S20. (E, F) Integrative genomics viewer (IGV) traces showing examples of compartment (E) activation (positive ΔPC1) and (F) inactivation (negative ΔPC1) in EF-Endo and EF-Rescue compared to EF-KD. Corresponding compartment profiles (PC1), enhancers (enhancer calls and H3K27Ac levels) and gene expression (RNA-seq) are also shown.
Figure 3.
Figure 3.
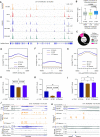
EWS/FLI promotes active compartmentalization of chromatin at GGAA-μsats. (A) Representative example of EWS/FLI and EWS/ERG localization in 5 Ewing sarcoma cell lines (TTC-466, A673, TC71, SK-N-MC and EWS-502) over a 157 kb region of chromosome 19. Tracks represent log2 ratio of EWS/FLI or EWS/ERG versus IgG signal. (B) Boxplots showing EWS/FLI enrichment in A673 cells at differential enhancer regions in EF-Endo versus EF-KD. ****P value < 0.0001 (Tukey's multiple comparisons test). See also Supplementary Figures S5A, S5B and Table S10. (C) Doughnut chart showing proportion of EWS/FLI occupancy in A673 cells at shifting compartment regions between EF-Endo and EF-KD. See also Supplementary Figure S5C. (D, F, H) Plots of average PC1 values within 50 kb of EWS/FLI binding sites in EF-Endo, EF-KD, and EF-Rescue. (D) All conserved EWS/FLI binding sites in A673 cells. (F) EWS/FLI GGAA-μsat binding sites. (H) EWS/FLI non-μsat binding sites. (E, G, I) Bar charts showing average PC1 values in EF-Endo, EF-KD and EF-Rescue for 20kb regions overlapping EWS/FLI peaks. (E) All conserved EWS/FLI binding sites in A673. (G) GGAA-μsat binding sites. (I) Non-μsat binding sites. Mean ± SEM shown. **** P value < 0.0001 (Tukey's multiple comparisons test). See also Supplementary Table S21. (J, K) IGV traces showing EWS/FLI binding in A673 cells with corresponding compartment profiles, H3K27Ac levels, enhancer calls, and gene expression in EF-Endo, EF-KD and EF-Rescue. (J) Compartment activation and (K) Compartment inactivation in EF-Endo and EF-Rescue compared to EF-KD. See also Supplementary Figures S5D and S5E.
Figure 4.
Figure 4.
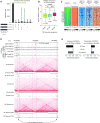
EWS/FLI perturbs TAD boundaries. (A) UpSet plot showing overlap of TAD boundaries in EF-Endo, EF-KD and EF-Rescue. TAD boundaries were identified as 20kb regions that allow minimal contact between upstream and downstream regions compared to its neighboring regions (P value < 0.05). (B) Boxplots showing EWS/FLI enrichment at EF-KD, EF-WT and stable boundaries in A673. **** P value < 0.0001, ** P value < 0.01 (Tukey's multiple comparisons test).See also Supplementary Table S22. (C) Heatmap and profile plots showing localization of EWS/FLI, CTCF and cohesin subunits (SMC1A and Rad21) at EWS/FLI binding sites near EF-WT boundaries. (D) Example of EF-WT (dashed orange box) and stable boundaries (dashed black boxes) over a 1.4 mb region in chromosome 2. Heatmaps show Hi-C interactions for EF-Endo, EF-KD and EF-Rescue. Intensity of red spots correspond to contact frequency. TAD calls are depicted using maroon horizontal bars where a break corresponds to a TAD boundary. EWS/FLI, CTCF, and cohesin (SMC1A and Rad21) localization are also shown. See also Supplementary Figures S7A and S7B. (E) Directionality statistic (DS) calculated for 20 kb upstream (right panel) and downstream (left panel) of EWS/FLI binding site (orange dashed box) in EF-Endo, EF-KD and EF-Rescue using diffHiC R package. Positive and negative signs reflect the preference for downstream and upstream interactions of the target bin. The absolute value of DS reflects the magnitude of interaction directionality. See also Supplementary Figures S7C and S7D.
Figure 5.
Figure 5.
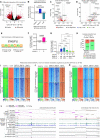
EWS/FLI mediates chromatin looping. (A) Volcano plot of differential interactions (DI) identified at 20 kb resolution in EF-Endo versus EF-KD A673 cells using diffHiC. DI, FDR < 0.05 and |fold change| > 4. See also Supplementary Figure S8A. (B) Average logFC enrichment of all 20 kb loops at differential enhancers for EF-Endo versus EF-KD. Mean ± SEM are shown. **** P value < 0.0001 (Tukey's multiple comparisons test). See also Supplementary Figures S5A, S8B and Table S26. (C, D) Volcano plots of differential gene expression for genes mapping to anchors of (C) lost (FDR < 0.05 & fold change < –4) and (D) gained (FDR < 0.05 and fold change > 4) interactions at 20 kb resolution in EF-Endo versus EF-KD. Significantly altered genes (red dots): Adjusted P value (P-adj) < 0.05 and |fold change (FC)| > 1.25. See also Supplementary Figure S8C and D. (E) Top motif enriched at anchors of gained interactions at 20 kb resolution for EF-Endo and EF-Rescue compared to EF-KD. P values for enriched motifs were identified by comparing to matched, randomized background regions using Homer motif analysis. (F) Average logFC enrichment of all interactions at 20 kb resolution in EF-Endo versus EF-KD associated with an EWS/FLI binding site (+) or no EWS/FLI binding site (–). Mean ± SEM shown. **** P value < 0.0001 (unpaired t-test). See also Supplementary Figure S8E and Table S24. (G) Average logFC (EF-Endo versus EF-KD) enrichment of interactions at 20kb resolution associated with the type of EWS/FLI binding site at each loop anchor. EFBS = EWS/FLI binding site, a1 = first anchor of a loop, a2 = second anchor of a loop, MS = GGAA-μsat bound EWS/FLI, NMS = non-μsat bound EWS/FLI. Mean ± SEM shown. **** P value < 0.0001 (Games-Howell's multiple comparisons test). See also Supplementary Figure S8F and Table S25. (H) Bar chart showing proportion of EWS/FLI bound inter- and intra-TAD gained loops in categories i and ii (MS/MS and MS/NMS) at 20 kb resolution (EF-Endo versus EF-KD) compared to control set of loops randomly picked from all interactions at 20 kb resolution. One-sample proportion test used to test for equal proportions of inter-TAD loops in categories i & ii versus the control set of loops. See also Supplementary Figure S8G. (I, J, K) Heatmaps showing localization of EWS/FLI, CTCF and cohesin subunits (SMC1A and Rad21) at (I) conserved EWS/FLI binding sites, (J) CTCF binding sites and (K) SMC1A binding sites near gained loop anchors (EF-Endo versus EF-KD). See also Supplementary Figure S9. (L) Examples of inter-TAD (tan) and intra-TAD (purple) gained interactions at 20 kb resolution. Corresponding TAD calls (black bars), conserved EWS/FLI localization, CTCF localization and cohesin (SMC1A and Rad21) localization shown. All ChIP-sequencing tracks are accompanied by their corresponding input tracks. See also Supplementary Figure S10.
Figure 6.
Figure 6.
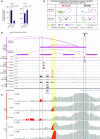
EWS/FLI mediated gained loops associate with longer length GGAA-μsats. (A) Bar charts showing proportion of gained and lost interactions (EF-Endo versus EF-KD) at 20 kb resolution mapping to number of total GGAA motifs (sequence between two GGAA motifs ≤ 20 bp). See also Supplementary Figure S11E. (B) Bar charts showing proportion of gained and lost interactions (EF-Endo versus EF-KD) at 20kb resolution mapping to number of consecutive GGAA motifs (sequence between two GGAA motifs = 0 bp). See also Supplementary Figure S11F. (C, D) Examples showing (C) gained (purple) and (D) lost (blue) loops in EF-Endo versus EF-KD and EF-Rescue versus EF-KD. Corresponding EWS/FLI localization (CUT&Tag) in A673, enhancers, compartment profiles (PC1) and gene expression (RNA-seq) in EF-Endo, EF-KD and EF-Rescue are also shown. See also Supplementary Figure S12A and B.
Figure 7.
Figure 7.
Cell-specific local chromatin structure affects gene regulation. (A) Normalized NKX2-2 expression counts from differential gene expression analysis in A673 and TC71 EF-Endo versus EF-KD cells. Significant, adjusted P value (P-adj) < 0.05. (B, C) Regulation of NKX2-2 by EWS/FLI in A673 compared to TC71. (B) IGV images showing gained loops at 20 kb resolution for EF-Endo versus EF-KD and EF-Rescue versus EF-KD in A673 (purple). CUT&Tag data showing EWS/FLI and CTCF occupancy at the NKX2-2 locus in A673 and TC71. RNA sequencing traces show gene expression for EF-Endo, EF-KD and EF-Rescue in A673 and EF-Endo and EF-KD in TC71. (C) 4C data showing significant interactions (in red) (P value < 0.05) with the viewpoint (region of interest; RMS = right GGAA-μsat) in A673 and TC71. (D) Schematic showing altered local chromatin structure as a proposed mechanism of gene regulation heterogeneity in different Ewing sarcoma cell lines.

Similar articles

Cited by

References

    1. Sankar S., Lessnick S.L.. Promiscuous partnerships in Ewing's sarcoma. Cancer Genet. 2011; 204:351–365. - PMC - PubMed
    1. Delattre O., Zucman J., Plougastel B., Desmaze C., Melot T., Peter M., Kovar H., Joubert I., Jongt P.D., Rouleau G.et al. .. Gene fusion with an ETS DNA-binding domain caused by chromosome translocation in human tumours. Nature. 1992; 359:162–165. - PubMed
    1. Boone M.A., Taslim C., Crow J.C., Selich-Anderson J., Watson M., Heppner P., Hamill J., Wood A.C., Lessnick S.L., Winstanley M.. Identification of a novel FUS/ETV4 fusion and comparative analysis with other Ewing sarcoma fusion proteins. Mol. Cancer Res. 2021; 19:1795–1801. - PMC - PubMed
    1. Seth A., Watson D.K.. ETS transcription factors and their emerging roles in human cancer. Eur. J. Cancer. 2005; 41:2462–2478. - PubMed
    1. Schwartz J.C., Cech T.R., Parker R.R.. Biochemical properties and biological functions of FET proteins. Annu. Rev. Biochem. 2015; 84:355–379. - PMC - PubMed

Publication types

MeSH terms