. 2023 Apr 4;33(8):4498-4511.
doi: 10.1093/cercor/bhac357.

Spatial organization of neuron-astrocyte interactions in the somatosensory cortex

Affiliations

Spatial organization of neuron-astrocyte interactions in the somatosensory cortex

Andrés M Baraibar et al. Cereb Cortex. .

Abstract

Microcircuits in the neocortex are functionally organized along layers and columns, which are the fundamental modules of cortical information processing. While the function of cortical microcircuits has focused on neuronal elements, much less is known about the functional organization of astrocytes and their bidirectional interaction with neurons. Here, we show that Cannabinoid type 1 receptor (CB1R)-mediated astrocyte activation by neuron-released endocannabinoids elevate astrocyte Ca2+ levels, stimulate ATP/adenosine release as gliotransmitters, and transiently depress synaptic transmission in layer 5 pyramidal neurons at relatively distant synapses (˃20 μm) from the stimulated neuron. This astrocyte-mediated heteroneuronal synaptic depression occurred between pyramidal neurons within a cortical column and was absent in neurons belonging to adjacent cortical columns. Moreover, this form of heteroneuronal synaptic depression occurs between neurons located in particular layers, following a specific connectivity pattern that depends on a layer-specific neuron-to-astrocyte signaling. These results unravel the existence of astrocyte-mediated nonsynaptic communication between cortical neurons and that this communication is column- and layer-specific, which adds further complexity to the intercellular signaling processes in the neocortex.

Keywords: astrocyte; calcium imaging; cortex; neuron-astrocyte communication; synaptic transmission.


Figures

Fig. 1
Fig. 1
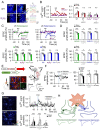
Endocannabinoid signaling induces homoneuronal and heteroneuronal synaptic depression in S1. A) Biocytin loading S1 cortex L5 pyramidal neurons image. B) Schematic drawing depicting double patch-recordings from L5 pyramidal neurons and the stimulating electrode in L2/3. C) Averaged EPSCs (n = 20 stimuli) before (control) and after ND in wild-type mice. D) EPSCs amplitude versus time before (basal) and after ND in control (green or blue) and in the presence of AM251 (2 μM; open gray) in the homoneuron (left) and heteroneuron (right) from layer 5. E) Relative changes in EPSC amplitude in control and with AM251 (2 μM). Two-tailed Student’s paired t-test. F) Representative infrared differential interference contrast image of the experimental configuration with the stimulation pipette in layer 4 and the homoneuronal and heteroneuronal neurons located in layer 4. G) EPSCs amplitude versus time before (basal) and after ND in the homoneuron (left, green) and heteroneuron (middle, blue) in the experimental conditions represented in panel f. Right: Relative changes in EPSC amplitude. H) Representative infrared differential interference contrast image of the experimental configuration with the stimulation pipette in L2/3 and the homoneuronal and heteroneuronal neurons located in L2/3. I) EPSCs amplitude versus time before (basal) and after ND in the homoneuron (left, green) and heteroneuron (middle, blue) in the experimental conditions represented in panel h. Right: Relative changes in EPSC amplitude. Two-tailed Student’s paired t-test. Data are expressed as mean ± SEM, *P < 0.05, **P < 0.01, ***P < 0.001.
Fig. 2
Fig. 2
Heteroneuronal, but not homoneuronal, synaptic depression requires endocannabinoid signaling in astrocytes. A) Viral vector injected into the S1 of CB1Rfl/fl mice and fluorescence image showing mCherry-Cre expression in the S1 cortex (top), and immunohistochemistry images showing co-localization between mCherry-cre and GFAP (bottom). B) EPSCs amplitude versus time before (basal) and after ND in CB1R mice injected with AAV8-GFAP-mCherry (aCB1R; green or blue) or with AAV8-GFAP-mCherry-Cre (aCB1R−/−; purple) in the homoneuron (left) and heteroneuron (right) from L5. C) Relative changes in EPSC amplitude in aCB1R and aCB1R−/− mice in the homoneuron (left) and heteroneuron (right). Two-tailed Student’s paired t-test. D) Viral vector injected into the S1 of CB1Rfl/fl mice, fluorescence image showing GCaMP6f expression in the S1 and pseudocolor images showing the fluorescence intensities of GCaMP6f-expressing astrocytes before and after WIN (300 μΜ) application in L5. E) Ca2+ event probability over time (left) and Ca2+ event probability before (basal) and after WIN application in aCB1R (black) and aCB1R−/− (purple) mice (right). Blue shadow indicates 5-s WIN application. Two-tailed Student’s paired t-test (before and after) and two-tailed Student’s unpaired t-test (between groups). F) Heat maps showing Ca2+-based fluorescence levels and raster plots showing Ca2+ events (i.e. when the ΔF/F0 increased at least 2 times the standard deviation of the baseline) recorded from all ROIs including astrocyte somas and processes in aCB1R (left) and aCB1R−/− (right) mice before and after WIN stimulation. Blue shadow indicates 5-s WIN application. Data are expressed as mean ± SEM, **P < 0.01, ***P < 0.001.
Fig. 3
Fig. 3
Heteroneuronal synaptic depression requires astrocyte Ca2+ signaling and activation of presynaptic A1 receptors. A) Left: Pseudocolor images showing the fluorescence intensities of GCaMP6f-expressing astrocytes in L5 of the S1 cortex before and after L5 ND in wild-type (top) and IP3R2−/− mice (bottom). Right: Representative Ca2+ traces of astrocytes (arrow indicates ND). B) Left: L5 astrocytes Ca2+ event probability over time before (basal) and after L5 ND in wild-type (red) and IP3R2−/− (purple) mice. Right: Relative changes in Ca2+ event probability in wild-type and IP3R2−/− mice in control and with AM251 (2 μΜ). All experimental conditions were performed in TTX (1 μM) and in a cocktail of neurotransmitter receptor antagonists (see Material and methods). Two-tailed Student’s paired t-test. C) Top: EPSCs amplitude versus time before (basal) and after ND in wild-type mice in control (green or blue), in presence of CPT (5 μΜ) (open gray) and in IP3R2−/− mice (purple) in the homoneuron (left) and heteroneuron (right) from layer 5. Bottom: Relative changes in EPSC amplitude in wild-type mice in control, in presence of CPT (5 μM) and in IP3R2−/− mice. Two-tailed Student’s paired t-test. D) Top: Relative changes in EPSC amplitude before (basal) and after L2/3 ND in control and with CPT (5 μM) in the homoneuron (green) and heteroneuron (blue) from layer 2/3. Bottom: Relative changes in EPSC amplitude before (basal) and after L4 ND in control and with CPT (5 μM) in the homoneuron (green) and heteroneuron (blue) from layer 4. Two-tailed Student’s paired t-test. E) Left: Viral vectors injected into the S1 of wild-type mice and immunohistochemistry images showing the expression of NeuN (blue), mCherry (red) and GFAP (green) in the somatosensory cortex slices of a DREADDs injected mouse. Note the selective expression of hM3D–mCherry in astrocytes. Right: Scheme of the experimental approach and representative EPSC traces before (basal) and after CNO (1 mM) application in L5. F) Left: EPSCs amplitude versus time before (basal) and after CNO application in AAV8-GFAP-Gq-DREADD-mCherry injected mice in control (black, close) and in presence of CPT (gray, open), and in AAV8-GFAP-mCherry injected mice (black, open). Blue shadow indicates 5 s CNO application. Right: Relative changes in EPSC amplitude in DREADDs injected mice in control and in presence of CPT, and in mCherry injected mice. Two-tailed Student’s paired t-test. G) Left: Pseudocolor images showing the fluorescence intensities of GCaMP6f-expressing astrocytes before and after CNO application in L5. Top right: Ca2+ event probability over time of L5 astrocytes before (basal) and after CNO application in AAV8-GFAP-Gq-DREADD-mCherry injected mice in control (black, close) and in presence of CPT (gray, open), and in AAV8-GFAP-mCherry injected mice (black, open). Blue shadow indicates 5 s CNO application. Bottom right: Relative changes in Ca2+ event probability in DREADDs injected mice in control and in presence of CPT, and in mCherry injected mice. Two-tailed Student’s paired t-test. H) Schematic summary depicting the signaling pathways involved in eCBs-induced heteroneuronal synaptic depression. Data are expressed as mean ± SEM, *P < 0.05, **P < 0.01, ***P < 0.001.
Fig. 4
Fig. 4
Astrocyte-mediated heterosynaptic depression is column specific. A) Representative infrared differential interference contrast images of the barrel field in the barrel cortex showing intracolumn (left) and intercolumn (middle) pair of neurons patched and the stimulation electrode. False-color biocytin loading barrel cortex intercolumnar pair of neurons image (right). B) Left: EPSCs amplitude versus time before (basal) and after ND in the intracolumn heteroneuron. Right: Relative changes in EPSC amplitude in the intracolumn heteroneuron. C) Left: EPSCs amplitude versus time before (basal) and after ND in the intercolumn heteroneuron. Right: Relative changes in EPSC amplitude in the intercolumn heteroneuron. Two-tailed Student’s paired t-test. Data are expressed as mean ± SEM, **P < 0.01.
Fig. 5
Fig. 5
Astrocyte-mediated heterosynaptic depression is layer-specific. A) Representative infrared differential interference contrast image of the experimental configuration with the stimulation pipette in layer 2/3 and a pair of neurons patched one in L4 and the other in L2/3 of the S1 cortex. B) Left: Heteroneuronal EPSCs amplitude versus time in a pair of neurons patched one in L4 and the other in L2/3 before (basal) and after ND of L4 (blue) or L2/3 neuron (open gray). Right: Relative changes in EPSC amplitude in L2/3 (when L4 neuron is stimulated) and L4 (when L2/3 neuron is stimulated) neuron. Two-tailed Student’s paired t-test. C) Representative infrared differential interference contrast image of the experimental configuration with the stimulation pipette in layer 2/3 and a pair of neurons patched one in L5 and the other in L2/3 of the S1 cortex. D) Left: Heteroneuronal EPSCs amplitude versus time in a pair of neurons patched one in L5 and the other in L2/3 before (basal) and after ND of L5 (blue) or L2/3 neuron (open gray). Right: Relative changes in EPSC amplitude in L2/3 (when L5 neuron is stimulated) and L5 (when L2/3 neuron is stimulated) neuron. Two-tailed Student’s paired t-test. E) Representative infrared differential interference contrast image of the experimental configuration with the stimulation pipette in layer 2/3 and a pair of neurons patched one in L4 and the other in L5 of the S1 cortex. F) Left: Heteroneuronal EPSCs amplitude versus time in a pair of neurons patched one in L4 and the other in L5 before (basal) and after ND of L4 (blue) or L5 neuron (open gray). Right: Relative changes in EPSC amplitude in L5 (when L4 neuron is stimulated) and L4 (when L5 neuron is stimulated) neuron. Two-tailed Student’s paired t-test. G) Schematic summary depicting the astrocyte-mediated heterosynaptic regulation pathways into the same layer (intralayer) and between layers (interlayer). Data are expressed as mean ± SEM, *P < 0.05, **P < 0.01, ***P < 0.001.
Fig. 6
Fig. 6
Astrocytic Ca2+ responses to eCBs are not homogeneous across cortical layers. A) Representative infrared differential interference contrast image and pseudocolor image representing fluorescence intensities of GCaMP6f-expressing astrocytes in the different layers of the primary somatosensory cortex. B–D) left: Ca2+ event probability over time before (basal) and after ND (from −70 to 0 mV) in control and in presence of AM251 (2 μM) when patched and recorded in L2/3 (B, orange), L4 (C, purple), or L5 (D, red). Right: Relative changes in Ca2+ event probability in control and in presence of AM251 (2 μM) when patched and recorded in L2/3 (B, orange), L4 (C, purple), or L5 (D, red). Two-tailed Student’s paired t-test. E) Left: Ca2+ event probability over time of astrocytes of layer 2/3 (orange), 4 (purple), and 5 (red) before (basal) and after L2/3 neuron depolarization. Right: Relative changes in Ca2+ event probability of astrocytes of layer 2/3 (orange), 4 (purple), and 5 (red). Two-tailed Student’s paired t-test. F) Left: Ca2+ event probability over time of astrocytes of layer 2/3 (orange), 4 (purple), and 5 (red) before (basal) and after L4 neuron depolarization. Right: Relative changes in Ca2+ event probability of astrocytes of layer 2/3 (orange), 4 (purple), and 5 (red). Two-tailed Student’s paired t-test. G) Left: Ca2+ event probability over time of astrocytes of layer 2/3 (orange), 4 (purple), and 5 (red) before (basal) and after L5 neuron depolarization. Right: Relative changes in Ca2+ event probability of astrocytes of layer 2/3 (orange), 4 (purple), and 5 (red). Two-tailed Student’s paired t-test. All experimental conditions were performed in TTX (1 μM) and in a cocktail of neurotransmitter receptor antagonists (see Material and methods). H) Schematic summary depicting the Ca2+ responses of astrocytes located in the same (intralayer) or different (interlayer) layers to the endogenous mobilized eCBs from neurons located in the same or different layers. Data are expressed as mean ± SEM, *P < 0.05, **P < 0.01, ***P < 0.001.

Similar articles

Cited by

References

    1. Alger BE. Retrograde signaling in the regulation of synaptic transmission: focus on endocannabinoids. Prog Neurobiol. 2002:68(4):247–286. - PubMed
    1. Araque A, Carmignoto G, Haydon PG, Oliet SHR, Robitaille R, Volterra A. Gliotransmitters travel in time and space. Neuron. 2014:81(4):728–739. - PMC - PubMed
    1. Augustin SM, Lovinger DM. Functional relevance of endocannabinoid-dependent synaptic plasticity in the central nervous system. ACS Chem Neurosci. 2018:9(9):2146–2161. - PMC - PubMed
    1. Bayraktar OA, Bartels T, Holmqvist S, Kleshchevnikov V, Martirosyan A, Polioudakis D, Ben Haim L, Young AMH, Batiuk MY, Prakash K, et al. . Astrocyte layers in the mammalian cerebral cortex revealed by a single-cell in situ transcriptomic map. Nat Neurosci. 2020:23(4):500–509. - PMC - PubMed
    1. Benedetti B, Matyash V, Kettenmann H. Astrocytes control GABAergic inhibition of neurons in the mouse barrel cortex: astrocytes inhibit cortical neurons. J Physiol. 2011:589(5):1159–1172. - PMC - PubMed

Publication types

MeSH terms