. 2022 Sep;11(9):e12266.
doi: 10.1002/jev2.12266.

Comparative analysis of tangential flow filtration and ultracentrifugation, both combined with subsequent size exclusion chromatography, for the isolation of small extracellular vesicles

Affiliations

Comparative analysis of tangential flow filtration and ultracentrifugation, both combined with subsequent size exclusion chromatography, for the isolation of small extracellular vesicles

Kekoolani S Visan et al. J Extracell Vesicles. 2022 Sep.

Abstract

Small extracellular vesicles (sEVs) provide major promise for advances in cancer diagnostics, prognostics, and therapeutics, ascribed to their distinctive cargo reflective of pathophysiological status, active involvement in intercellular communication, as well as their ubiquity and stability in bodily fluids. As a result, the field of sEV research has expanded exponentially. Nevertheless, there is a lack of standardisation in methods for sEV isolation from cells grown in serum-containing media. The majority of researchers use serum-containing media for sEV harvest and employ ultracentrifugation as the primary isolation method. Ultracentrifugation is inefficient as it is devoid of the capacity to isolate high sEV yields without contamination of non-sEV materials or disruption of sEV integrity. We comprehensively evaluated a protocol using tangential flow filtration and size exclusion chromatography to isolate sEVs from a variety of human and murine cancer cell lines, including HeLa, MDA-MB-231, EO771 and B16F10. We directly compared the performance of traditional ultracentrifugation and tangential flow filtration methods, that had undergone further purification by size exclusion chromatography, in their capacity to separate sEVs, and rigorously characterised sEV properties using multiple quantification devices, protein analyses and both image and nano-flow cytometry. Ultracentrifugation and tangential flow filtration both enrich consistent sEV populations, with similar size distributions of particles ranging up to 200 nm. However, tangential flow filtration exceeds ultracentrifugation in isolating significantly higher yields of sEVs, making it more suitable for large-scale research applications. Our results demonstrate that tangential flow filtration is a reliable and robust sEV isolation approach that surpasses ultracentrifugation in yield, reproducibility, time, costs and scalability. These advantages allow for implementation in comprehensive research applications and downstream investigations.

Keywords: cell culture; extracellular vesicles; isolation; tangential flow filtration.


Conflict of interest statement

The authors report no conflict of interest. This work was funded by grants from the National Health and Medical Research Council Australia (APP1185907) and National Breast Cancer Foundation Australia (IIRS‐18‐159) to A.M. C.S. is supported by The National Health and Medical Research Council (NHMRC, 1114013).

Figures
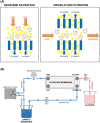
FIGURE 1
FIGURE 1
The principle of tangential flow filtration. (A) Representation of dead‐end filtration and cross‐flow filtration. (B) A schematic illustration of a tangential flow filtration system. Using a peristaltic pump, CCM travels from the sample reservoir, through to the filtration membrane, where molecules smaller than the molecular weight cut‐off are filtered out via the filtrate flow, and molecules larger than the molecular weight cut‐off are retained and recirculated back to the sample reservoir via the retentate flow. The pressure gauge is used to maintain appropriate flow rates, and valves are used to redirect flow for filtration and recirculation steps. CCM: cell culture conditioned media
FIGURE 2
FIGURE 2
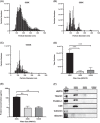
Filtration membrane with a molecular weight cut‐off of 300 kDa outperformed the 500 and 1000 kDa membranes, for the isolation of sEVs from the human cervical cancer cell line HeLa. (A‐C) Size distribution and enumeration of particles and (D) quantification of total particle yield as assessed by Nanoparticle Tracking Analysis. (E) Protein quantification as determined by Bradford Assay. (F) Western blot analysis of sEV markers HSP70, TSG101, Flotillin‐1 and CD9 in cell lysate (CL) and sEVs isolated using the different filters. The endoplasmic reticulum marker Calnexin, and the FBS‐contaminant Albumin, were also assessed. Equal protein amounts were loaded for each sEV sample. Data are presented as n = 3 ± SEM. **p < 0.01, ***p < 0.001. Statistical analyses were performed using repeated measures random effects model followed by Tukey's post‐hoc HSD test, or using quantile regression with q = 0.5. CL: cell lysate
FIGURE 3
FIGURE 3
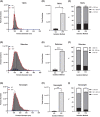
Tangential flow filtration isolated significantly higher yields of sEVs from human cervical cancer cell line HeLa, compared to ultracentrifugation, prior to purification by size exclusion chromatography. Size distribution and enumeration of particles, quantification of total particle yield, and percentage of particle size ranges as assessed by (A‐C) Tunable Resistive Pulse Sensing (TRPS), (D‐F) Zetaview and (G‐I) Nanosight. Data are presented as n = 3 ± SEM. *p < 0.05, **p < 0.01, ***p < 0.001. Statistical analyses were performed using repeated measures random effects model followed by Tukey's post‐hoc HSD test. UC: ultracentrifugation; TFF: tangential flow filtration
FIGURE 4
FIGURE 4
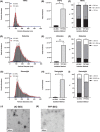
Post‐size exclusion chromatography purification, the recovery of sEVs from human cervical cancer cell line HeLa, isolated by tangential flow filtration is significantly higher than that of ultracentrifugation. Size distribution and enumeration of particles, quantification of total particle yield, and percentage of particle size ranges as assessed by (A‐C) Tunable Resistive Pulse Sensing (TRPS), (D‐F) Zetaview and (G‐I) Nanosight. Transmission electron microscopy images demonstrated a round, cup‐shaped morphology of sEVs isolated by (J) ultracentrifugation and (K) tangential flow filtration. Data are presented as n = 3 ± SEM. *p < 0.05, **p < 0.01. Statistical analyses were performed using repeated measures random effects model followed by Tukey's post‐hoc HSD test. UC‐SEC: ultracentrifugation‐size exclusion chromatography; TFF‐SEC: tangential flow filtration‐size exclusion chromatography
FIGURE 5
FIGURE 5
Tangential flow filtration effectively isolated significantly higher yields of sEVs from the murine breast cancer cell line EO771, human breast cancer cell line MDA‐MB‐231 and murine melanoma cell line B16F10, compared to ultracentrifugation. Size distribution and enumeration of particles, quantification of total particle yield, and percentage of particle size ranges from (A‐C) EO771, (D‐F) MDA‐MB‐231 and (G‐I) B16F10 cell lines, as assessed by Nanoparticle Tracking Analysis. Data are presented as a minimum of n = 3 ± SEM. **p < 0.01, ***p < 0.001. Statistical analyses were performed using quantile regression with q = 0.5. UC‐SEC: ultracentrifugation‐size exclusion chromatography; TFF‐SEC: tangential flow filtration‐size exclusion chromatography
FIGURE 6
FIGURE 6
After size exclusion chromatography, the purity of particles isolated by ultracentrifugation and tangential flow filtration is comparable. (A) Protein quantification as determined by Bradford Assay. (B) Western blot analysis of sEV markers HSP70, TSG101 and CD9 in cell lysate (CL) and sEVs isolated by ultracentrifugation and tangential flow filtration. The endoplasmic reticulum marker Calnexin, and the FBS‐contaminant Albumin, were also assessed. Equal particle amounts (3 × 108 particles) were loaded for each sEV sample. Particle purity expressed as particles per microgram of protein as determined by (C) Tunable Resistive Pulse Sensing (TRPS), (D) Zetaview and (E) Nanosight. Data are presented as n = 3 ± SEM. *p < 0.05. Statistical analyses were performed using quantile regression or two‐way ANOVA. UC‐SEC: ultracentrifugation‐size exclusion chromatography; TFF‐SEC: tangential flow filtration‐size exclusion chromatography
FIGURE 7
FIGURE 7
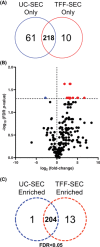
Proteomic profiles of UC‐SEC and TFF‐SEC sEVs slightly differ, as determined by mass spectrometry. SEVs were isolated from the murine breast cancer cell line EO771. (A) Venn diagram of proteins identified in UC‐SEC and TFF‐SEC sEVs. (B) Volcano plot of 218 proteins commonly expressed in UC‐SEC and TFF‐SEC sEVs. The horizontal black dotted line corresponds with a significant FDR p‐value < 0.05. Significantly enriched UC‐SEC and TFF‐SEC sEV proteins are represented as blue and red dots, respectively. (C) Venn diagram of 218 proteins commonly expressed in UC‐SEC and TFF‐SEC sEVs. UC‐SEC: ultracentrifugation‐size exclusion chromatography; TFF‐SEC: tangential flow filtration‐size exclusion chromatography
FIGURE 8
FIGURE 8
Identification and confirmation of the presence of CD9+ sEVs in ultracentrifugation and tangential flow filtration samples, as detected by image flow cytometry. SEVs were isolated from the murine breast cancer cell line EO771. Samples were labelled with lipophilic fluorescent dye PKH67, and tagged with fluorescent CD9 (APC) antibody. (A) Dot plot of small, single, PKH67+, CD9+ EVs. (B) Frequency of CD9+ single sEVs. Fluorescence intensity of (C) CD9 and (D) PKH67 in CD9+ single sEVs. (E) Images of PKH67‐labelled CD9+ single sEVs in brightfield (CH01), PKH67‐related fluorescence (CH02) and CD9‐related fluorescence (CH11) channels. Data are presented as n = 3 ± SEM. *p < 0.05, **p < 0.01. Statistical analyses were performed using quantile regression with q = 0.5. UC‐SEC: ultracentrifugation‐size exclusion chromatography; TFF‐SEC: tangential flow filtration‐size exclusion chromatography
FIGURE 9
FIGURE 9
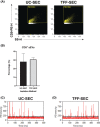
Identification and confirmation of the presence of CD9+ sEVs in ultracentrifugation and tangential flow filtration samples, as detected by nano‐flow cytometry. SEVs were isolated from the murine breast cancer cell line EO771. Samples were tagged with fluorescent CD9 (PE) antibody. (A) Dot plot of CD9+ sEVs. (B) Frequency of CD9+ sEVs. (C, D) Trace images demonstrating peaks corresponding with CD9 (PE)‐related fluorescence. Baseline represents the minimum fluorescence level of any particle detected. Data are presented as n = 3 ± SEM. Statistical analyses were performed using quantile regression with q = 0.5. UC‐SEC: ultracentrifugation‐size exclusion chromatography; TFF‐SEC: tangential flow filtration‐size exclusion chromatography

References

    1. Abramowicz, A. , Marczak, L. , Wojakowska, A. , Zapotoczny, S. , Whiteside, T. L. , Widlak, P. , & Pietrowska, M. (2018). Harmonization of exosome isolation from culture supernatants for optimized proteomics analysis. Plos One, 13(10), e0205496. - PMC - PubMed
    1. Alameldin, S. , Costina, V. , Abdel‐Baset, H. A. , Nitschke, K. , Nuhn, P. , Neumaier, M. , & Hedtke, M. (2021). Coupling size exclusion chromatography to ultracentrifugation improves detection of exosomal proteins from human plasma by LC‐MS. Practical Laboratory Medicine, 26, e00241. - PMC - PubMed
    1. Anderson, W. , Kozak, D. , Coleman, V. A. , Jämting, Å. K. , & Trau, M. (2013). A comparative study of submicron particle sizing platforms: Accuracy, precision and resolution analysis of polydisperse particle size distributions. Journal of Colloid and Interface Science, 405, 322–330. - PubMed
    1. Andrade, A. C. , Wolf, M. , Binder, H.‐M. , Gomes, F. G. , Manstein, F. , Ebner‐Peking, P. , Poupardin, R. , Zweigerdt, R. , Schallmoser, K. , & Strunk, D. (2021). Hypoxic conditions promote the angiogenic potential of human induced pluripotent stem cell‐derived extracellular vesicles. International Journal of Molecular Sciences, 22(8), 3890. - PMC - PubMed
    1. Arab, T. , Mallick, E. R. , Huang, Y. , Dong, L. , Liao, Z. , Zhao, Z. , Gololobova, O. , Smith, B. , Haughey, N. J. , Pienta, K. J. , Slusher, B. S. , Tarwater, P. M. , Tosar, J. P. , Zivkovic, A. M. , Vreeland, W. N. , Paulaitis, M. E. , & Witwer, K. W. (2021). Characterization of extracellular vesicles and synthetic nanoparticles with four orthogonal single‐particle analysis platforms. Journal of Extracellular Vesicles, 10(6), e12079. - PMC - PubMed

Publication types