

TSG101 associates with PARP1 and is essential for PARylation and DNA damage-induced NF-κB activation
- PMID: 36124865
- PMCID: PMC9627669
- DOI: 10.15252/embj.2021110372
TSG101 associates with PARP1 and is essential for PARylation and DNA damage-induced NF-κB activation
Abstract
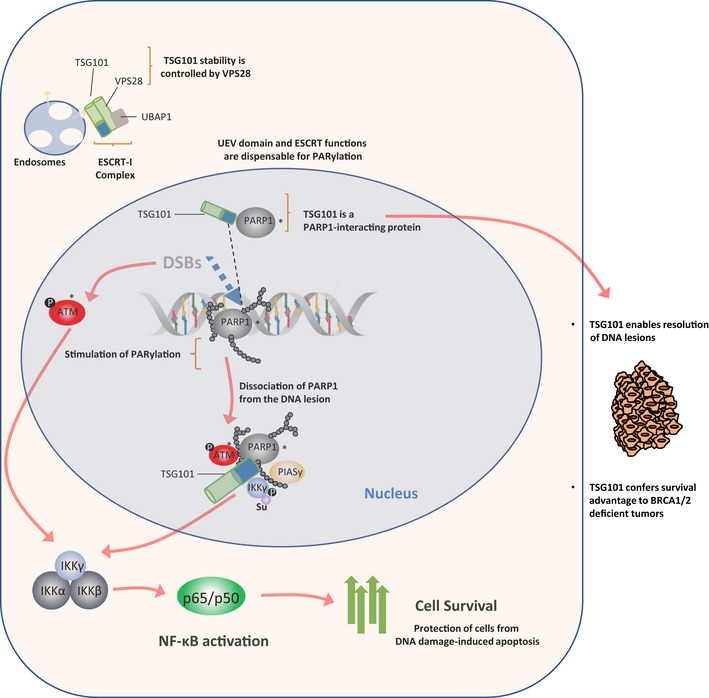
In a genome-wide screening for components of the dsDNA-break-induced IKK-NF-κB pathway, we identified scores of regulators, including tumor susceptibility gene TSG101. TSG101 is essential for DNA damage-induced formation of cellular poly(ADP-ribose) (PAR). TSG101 binds to PARP1 and is required for PARP1 activation. This function of TSG101 is independent of its role in the ESCRT-I endosomal sorting complex. In the absence of TSG101, the PAR-dependent formation of a nuclear PARP1-IKKγ signalosome, which triggers IKK activation, is impaired. According to its requirement for PARP1 and NF-κB activation, TSG101-deficient cells are defective in DNA repair and apoptosis protection. Loss of TSG101 results in PARP1 trapping at damage sites and mimics the effect of pharmacological PARP inhibition. We also show that the loss of TSG101 in connection with inactivated tumor suppressors BRCA1/2 in breast cancer cells is lethal. Our results imply TSG101 as a therapeutic target to achieve synthetic lethality in cancer treatment.
Keywords: ADP ribosylation; DNA damage; IKK-NF-κB pathway; TSG101; breast cancer.
© 2022 The Authors. Published under the terms of the CC BY 4.0 license.
Figures
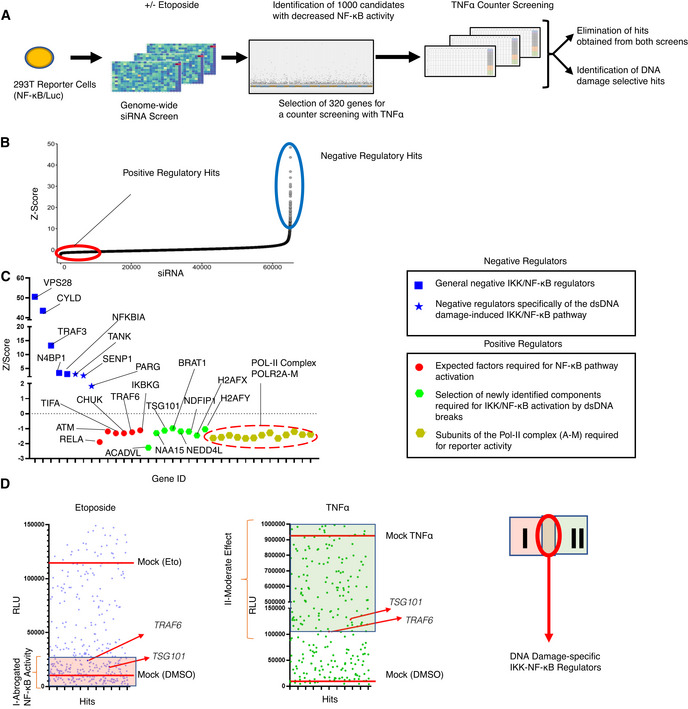
- A
Schematic diagram of the two consecutive siRNA screens. NF‐κB‐driven luciferase activity served as a readout for pathway activation. The primary screen was performed using a genome‐wide siRNA library. A total of 320 candidates were selected for a secondary counter screen with TNFα to narrow down DNA damage‐specific regulators of the NF‐κB pathway. Responsiveness of the reporter cell line to NF‐κB activating stimuli was analyzed by western blotting (Fig EV1A).
- B
Cumulative distribution of Z‐scores of the genome‐wide siRNA screening. Candidates with low Z‐scores are putative positive regulators as their depletion abrogated NF‐κB activation by DNA damage (red circle). Putative negative regulators with high Z‐scores exhibited elevated NF‐κB activity (blue circle).
- C
Z‐scores of the best‐scoring siRNAs for selected previously known and newly identified pathway regulators. Hits include VPS28 (Mamińska et al, 2016), CYLD (Trompouki et al, 2003), NFKBIA (Haskill et al, 1991), TRAF3 (Vallabhapurapu et al, 2008), N4BP1 (Shi et al, 2021), TANK (Wang et al, 2015), SENP1 (Lee et al, ; Shao et al, 2015), PARG (Cortes et al, 2004), RELA (Li et al, 2001), TIFA (Fu et al, 2018), CHUK (Colomer et al, 2019), TRAF6 (Hinz et al, 2010) and IKBKG (Mabb et al, 2006) for expected factors.
- D
Representative relative luciferase units (RLU) of the differential counter screen of the 320 preselected hits are shown. The RLU of hits is displayed for etoposide and TNFα screens (left and right panels). See Dataset EV4 for details. RLU levels of treatment controls are indicated with red lines. Hits that abrogated etoposide‐induced NF‐κB activity were classified as group I. Hits in the TNFα counter screen with higher activity than in siTRAF6‐transfected cells constituted group II. The intersection of the two groups indicates putative DNA damage‐selective positive regulators. Note that TNFα may trigger secondary NF‐κB activation events through autocrine/paracrine mechanisms. See Dataset EV4 for luminescence values.
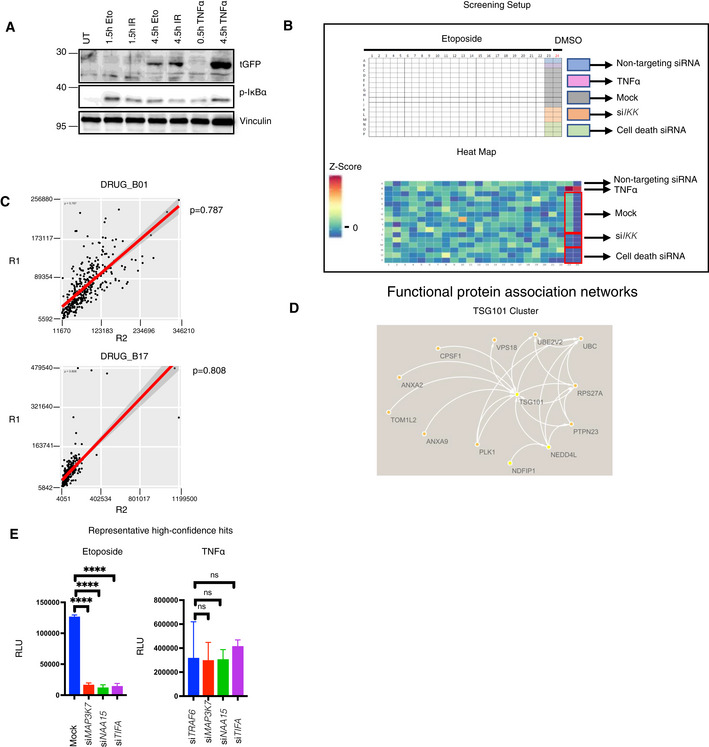
- A
HEK‐Luc(tGFP) NF‐κB reporter cells were treated with the indicated conditions (50 μM etoposide, 20 Gy irradiation, or 10 ng/ml TNFα). As the NF‐κB‐driven expression and translation of turbo GFP require more time than the initial activation of the NF‐κB pathway, the treatment conditions were alternatively prolonged to 4.5 h. Whole‐cell extracts were obtained and immunoblotted with the indicated antibodies.
- B
Detailed layout of the genome‐wide siRNA screening, carried out using a one‐plate‐to‐one target approach. The indicated controls were added to the siRNA library. As another control, cells were treated with the vehicle DMSO (Column 24). The heatmap displays the Z‐scores of tested candidates and controls of a representative plate taken from the siRNA library screen.
- C
Spearman's rank correlation coefficient test of representative screening plate replicates demonstrated high assay reproducibility. Same screening plates and layouts were tested, and results were compared with each other (R1 vs R2).
- D
TSG101 cluster was visualized using STRING database (Szklarczyk et al, 2019). Arrows or lines between candidate hits represent protein–protein interactions observed in previous publications.
- E
Representative high‐confidence DNA damage‐selective hits are shown for etoposide (left panel) and TNFα (right panel) screens. The conditions were compared with an ordinary one‐way ANOVA (ns, P > 0.05; ****P < 0.0001). Results were obtained from three biologically independent experiments. Error bars represent mean ± SD.
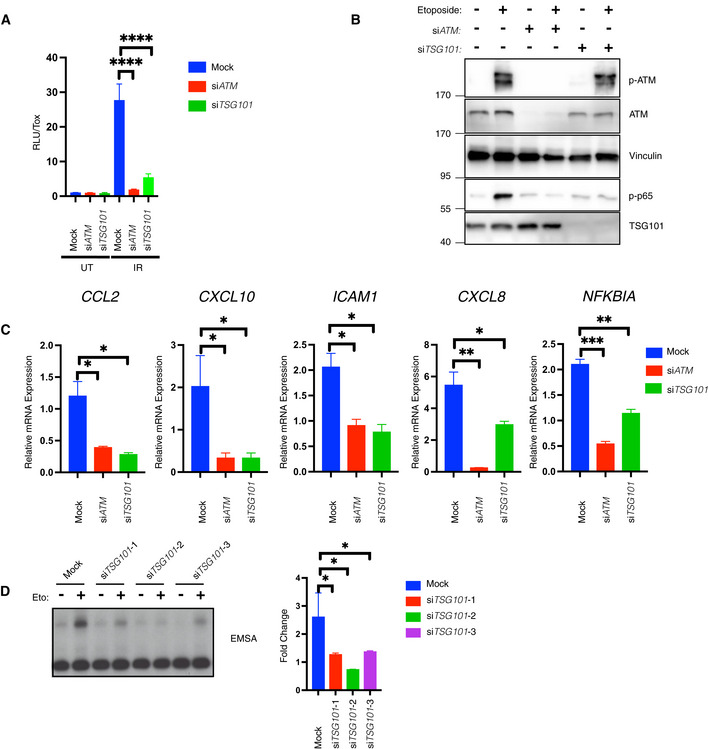
- A
IR‐induced NF‐ĸB pathway activation was analyzed via luciferase activity of HEK‐Luc cells, transfected with the indicated siRNAs. The indicated cells were irradiated (20 Gy, 8 h before analysis). A late time point was used for efficient luciferase expression. Luciferase activity was normalized to the viable cell number (TOX fluorescence). The data represent three biological and five technical replicates. Error bars represent mean ± SD. For knockdown efficiency, see Fig EV2A. The conditions were compared with an ordinary one‐way ANOVA (****P < 0.0001).
- B
U2‐OS cells were transfected with the indicated siRNAs. The indicated cells were treated with etoposide (50 μM, 90 min. Before analysis). Whole‐cell extracts were immunoblotted with the indicated antibodies. The result is representative of three biological replicates.
- C
U2‐OS cells were transfected with the indicated siRNAs and exposed to irradiation (20 Gy, 90 min. Before analysis). The expression of indicated genes was analyzed using RT–qPCR. The mRNA expression was normalized to the expression of the housekeeping genes ACTA1, RPL13A, and TBP2. Data represent three biologically independent experiments +/− SEM. The conditions were compared with an ordinary one‐way ANOVA (*P < 0.05; **P < 0.01, ***P < 0.001).
- D
U2‐OS cells were transfected with nontargeting (mock) or TSG101‐targeting siRNAs and irradiated (20 Gy) for 90 min. Before analysis. Lysates were analyzed by EMSA and results of fold changes in densitometric measurements of the three independent experiments were compared with an ordinary one‐way ANOVA (*P < 0.05) in the right panel. Error bars represent mean ± SD.
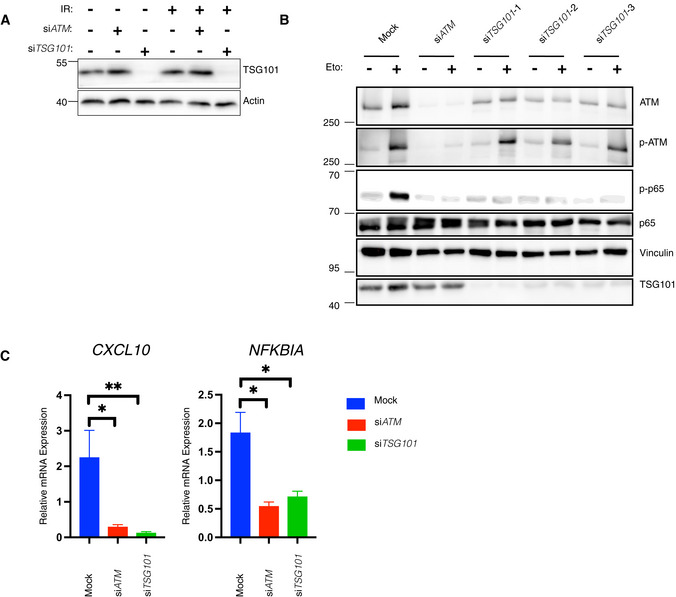
- A
HEK‐Luc(tGFP) NF‐κB reporter cells were transfected with the same transfection mixtures as used in Fig 2A. Whole‐cell extracts were immunoblotted with antibodies against the indicated proteins. Actin was used as a loading control.
- B
U2‐OS cells were transfected with nontargeting (mock) or ATM‐directed siRNAs or three different TSG101‐targeting siRNAs. The indicated cells were treated with etoposide (50 μM, 90 min. Before analysis). Whole‐cell extracts were immunoblotted with the indicated antibodies.
- C
U2‐OS cells were transfected with the indicated siRNAs. The NF‐ĸB pathway was activated by etoposide treatment (50 μM, 90 min before analysis). Expression of indicated genes was analyzed using qRT–PCR. The mRNA expression of these genes was normalized to the expression of three housekeeping genes, ACTA1, RPL13A, and TBP2. The gene expression for the indicated conditions is relative to the nontargeting siRNA‐transfected vehicle (DMSO)‐treated cells. The result is representative of three biologically independent experiments. The conditions were compared with an ordinary one‐way ANOVA (*P < 0.05; **P < 0.01). Error bars represent mean ± SEM.
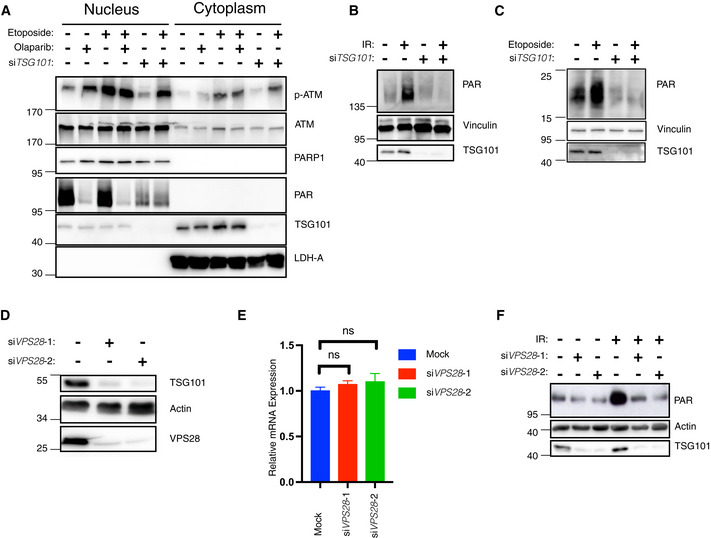
- A
Nuclear‐cytoplasmic fractionation of U2‐OS cells. Indicated samples were transfected with siRNAs against TSG101. PARylation was inhibited by olaparib (10 μM, 24 h before analysis). Cytoplasmic export of p‐ATM was induced by etoposide (50 μM, 45 min before analysis). Nuclear and cytoplasmic fractions were immunoblotted with the indicated antibodies. The fractionation efficiency was controlled by the respective subcellular marker proteins (PARP1 and LDH‐A). PARylation was detected using the Pan ADPr reagent. Note that PARylation is activated by shearing forces during extract preparation (lane 1) (Jungmichel et al, 2013).
- B
U2‐OS cells were transfected with nontargeting (−) or TSG101‐targeting (+) siRNAs and cells were irradiated (+) or not (−) as indicated (20 Gy) 10 min. Before analysis. Whole‐cell extracts were immunoblotted with the 10H PAR monoclonal antibody.
- C
siRNA‐transfected U2‐OS cells as in B were etoposide‐treated or not, as indicated. Whole‐cell extracts were immunoblotted with the Pan ADPr reagent that recognizes both poly‐ and mono‐(ADP‐ribose). Note that PARylation also occurred during cell lysis in untreated cells.
- D
U2‐OS cells were transfected with nontargeting or VPS28‐targeting siRNAs. Whole‐cell extracts were immunoblotted with indicated antibodies.
- E
Total mRNA was extracted from the samples in D. Expression of TSG101 was analyzed by RT–qPCR and normalized to two housekeeping genes, ACTA1 and RPL13A. The conditions were compared with an ordinary one‐way ANOVA (ns, P > 0.05). Error bars represent mean ± SEM.
- F
Cells were irradiated (20 Gy) as indicated 10 min before analysis. Whole‐cell extracts were immunoblotted with the indicated antibodies.
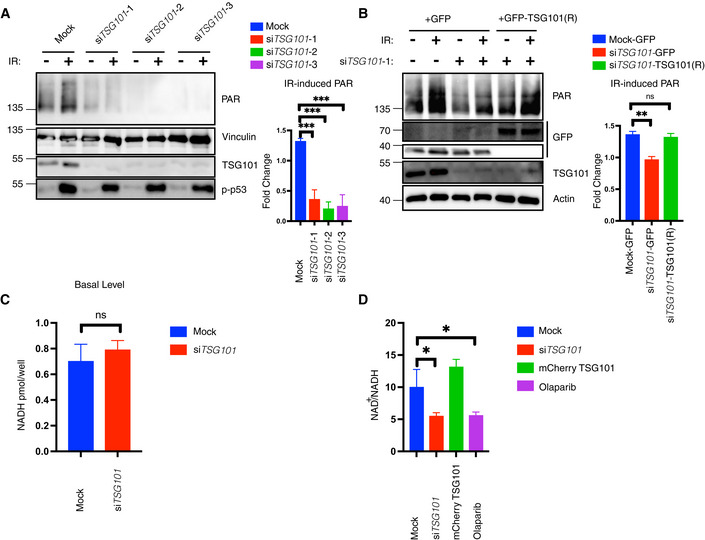
- A
U2‐OS cells were transfected with nontargeting (mock) or three different TSG101‐targeting siRNAs. Cells were irradiated (20 Gy) 10 min before analysis. Nuclear extracts were immunoblotted with the indicated reagents and antibodies. Right panel, densitometric measurements of irradiation‐induced fold changes in PARylation were obtained from three independent experiments and conditions were compared with an ordinary one‐way ANOVA (***P < 0.001). Error bars represent mean ± SD.
- B
A rescue experiment was performed using a siRNA‐resistant GFP‐TSG101(R) expression vector. Two base substitutions were introduced into the codons for amino acids 61 and 62 of TSG101. U2‐OS cells were transfected with either GFP alone or GFP‐TSG101 (R) vector. Cells were then transfected with nontargeting or TSG101‐targeting siRNAs as indicated and were irradiated (20 Gy) 10 min before analysis. Nuclear extracts were immunoblotted with the indicated reagents and antibodies. Densitometric measurements of irradiation‐induced fold changes in PARylation (right panel) were obtained from three independent experiments. Conditions were compared with an ordinary one‐way ANOVA (ns, P > 0.05; **P < 0.01). Error bars represent mean ± SD.
- C
U2‐OS cells were transfected with nontargeting or TSG101‐targeting siRNAs. NADH measurements were performed 72 h after the siRNA transfection. Conditions were compared with Student's t‐test (Welch Correction) (ns, P > 0.05). Error bars represent mean ± SD. Results were obtained from three biologically independent experiments.
- D
U2‐OS cells were transfected with nontargeting (Mock) or TSG101‐directed siRNAs, with mCherry‐TSG101, or treated with olaparib (10 μM, 16 h before irradiation), as indicated. Cells were irradiated (20 Gy) 10 min before analysis and NAD+/NADH levels were determined. The result is representative of four independent experiments. The conditions were compared with an ordinary one‐way ANOVA (*P < 0.05). Error bars represent mean ± SD.
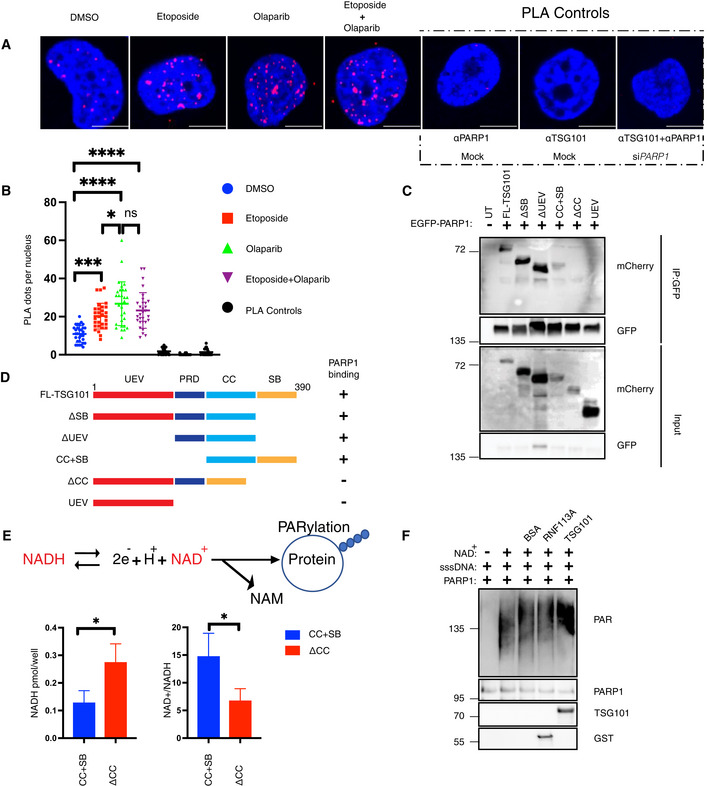
- A
Proximity ligation assay (PLA) assay with unstimulated, etoposide (Eto)‐treated (50 μM, 10 min. Before analysis), or etoposide plus olaparib‐(Olap) co‐treated (50 μM of etoposide, 10 min. Before analysis and 10 μM of olaparib 24 h before analysis) U2‐OS cells. The red dots represent PARP1‐TSG101 interaction. The nucleus is stained with DAPI (blue). Scale bar: 10 μm. As negative controls, PLA was performed without primary PARP1 or TSG101 antibodies. As an additional control, PLA was performed in PARP1 depleted cells to show the specificity of the PLA signal. The data are representative of three biologically independent experiments.
- B
Quantification of PLA dots per nuclei in (A). Blind counting was performed from 30 replicates of three biologically independent experiments. The conditions were compared with an ordinary one‐way ANOVA (ns, P > 0.05; *P < 0.05; ***P < 0.001; ****P < 0.0001). Error bars represent mean ± SD.
- C
U2‐OS cells were cotransfected with the indicated deletion constructs of mCherry‐tagged TSG101 and EGFP‐tagged PARP1. Immunoprecipitation of GFP was performed using whole‐cell extracts.
- D
Diagram showing the summary of PARP1 interacting and noninteracting TSG101 domain deletion mutants.
- E
U2‐OS cells were transfected with the indicated, coiled‐coil containing CC+SB and coiled‐coil deleted ΔCC constructs. Cells were irradiated (20 Gy, 5 min before analysis) and the decomposed NADH and total NAD+ levels were quantified. The NADH/NAD+ ratio is shown in the right panel. The conditions were compared with an unpaired t‐test (*P < 0.05). Error bars represent mean ± SD.
- F
In vitro PARylation reactions were carried out with the indicated recombinant and purified proteins, including 8 ng PARP1 in the presence of ssDNA (sheared salmon sperm DNA) and MgCl2. 100 ng of TSG101 was added to the reaction, as indicated. The PARylation reaction was also carried out using 100 ng of BSA or RNF113A as negative controls.
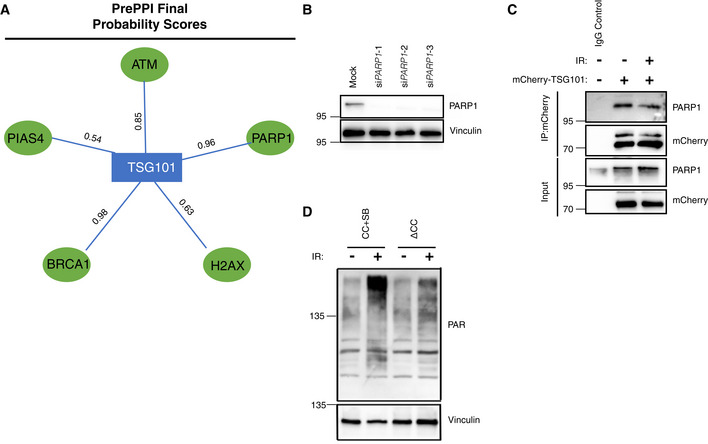
- A
Final protein–protein interaction probability scores for the indicated interactions were obtained from the PrePPI database (Zhang et al, 2013).
- B
Validation of PARP1 knockdown in A. Different PARP1 siRNAs were used in each independent PLA experiment summarized in Fig 4B. The representative image in Fig 4A was obtained using siPARP1(3).
- C
U2‐OS cells were transfected with the full‐length mCherry‐tagged TSG101 plasmid and DNA damage was induced by irradiation (20 Gy, 45 min before analysis), as indicated. Immunoprecipitation of mCherry was performed using whole‐cell extracts. The result is representative of three biologically independent experiments.
- D
TSG101 deletion constructs CC+SB and ΔCC were expressed in U2‐OS cells. Untreated or irradiated cells were harvested (90 min after 20 Gy exposure) and analyzed by Western blotting for PAR levels using the Pan ADPr reagent. Vinculin was detected as a loading control.
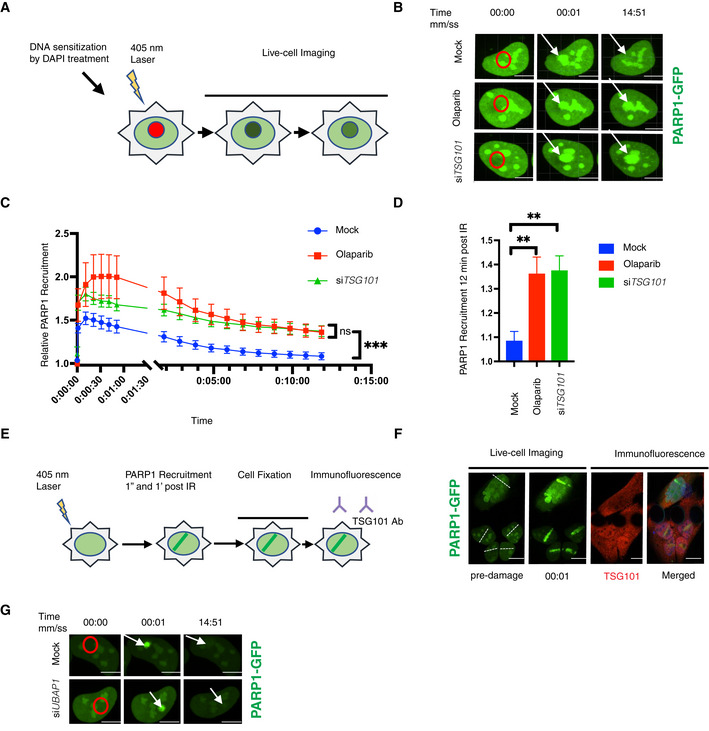
- A
Schematic of the live‐cell PARP1 recruitment assay. U2‐OS cells transfected with GFP‐tagged PARP1 were sensitized with DAPI (10 μg/ml, for 10 min). After 405 nm microirradiation, PARP1 recruitment to and dissociation from the DNA lesion was recorded over time.
- B
Representative images of PARP1‐GFP association with laser‐microirradiation sites in untreated (mock), olaparib‐treated (10 μM, 24 h before analysis) or siTSG101‐transfected U2‐OS cells at indicated times postirradiation. Scale bar: 7.5 μm. The image is representative of nine replicates from three biologically independent experiments. Go to Movies [Link], [Link] for further illustration.
- C
Kinetics of PARP1‐GFP recruitment and dissociation from DNA lesions were measured at times indicated. Nine nuclei were analyzed for each indicated condition from three biologically independent experiments. The data are shown as mean GFP intensity in the microirradiated area ± SEM, normalized to the mean GFP intensity of corresponding whole nuclei. The conditions were compared with an ordinary one‐way ANOVA (ns, P > 0.05; ***P < 0.001).
- D
Relative PARP1‐GFP recruitment to DNA lesions for each indicated condition at 12 min postirradiation. The conditions were compared with an ordinary one‐way ANOVA (**P < 0.01). Error bars represent mean ± SEM.
- E
Scheme of indirect immunofluorescence analysis of DNA damage sites. U2‐OS cells were GFP‐PARP1‐transfected and microirradiated as in (A). Cells were fixed shortly after rapid PARP1 recruitment to the DNA lesions (1 min post‐microirradiation) and stained for TSG101 by indirect immunofluorescence.
- F
Indirect immunofluorescence of TSG101 at indicated times post damage. DNA lesions were generated as in B. Stippled lines indicate the applied laser beam. Recruitment of PARP1 to DNA lesions was recorded from live cells. Cells were fixed at 1 min post‐microirradiation and stained for TSG101. For specificity of the TSG101 staining see Fig EV5A. Scale bar: 10 μm.
- G
Representative images of PARP1‐GFP association/dissociation at laser‐microirradiation sites in untreated (mock) or siUBAP1‐transfected U2‐OS cells at indicated times postirradiation. Scale bar: 10 μm. The image is representative of four independent experiments.
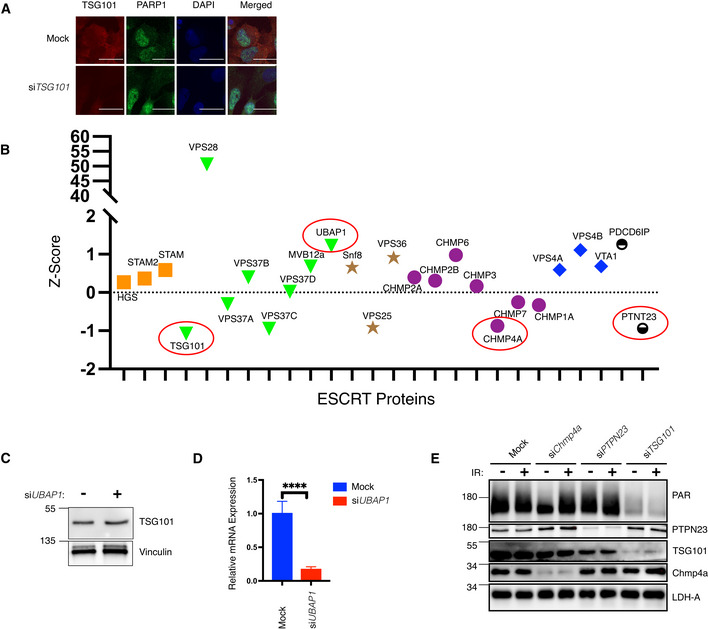
- A
U2‐OS cells were transfected with nontargeting (mock) or TSG101‐targeting siRNAs. Indirect immunofluorescence visualizes TSG101 (red) and PARP1 (green). DAPI staining shows the nuclei in blue. Scale bar is 10 μm. The image is representative of three biologically independent experiments.
- B
Z‐scores of the mean values of the depicted ESCRT complex members and accessory proteins (ESCRT‐0: orange, ESCRT‐I: green, ESCRT‐II: brown, ESCRT‐III: purple, and ESCRT‐IV: red) from Dataset EV1. Subsequently analyzed members CHMP4A, PTPN23, TSG101, and UBAP1 are highlighted with red circles.
- C
U2‐OS cells were transfected with nontargeting or UBAP1‐targeting siRNAs. Whole‐cell extracts were immunoblotted with antibodies against the indicated proteins. Vinculin was used as a loading control.
- D
Total RNA was extracted from cells analyzed in B and converted to cDNA. The relative mRNA expression of UBAP1 was normalized to two housekeeping genes, RPL13A, and TBP2. Data are from six biologically independent experiments. Conditions were compared with an unpaired t‐test with Welch's correction (****P < 0.0001). Error bars represent mean ± SD.
- E
U2‐OS cells were transfected with nontargeting siRNAs (mock) or with siRNAs directed against CHMP4A, PTPN23, or TSG101 and irradiated (20 Gy) or not, as indicated. PAR levels and expression of indicated proteins were monitored by western blotting with the respective agents and antibodies. LDH‐A served as a loading control.
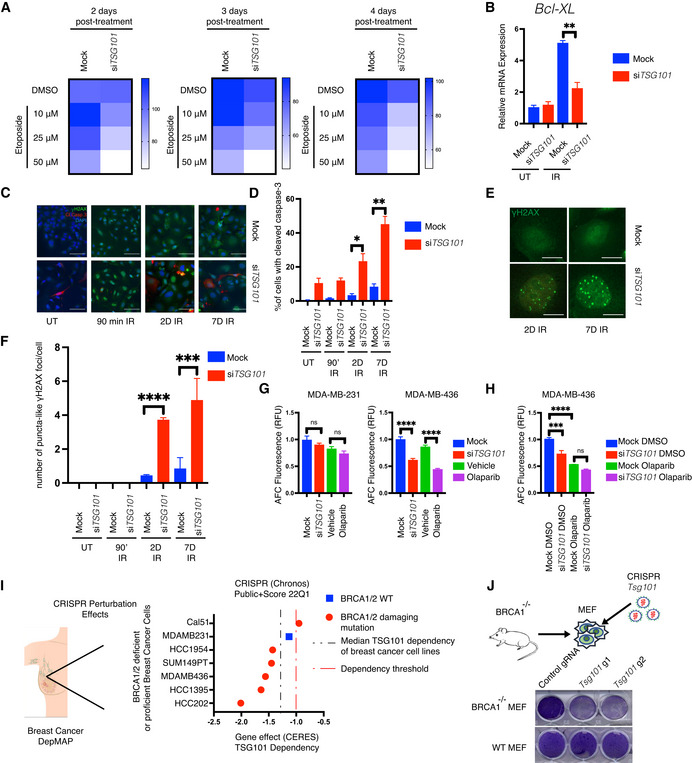
- A
Survival curve assay. U2‐OS cells were transfected with nontargeting or TSG101‐targeting siRNAs. Cells were treated with increasing concentrations of etoposide (10, 25, and 50 μM). Relative numbers of viable cells in culture were measured using a fluorogenic, cell‐permeant peptide substrate (glycyl‐phenylalanyl‐aminofluorocoumarin; GF‐AFC) at 2, 3, or 4 days post‐treatment. The data represent five biologically independent experiments. The heatmap displays the relative survival fractions of TSG101‐targeted compared with nontargeting siRNA‐transfected cells exposed to increasing etoposide concentration at each time point, 2, 3, or 4 days post‐treatment, respectively.
- B
U2‐OS cells were transfected with nontargeting (mock) or TSG101‐directed siRNAs, kept untreated (UT) or irradiated (20 Gy), and analyzed 1 day later. Total RNA was extracted, and the expression of BCL2L1 was analyzed by RT–qPCR. BCL2L1 expression was normalized to the housekeeping genes ACTA1, RPL13A and TBP2.in three biologically independent experiments. The conditions were compared with an unpaired t‐test (**P < 0.01). Error bars represent mean ± SEM.
- C
Cells were transfected with nontargeting or TSG101‐targeting siRNAs. Immunofluorescence staining was performed with the indicated antibodies (red: cleaved caspase‐3; green: γH2AX). Nuclei were stained with DAPI (blue). The image is a representative of 3 biologically independent experiments. Scale bar: 30 μm. See Fig EV6D for the percentage of γH2AX positive cells as evidence of IR‐treatment.
- D
Percentage of cleaved caspase‐3 was determined by blind counting offv approximately 100 cells for each condition from 3 biologically independent experiments. Conditions were compared with an unpaired t‐test (*P < 0.05, **P < 0.01). Error bars represent mean ± SEM.
- E
γH2AX staining of TSG101‐targeting or nontargeting siRNA‐transfected U2‐OS cells reveals puncta‐like foci at 2 or 7 days after irradiation. Scale bar: 30 μm.
- F
The number of puncta‐like γH2AX foci per cell was determined by blind counting of approximately 100 cells for each condition from 3 biologically independent experiments. Conditions were compared with an unpaired t‐test (***P < 0.001, ****P < 0.0001). Error bars represent mean ± SD.
- G
MDA‐MB‐231 and MDA‐MB‐436 cells were transfected with TSG101‐targeting or nontargeting siRNAs. Cells were treated with vehicle (DMSO) or olaparib (10 μM) 96 h prior to the analysis, as indicated. Results were obtained from five biologically independent experiments. Relative number of viable cells in culture was measured using GF‐AFC. See Fig EV6G for brightfield images of cells expressing TSG101‐targeting or nontargeting siRNAs. Conditions were compared with an unpaired t‐test (ns, ****P < 0.0001). Error bars represent mean ± SD.
- H
MDA‐MB‐436 cells were transfected with TSG101‐targeting or nontargeting (mock) siRNAs. Cells were treated with vehicle (DMSO) or olaparib (10 μM) 96 h prior to the analysis, as indicated. Results were obtained from three biologically independent experiments. Relative number of viable cells in culture was measured using GF‐AFC. Conditions were compared with an unpaired t‐test (ns, ***P < 0.001, ****P < 0.0001). Error bars represent mean ± SD.
- I
Analysis of breast cancer cell lines bearing damaging BRCA1/2 mutations in the DepMap database. The CERES score represents the gene effect, which is based on cell depletion assays of the CRISPR (Avana) public 22Q1 dataset. A CERES score lower than (−1) indicates a high likelihood that the gene of interest is essential in the given cell line. Correspondingly, a − 1 CERES score was indicated with a discontinued red line. The median dependency of all breast cancer cell types to TSG101 expression was indicated with a discontinued black line.
- J
BRCA1 deficient MEF cells were lentivirally transduced with two independent guide RNAs targeting mouse Tsg101 or with empty CRISPR. Cell viability was analyzed with crystal violet staining. CRISPR knockout of Tsg101 in wild‐type MEF cells did not cause cell death. Note that the figure is composed of two separate culture images. The knockout efficiency in wild‐type cells was determined by immunoblotting (See Fig EV6E).
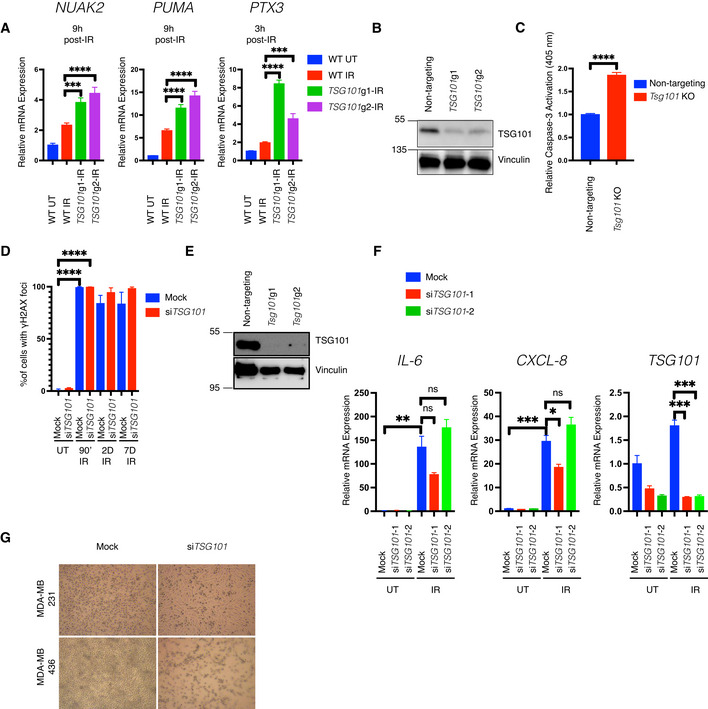
- A
U2‐OS cells were lentivirally transduced with two independent guide RNAs targeting the TSG101 locus. Due to the lethal side effects of TSG101 deletion on long‐term proliferation, bulk cells were used instead of the clonally expanded cells. DNA damage was induced by irradiation (20 Gy, 3 or 9 h before analysis) in wild‐type or TSG101 CRISPR knockout bulk cells. Total mRNA was extracted and expression of NUAK, PTX3, and PUMA was analyzed with RT–qPCR. The mRNA expression was normalized to the housekeeping genes ACTA1, RPL13A, and TBP2. Data are from three biologically independent experiments. The conditions were compared with an ordinary one‐way ANOVA (***P < 0.001; ****P < 0.0001). Error bars represent mean ± SEM.
- B
The efficiency of TSG101 CRISPR in the cells used in A is shown with immunoblotting. Whole‐cell extracts were immunoblotted with antibodies against TSG101. Vinculin was used as a loading control.
- C
Irradiation‐induced cleaved caspase‐3 activation in nontargeting gRNA or Tsg101‐targeting gRNA transduced MEF cells was measured using a colorimetric assay. For knockout efficiencies see Fig EV6E. Bulk cells from Tsg101 guide‐1 were used in this assay. Results were obtained from four biologically independent experiments. The conditions were compared with an unpaired t‐test (****P < 0.0001). Error bars represent mean ± SD.
- D
Percentage of γH2AX positive staining from Fig 6D is shown. Results were obtained from blind counting of approximately 100 cells for each condition from 3 biologically independent experiments. The conditions were compared with an unpaired t‐test (****P < 0.0001). Error bars represent mean ± SD.
- E
Wild‐type MEF cells from Fig 6J (control or Tsg101 guide RNA transduced cells) were analyzed for Tsg101 CRSIPR/Cas9 knockout efficiency. Whole‐cell extracts were obtained from these cells and immunoblotted with the indicated antibodies. Vinculin was used as a loading control.
- F
U2‐OS cells were transfected with nontargeting (mock) or two different TSG101‐targeting siRNAs. Nonirradiated cells (samples 1–3) were compared with senescent cells 7 days postirradiation (samples 4–6). Total mRNA was extracted and expression of CXCL8, IL‐6, and TSG101 was analyzed by RT–qPCR. The mRNA expression of these genes was normalized to the three housekeeping genes ACTA1, RPL13A, and TBP2. Data are from three biologically independent experiments. Conditions were compared with an ordinary one‐way ANOVA (ns, P > 0.05; *P < 0.05; **P < 0.01, ***P < 0.001). The conditions were compared with an unpaired t‐test (****P < 0.0001). Error bars represent mean ± SEM.
- G
Representative brightfield images of TSG101‐targeting or nontargeting siRNA‐transfected BRCA1 wild‐type and mutant MDA‐MB 231 and 436 breast cancer cells are shown.
Similar articles
-
Poly(ADP-ribosyl)ation by PARP1: reaction mechanism and regulatory proteins.Nucleic Acids Res. 2019 May 7;47(8):3811-3827. doi: 10.1093/nar/gkz120. Nucleic Acids Res. 2019. PMID: 30799503 Free PMC article. Review.
-
The Enigmatic Function of PARP1: From PARylation Activity to PAR Readers.Cells. 2019 Dec 12;8(12):1625. doi: 10.3390/cells8121625. Cells. 2019. PMID: 31842403 Free PMC article. Review.
-
PARP1 condensates differentially partition DNA repair proteins and enhance DNA ligation.EMBO Rep. 2024 Dec;25(12):5635-5666. doi: 10.1038/s44319-024-00285-5. Epub 2024 Nov 4. EMBO Rep. 2024. PMID: 39496836 Free PMC article.
-
PARP inhibitors trap PARP2 and alter the mode of recruitment of PARP2 at DNA damage sites.Nucleic Acids Res. 2022 Apr 22;50(7):3958-3973. doi: 10.1093/nar/gkac188. Nucleic Acids Res. 2022. PMID: 35349716 Free PMC article.
-
Phosphatase 1 Nuclear Targeting Subunit Mediates Recruitment and Function of Poly (ADP-Ribose) Polymerase 1 in DNA Repair.Cancer Res. 2019 May 15;79(10):2526-2535. doi: 10.1158/0008-5472.CAN-18-1673. Epub 2019 Feb 7. Cancer Res. 2019. PMID: 30733193 Free PMC article.
Cited by
-
Human PARP1 substrates and regulators of its catalytic activity: An updated overview.Front Pharmacol. 2023 Feb 23;14:1137151. doi: 10.3389/fphar.2023.1137151. eCollection 2023. Front Pharmacol. 2023. PMID: 36909172 Free PMC article. Review.
-
A computational model of the DNA damage-induced IKK/ NF-κB pathway reveals a critical dependence on irradiation dose and PARP-1.iScience. 2023 Sep 14;26(10):107917. doi: 10.1016/j.isci.2023.107917. eCollection 2023 Oct 20. iScience. 2023. PMID: 37817938 Free PMC article.
-
Glutamine and serum starvation alters the ATP production, oxidative stress, and abundance of mitochondrial RNAs in extracellular vesicles produced by cancer cells.Sci Rep. 2024 Oct 28;14(1):25815. doi: 10.1038/s41598-024-73943-2. Sci Rep. 2024. PMID: 39468126 Free PMC article.
-
PARP1 mediated PARylation contributes to myogenic progression and glucocorticoid transcriptional response.Cell Death Discov. 2023 Apr 22;9(1):133. doi: 10.1038/s41420-023-01420-2. Cell Death Discov. 2023. PMID: 37087471 Free PMC article.
-
The Complex Network of ADP-Ribosylation and DNA Repair: Emerging Insights and Implications for Cancer Therapy.Int J Mol Sci. 2023 Oct 9;24(19):15028. doi: 10.3390/ijms241915028. Int J Mol Sci. 2023. PMID: 37834477 Free PMC article. Review.
References
-
- Babst M, Odorizzi G, Estepa EJ, Emr SD (2000) Mammalian tumor susceptibility gene 101 (TSG101) and the yeast homologue, Vps23p, both function in late endosomal trafficking. Traffic 1: 248–258 - PubMed
-
- Blessing C, Mandemaker IK, Gonzalez‐Leal C, Preisser J, Schomburg A, Ladurner AG (2020) The oncogenic helicase ALC1 regulates PARP inhibitor potency by trapping PARP2 at DNA breaks. Mol Cell 80: 862–875.e6 - PubMed
Publication types
MeSH terms
Substances
LinkOut - more resources
Full Text Sources
Other Literature Sources
Miscellaneous
