. 2022 Nov;46(11):2025-2040.
doi: 10.1111/acer.14944. Epub 2022 Sep 30.

Analysis of alcohol use, consumption of micronutrient and macronutrients, and liver health in the 2017-2018 National Health and Nutrition Examination Survey

Affiliations

Analysis of alcohol use, consumption of micronutrient and macronutrients, and liver health in the 2017-2018 National Health and Nutrition Examination Survey

Jeffrey B Warner et al. Alcohol Clin Exp Res. 2022 Nov.

Abstract

Background: Alcohol use is a major global healthcare burden that contributes to numerous adverse health outcomes, including liver disease. Many factors influence individual susceptibility to alcohol-associated diseases, including nutritional factors. The objective of the current study was to examine inter-relations among alcohol, dietary micronutrients and macronutrient consumption, and liver health by analyzing data from the 2017-2018 National Health and Nutrition Examination Survey (NHANES).

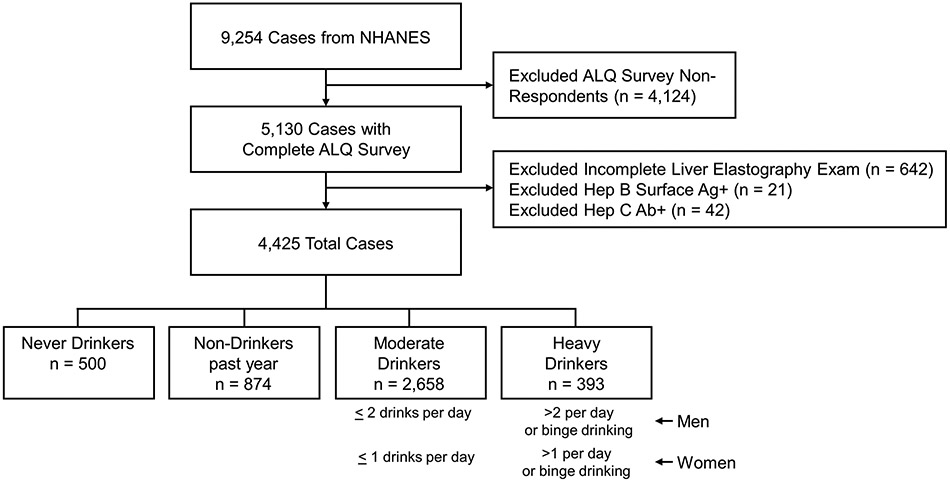
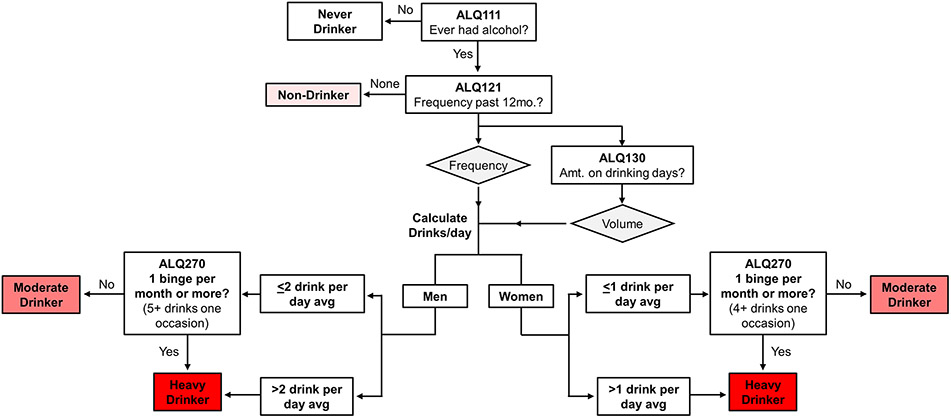
Methods: Based on self-reported alcohol consumption, NHANES respondents were assigned to one of four categories: never drinkers (lifetime abstainers), non-drinkers (past-year abstainers), moderate drinkers (1/2 drinks per day for females/males, respectively), and heavy drinkers (>1/>2 drinks per day for females/males, respectively, and/or frequent binge drinking). Survey-weighted regression analyses (adjusted for gender, age, race, education, and body mass index) were performed to examine associations between alcohol intake, dietary, and liver health characteristics.

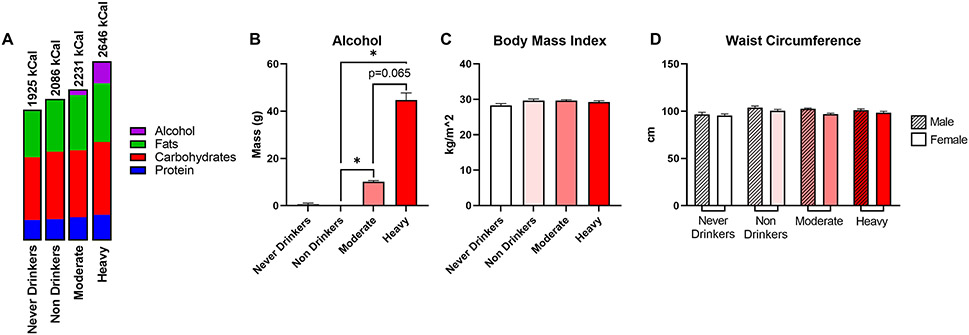
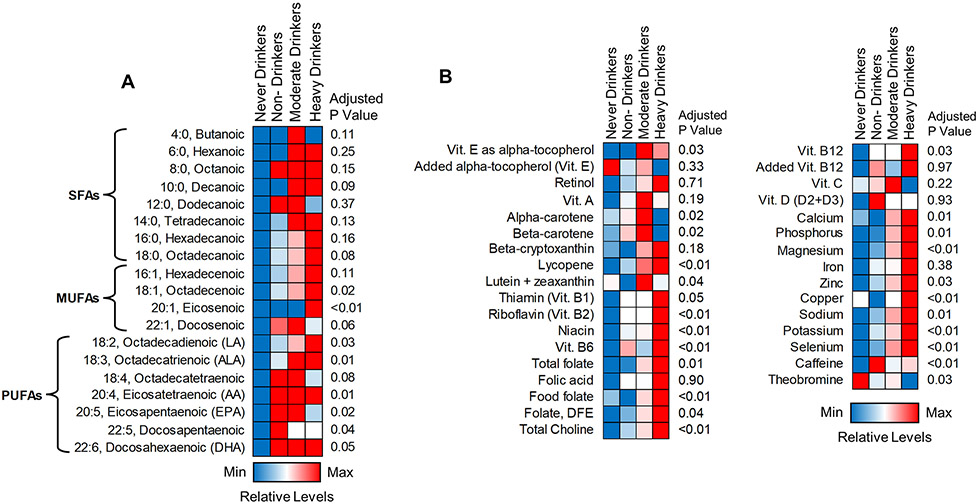
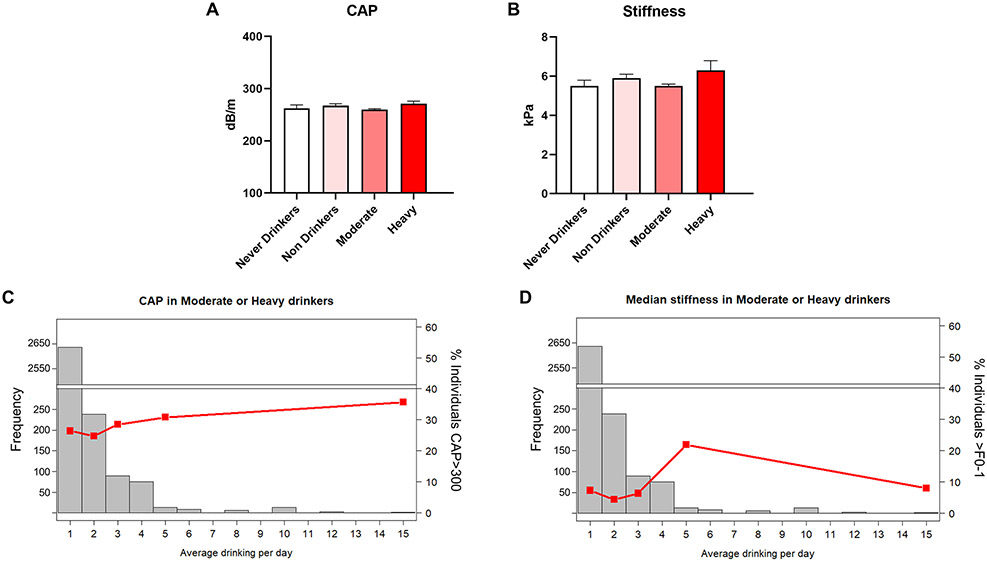
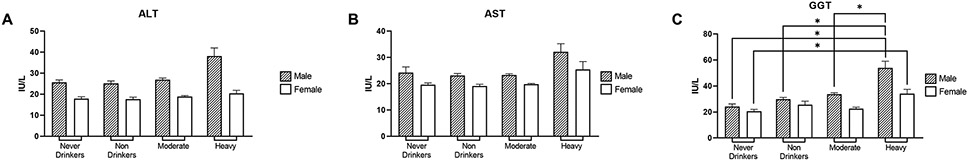
Results: Individuals categorized as heavy drinkers were significantly younger, most often well-educated males with low incidences of diabetes and other comorbidities. They consumed the most overall calories and various micronutrients, indicating a diet that was not necessarily nutrient poor. Neither moderate nor heavy drinkers had liver steatosis or fibrosis as measured by liver elastography, although heavy drinkers had modestly elevated plasma biomarkers of liver injury, including ALT, AST, and GGT, compared with the other groups.

Conclusions: Our findings suggest that the category of heavy drinkers in the 2017-2018 NHANES consisted of generally healthy individuals with high-energy intake and no evidence of liver steatosis or fibrosis. However, slightly increased plasma liver markers may indicate a risk of future progression to more advanced stages of liver disease over time in some individuals. Several limitations should be considered when interpreting these data, including the potential misclassification of drinking categories and the lack of standardized cutoff scores for fatty liver as assessed by elastography, among others.

Keywords: National Health and Nutrition Examination Survey; alcohol consumption; dietary macronutrients and micronutrients; liver health and disease.


Conflict of interest statement

Conflicts of Interest Statement

The authors declare no conflicts of interest.

Figures

Figure 1.
Figure 1.
Establishment of respondent sample population. Of the 9,254 total NHANES survey participants, we excluded individuals who did not participate in the Alcohol Use Questionnaire, individuals with a partial elastography exam, and individuals with a positive hepatitis B surface antigen or hepatitis C antibody status. Following these exclusion criteria, 4,425 total survey respondents remained, comprising our final sample population. Abbreviations: Ab, antibody; Ag, antigen; ALQ, Alcohol Use Questionnaire; Hep B, hepatitis B; Hep C, hepatitis C; NHANES, National Health and Nutrition Examination Survey.
Figure 2.
Figure 2.
Schematic of strategy to categorize included respondents into drinking categories based on the NHANES ALQ. NHANES respondents who completed the ALQ were categorized into drinking groups based on questionnaire responses. Never drinkers were individuals who denied consumption of alcohol in their lifetime, excluding small sips (ALQ111). Non-drinkers were those who reported consumption of alcohol in their lifetime but denied alcohol use in the past year (ALQ121). Of the respondents who reported alcohol use within the past year, women and men with a daily average of ≤ 1 or ≤ 2 drinks, respectively, were considered moderate drinkers as calculated based on responses to ALQ121 and ALQ130. Heavy drinkers were any individuals with one or more self-reported binge drinking episodes per month (ALQ270) and individuals exceeding the daily average consumption limits for moderate drinking. Abbreviations: ALQ, Alcohol Use Questionnaire; avg, average; d, day; NHANES, National Health and Nutrition Examination Survey.
Figure 3.
Figure 3.
Distribution of volume of alcohol consumption in heavy drinkers. (A and B) Frequency distribution of average daily standard drink consumption for men and women, respectively.
Figure 4.
Figure 4.
Characterization of macronutrient intake and anthropometric variables between respondent groups. (A) Overview of daily energy intake with percentage of kcal from carbohydrates, fat, protein, and alcohol. (B) Average daily alcohol consumption as reported in the 24-hour dietary recall data, not data obtained from the alcohol use questionnaire. (C) Body mass index. (D) Waist circumference by gender. Data are presented as weighted mean value ± SEM. All data and associated p values were adjusted for gender, age, race, education, and BMI using multivariate analysis. Abbreviations: cm, centimeters; g, grams; kcal, kilocalories; kg, kilogram, m, meter.
Figure 5.
Figure 5.
Visualization of fatty acid and micronutrient intake between respondent groups. (A) Heatmap showing daily intake trends in individual dietary fatty acids. (B) Heatmap showing daily intake of individual micronutrients. Colors represent relative consumption levels, with red being the maximum level and red being the minimum level for each individual variable. All data and associated p values were adjusted for gender, age, race, education, and BMI using multivariate analysis. Abbreviations: ANOVA, analysis of variance; DFE, dietary food equivalents; MFAs, monounsaturated fatty acids; PUFAs, polyunsaturated fatty acids; SFAs, saturated fatty acids; vit., vitamin.
Figure 6.
Figure 6.
Characterization of liver steatosis and fibrosis. (A) Liver CAP score. (B) Liver stiffness. (C-D) Liver steatosis and fibrosis in heavy drinkers with increasing average daily alcohol consumption in standard drinks, respectively. Histogram bars represent frequency of individuals in each bin (left Y axis), lines represent percent of individuals exceeding a CAP of 300 dB/m or a stiffness measurement of 8.6 kPa (right Y axes), respectively. Data are presented as weighted mean value ± SEM. All data and associated p values were adjusted for gender, age, race, education, and BMI using multivariate analysis. Abbreviations: CAP, controlled attenuation parameter; dB, decibel; GGT, gamma-glutamyl transferase; kPa, kilopascal; m, meter.
Figure 7.
Figure 7.
Characterization of liver injury markers. (A-C) Plasma levels of liver injury biomarkers ALT, AST, and GGT, respectively, by gender. Data are presented as weighted mean value ± SEM. All data and associated p values were adjusted for gender, age, race, education, and BMI using multivariate analysis. Abbreviations: ALT, alanine aminotransferase; AST, aspartate aminotransferase; GGT, gamma-glutamyl transferase; IU, international unit; L, liter.

References

    1. Aberg F, Helenius-Hietala J, Puukka P, Jula A (2017) Binge drinking and the risk of liver events: A population-based cohort study. Liver Int 37:1373–1381. - PubMed
    1. Alatalo PI, Koivisto HM, Hietala JP, Puukka KS, Bloigu R, Niemela OJ (2008) Effect of moderate alcohol consumption on liver enzymes increases with increasing body mass index. Am J Clin Nutr 88:1097–1103. - PubMed
    1. Anstee QM, Daly AK, Day CP (2015) Genetics of Alcoholic Liver Disease. Semin Liver Dis 35:361–374. - PubMed
    1. Askgaard G, Gronbaek M, Kjaer MS, Tjonneland A, Tolstrup JS (2015) Alcohol drinking pattern and risk of alcoholic liver cirrhosis: a prospective cohort study. J Hepatol 62:1061–1067. - PubMed
    1. Barve S, Chen SY, Kirpich I, Watson WH, McClain C (2017) Development, Prevention, and Treatment of Alcohol-Induced Organ Injury: The Role of Nutrition. Alcohol Res 38:289–302. - PMC - PubMed

Publication types