Review
. 2022 Sep 19;7(9):653-662.
doi: 10.1530/EOR-22-0051.

A systematic approach to CT evaluation of non-arthritic hip pain

Affiliations
Review

A systematic approach to CT evaluation of non-arthritic hip pain

Andrew J Curley et al. EFORT Open Rev. .

Abstract

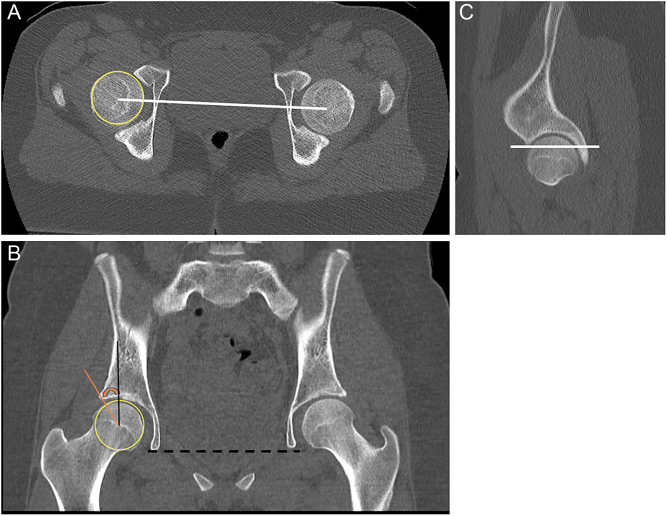
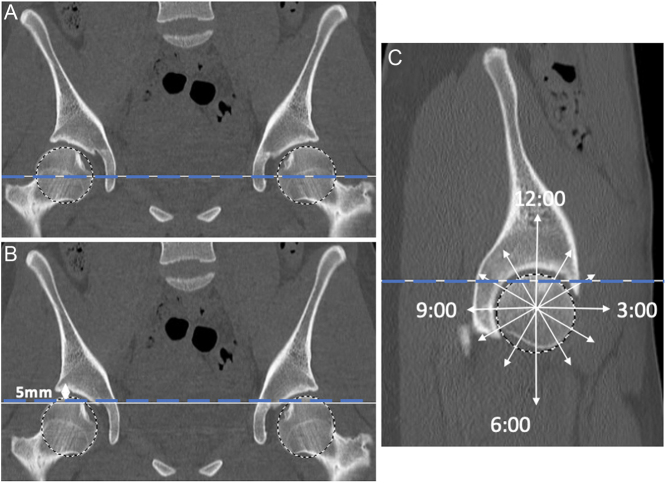
Bone morphology has been increasingly recognized as a significant variable in the evaluation of non-arthritic hip pain in young adults. Increased availability and use of multidetector CT in this patient population has contributed to better characterization of the osseous structures compared to traditional radiographs. Femoral and acetabular version, sites of impingement, acetabular coverage, femoral head-neck morphology, and other structural abnormalities are increasingly identified with the use of CT scan. In this review, a standard CT imaging technique and protocol is discussed, along with a systematic approach for evaluating pelvic CT imaging in patients with non-arthritic hip pain.

Keywords: computed tomography; femoroacetabular impingement; hip/thigh/pelvis.


Conflict of interest statement

The authors declare that there is no conflict of interest that could be perceived as prejudicing the impartiality of the research reported.

Figures

Figure 1
Figure 1
Definition of hip center and horizontal axis. The center of the femoral head is determined by a localizer placed at the center of the best fit circle of the femoral head on the axial or coronal image and referenced by scout lines on all axial, sagittal, and coronal planes (white lines seen on A and C). The best fit circle is then drawn on the coronal image determined by center of the femoral head referenced by the remaining planes (yellow circle on the right femoral head on B). The horizontal line touching both the teardrops (black dotted line) on the coronal image makes the transverse line required for the Wiberg center edge angle (W-CEA) and Tönnis angle measurements. W-CEA angle is measured on a single coronal reformatted image (B) where the best fit circle is drawn (yellow circle) determined by the center of the femoral head referenced from all the planes (A, C). The vertical line (black line) is 90° to the inter-teardrop horizontal line (black dotted line) on the same image, and the W-CEA is measured up to the lateral margin of the acetabular sourcil (orange angle). Acetabular landmarks noted at the geometric center of the femoral head (A) and at a point 5 mm caudal to the acetabular dome (B). Image C shows the 5 mm caudal line on the sagittal sequences. This line commonly intercepts the acetabulum at 1:30 when viewing the acetabulum as a clock face.
Figure 2
Figure 2
Definition of central and cranial acetabular measurement locations. Acetabular landmarks noted at the geometric center of the femoral head (A) and at a point 5 mm caudal to the acetabular dome (B). Image C shows the 5 mm caudal line on the sagittal sequences. This line commonly intercepts the acetabulum at 1:30 when viewing the acetabulum as a clock face.
Figure 3
Figure 3
Calculation of cranial and central acetabular version.
Figure 4
Figure 4
Center edge angle (CEA) measurements at bone-edge and sourcil-edge. Sagittal slice through the center of the femoral head (A), with a transverse blue line depicting the cranial position 5 mm below the acetabular dome that aligns with the sourcil edge. The red line at 12:00 depicts the location of the CEA at the bone-edge (B), whereas the green line correlates with the typical location between 1:00 and 2:00 of CEA at the sourcil-edge (C) as demonstrated by Wylie et al. (29). Anteroposterior hip radiograph (D) demonstrating the locations of the bone-edge (red line) and sourcil-edge relative to a vertical reference line (black line). According to the Lisbon Agreement (16, 17, 18), the Wiberg center edge angle (W-CEA) would measure the sourcil-edge (D, green line);, whereas the lateral center edge (L-CEA) would utilize the bone-edge (D, red line).
Figure 5
Figure 5
Acetabular sector angle measurements at cranial (A) and central (B) acetabulum. Anterior acetabular sector angle (AASA), posterior acetabular sector angle (PASA), and horizontal acetabular sector angle (HASA).
Figure 6
Figure 6
Radial reformatted CT slices for each clockface position on the acetabulum as described by Larson et al. (31). These images can be used to calculate a local coverage percentage (C%) from the circumferential portion of the acetabular roof, which can be determined as angle (θ) from the horizontal axis (green line) to the acetabular rim border point (red line). Local coverage percentage is calculated from the equation: C% = θ/180° × 100.
Figure 7
Figure 7
Anterior inferior iliac spine (AIIS) morphology classification as defined by Hetsroni et al. (34). The most inferior aspect of the AIIS is located above (Type I), at the same level (Type II), or below (Type III) the acetabular rim.
Figure 8
Figure 8
Radial plane images are reformatted circumferentially around the center of the femoral neck axis, allowing for evaluation of the femoral head–neck junction at each location on the clock face.
Figure 9
Figure 9
Femoral version measurement (A) as described by Murphy et al. (43). Axial slices are used to identify the femoral neck axis (green line), drawn from a line connecting the center of the femoral head depicted by the blue dot (B) and base of the femoral neck (C). An additional slice through the distal femur (D) is used to identify the posterior femoral condylar axis (yellow line). Femoral version is calculated as the summation of the angles created by the femoral neck axis and posterior condylar axis, relative to a horizontal reference line (red line).
Figure 10
Figure 10
Measurement of functional antetorsion, posterior tilt, and posterior translation as described by Batailler et al. (47). The greater axis of the greater trochanter (teal line) connects the anterior (point A) and posterior aspects of the greater trochanter, with the midpoint of this line depicted by point G. The femoral neck axis (green line) connects the center of the femoral head (blue dot) and base of the femoral neck (yellow dot), intersecting the greater axis of the greater trochanter at point N. Posterior tilt (red arrow) is the angle between the femoral neck axis and the greater axis of the greater trochanter. Posterior translation is the ratio of lines AN to AG (AN/AG). Functional antetorsion is measured by the difference between the posterior condylar axis and a line connecting the center of the femoral head with the center of the greater axis of the greater trochanter (red line). While these images are demonstrated on 3D reconstructions for clarity, the measurements are performed on an axial slice through the top of the greater trochanter.
Figure 11
Figure 11
Virtual software, utilizing data from CT imaging, can be utilized for preoperative surgical planning of peri-acetabular osteotomies.

Similar articles

References

    1. Ganz R, Parvizi J, Beck M, Leunig M, Nötzli H, Siebenrock KA. Femoroacetabular impingement: a cause for osteoarthritis of the hip. Clinical Orthopaedics and Related Research 2003417112–120. (10.1097/01.blo.0000096804.78689.c2) - DOI - PubMed
    1. Beck M, Kalhor M, Leunig M, Ganz R. Hip morphology influences the pattern of damage to the acetabular cartilage: femoroacetabular impingement as a cause of early osteoarthritis of the hip. Journal of Bone and Joint Surgery: British Volume 2005871012–1018. (10.1302/0301-620X.87B7.15203) - DOI - PubMed
    1. Murphy SB, Ganz R, Müller ME. The prognosis in untreated dysplasia of the hip. A study of radiographic factors that predict the outcome. Journal of Bone and Joint Surgery: American Volume 199577985–989. (10.2106/00004623-199507000-00002) - DOI - PubMed
    1. Mintz DN, Hooper T, Connell D, Buly R, Padgett DE, Potter HG. Magnetic resonance imaging of the hip: detection of labral and chondral abnormalities using noncontrast imaging. Arthroscopy 200521385–393. (10.1016/j.arthro.2004.12.011) - DOI - PubMed
    1. Edwards DJ, Lomas D, Villar RN. Diagnosis of the painful hip by magnetic resonance imaging and arthroscopy. Journal of Bone and Joint Surgery: British Volume 199577374–376. (10.1302/0301-620X.77B3.7744918) - DOI - PubMed

LinkOut - more resources