

Functional platelet-derived mitochondria induce the release of human neutrophil microvesicles
- PMID: 36125343
- PMCID: PMC9638873
- DOI: 10.15252/embr.202254910
Functional platelet-derived mitochondria induce the release of human neutrophil microvesicles
Abstract
Inflammation is an essential process of host defense against infections, illness, or tissue damage. Polymorphonuclear neutrophils (PMN) are among the first immune cells involved in acute inflammatory responses and are on the front line in the fight against bacterial infections. In the presence of bacterial fragments, PMN release inflammatory mediators, enzymes, and microvesicles in the extracellular milieu to recruit additional immune cells required to eliminate the pathogens. Recent evidence shows that platelets (PLTs), initially described for their role in coagulation, are involved in inflammatory responses. Furthermore, upon activation, PLT also release functional mitochondria (freeMitos) within their extracellular milieu. Mitochondria share characteristics with bacterial and mitochondrial damage-associated molecular patterns, which are important contributors in sterile inflammation processes. Deep sequencing transcriptome analysis demonstrates that freeMitos increase the mitochondrial gene expression in PMN. However, freeMitos do not affect the mitochondrial-dependent increase in oxygen consumption in PMN. Interestingly, freeMitos significantly induce the release of PMN-derived microvesicles. This study provides new insight into the role of freeMitos in the context of sterile inflammation.
Keywords: extracellular vesicles; freeMitos; sterile inflammation.
© 2022 The Authors.
Figures
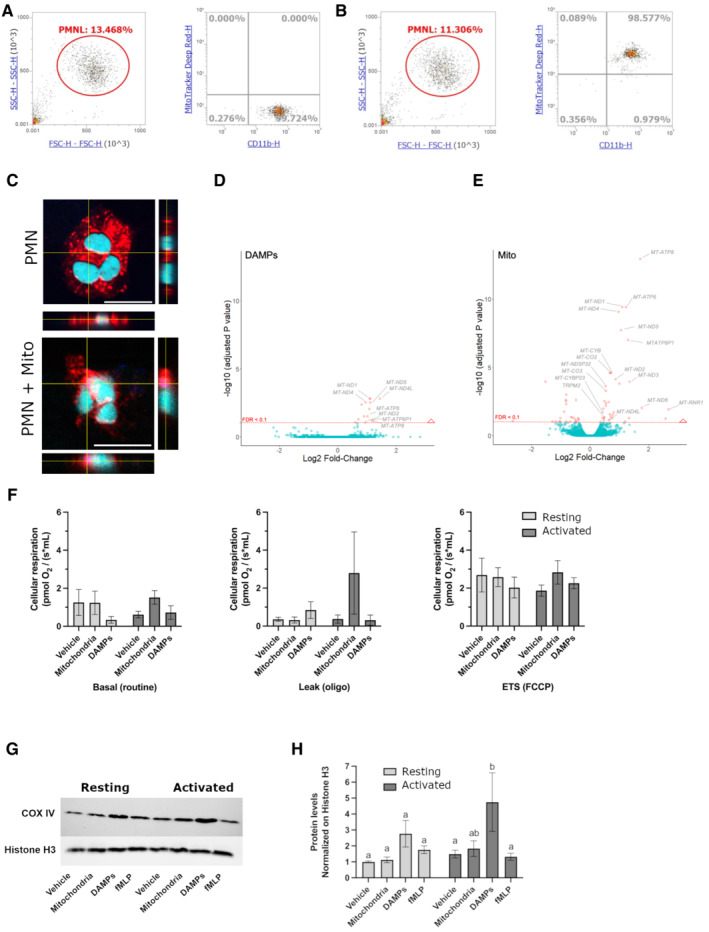
- A, B
Functional freeMitos association with PMN. Overlay dot plot population, representative of four biological replicates of the flow cytometry gating strategy used to quantify the interaction between PMN (anti‐CD11b‐PE) and freeMitos. Freshly isolated platelets were labeled with MitoTracker™ Deep Red and freeMitos isolation was subsequently performed. CD11b‐labeled PMN were incubated in absence (A) or presence (B) of freeMitos at a 1:5 ratio (PMN:mitochondria).
- C
Confocal microscopy imaging of PMN cell membrane (red) labeled with CellMask Orange in absence (upper panel) or presence (lower panel) of MitoTracker™ Deep Red‐labeled freeMitos (magenta). PMN nuclei were stained with DAPI (cyan). The white scale bars shown in the lower right of the images represent 10 μm in size.
- D, E
FreeMitos associate with PMN and modulate gene expression. Volcano plot, of four biological replicates, representing the gene expression modulation induced by mitochondrial DAMPs preparation (D) and freshly isolated functional freeMitos (E) in PMN.
- F–H
FreeMitos effect on the respiratory state of PMN. O2 consumption rates of resting or activated (incubated with TNF‐a and GM‐CSF). PMN were measured using high‐resolution O2 respirometry (Oroboros Oxygraph) and revealed no significant differences between the basal state (left panel), leak state (middle panel), and the maximum electron transport system capacity (ETS, right panel) of cellular respiration (F). Immunoblot of mitochondrial cytochrome c oxidase (COX IV) and histone H3 as a loading control of PMN after co‐incubations with freeMitos (G) with subsequent densitometry analysis (H).
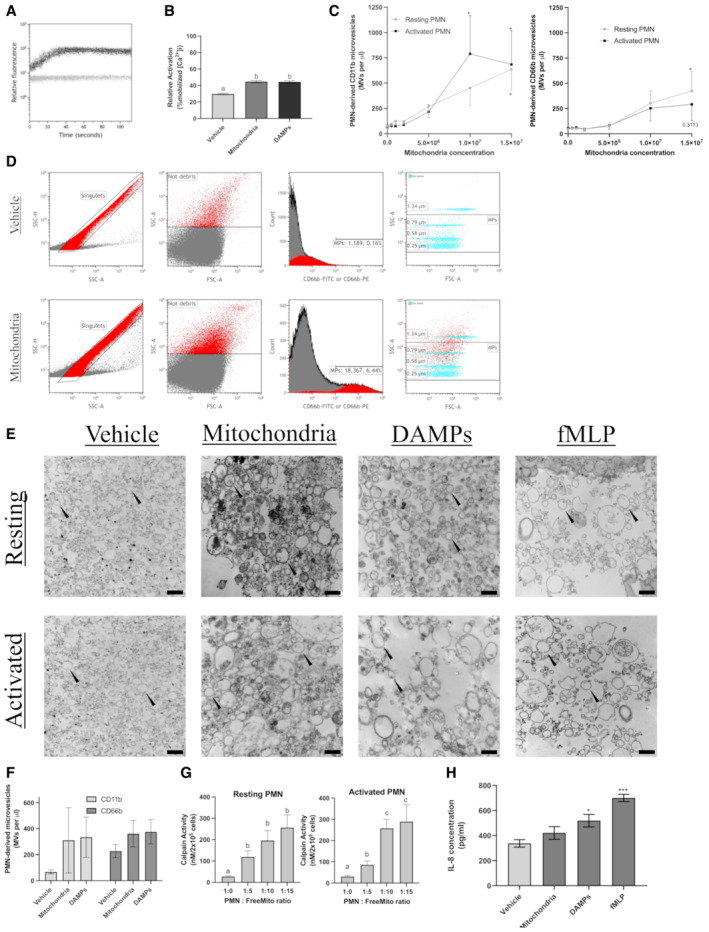
- A, B
FreeMitos induce PMN intracellular calcium release in PMN. Representative visualization of intracellular calcium monitoring by flow cytometry of 1 x 10⁶ PMN co‐incubated with 5 × 10⁶ mitochondria (A). Calcium mobilization was monitored by flow cytometry for 120 s using the fluorescent probe Fluo‐3AM. The gray line represents PMN with the vehicle (HBSS), whereas the dark line represents PMN incubated with mitochondria. PMN intracellular calcium mobilization induced by either the vehicle (HBSS), freeMitos or mitochondrial DAMPs and quantified by flow cytometry (B).
- C–F
Functional freeMitos induce the release of PMN‐derived microvesicles. A dose–response analysis of various mitochondria to PMN ratios was performed to measure the release of PMN microvesicles. PMN microvesicles labeling was performed with either anti‐CD66b‐FITC labeling (C, left panel) or anti‐CD11b‐PE (C, right panel). PMN‐derived microparticle gating strategy is shown in panel D. Flow cytometry panel established to distinguish the PMNL‐MVs from the background using the leukocyte‐specific integrin alpha‐M beta‐2 (CD11b), the granulocyte‐specific carcinoembryonic antigen‐related cell adhesion molecule 8 (CD66b), and size reference beads. PMN were either incubated with the vehicle (Tyrode's Buffer, upper panels) or freeMitos (lower panels). Following co‐incubation, PMN were washed twice and resuspended in HBSS before processing on flow cytometer. Only single events, identified by the singlets gate (left upper and lower panels) using side scatter area (SSC‐A) versus side scatter heights (SSC‐H) were analyzed. Light scatter (side scatter (SSC) and forward scatter (FSC)) approach for determining the background noise in HBSS. Histogram displaying the fluorescence intensity of samples labeled with either CD11b‐FITC or CD66b‐PE. Overlay dot plot of PMNL‐MVs population and size reference beads, representative of four biological replicates, each performed in two technical replicates.
- E
Visual confirmation of PMN and PMN‐derived microvesicles. Transmission electron microscopy (TEM) imaging of PMN‐derived microvesicles (black arrowhead), representative of three biological replicates, from resting or activated PMN (106 cells) incubated with either mitochondria, mitochondrial DAMPs or fMLP as positive control. The black scale bars are shown in the lower right of the images for the vehicles (400 nm), mitochondria (600 nm), DAMPs (600 nm), and fMLP (500 nm) conditions.
- F
Quantification of resting PMN microvesicles produced by PMN (106 cells) incubated with 107 freeMitos or 25 μg of mitochondrial DAMPs for 2 h.
- G
Quantification of calpain activity, by fluorescence assay, in cell lysate of either resting (left panel) or activated (right panel) PMN (2 × 10⁵ cells) incubated in presence of freeMitos for 2 h.
- H
ELISA quantification of IL‐8 concentrations present in the supernatant following the incubation of PMN (106 cells) with freeMitos (107), DAMPs (25 μg) or fMLP (1 μM) for 2 h.
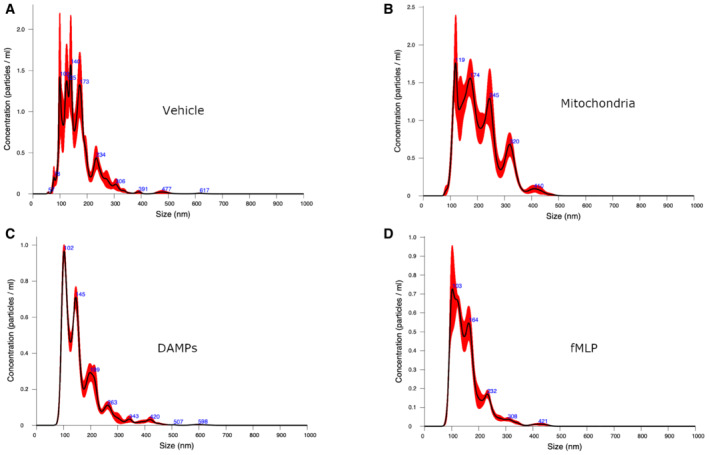
- A–D
PMN‐MVs sizing by nanoparticles tracking analysis (Nanosight) of the supernatant of PMN incubated with either the vehicle (HBSS, panel A), platelet‐derived mitochondria (panel B), platelet‐derived DAMPs (panel C) or fMLP (panel D). Data shown are representative of three biological replicates. The size distribution and concentration of MVs from PMN supernatant were measured using NanosightNS300 (Malvern Panalytical). Sample were prepared for nanoparticle tracking analysis by diluting the stock material in particle‐free water until the concentration was between 1 × 10⁸ and 1 × 10⁹ particles/ml and six videos of 30 s were captured. At least two different dilutions resulting from the stock concentration were analyzed for each sample. The screen gain was set to 10 and the camera level to 16. After capture, the videos were analyzed by the Nanosight Software v3.2 with a detection threshold of 5.
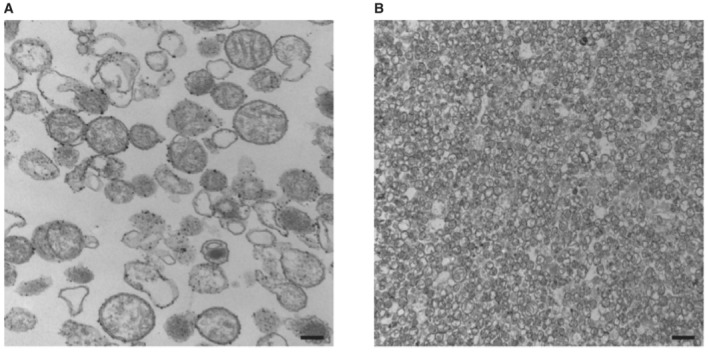
- A, B
Transmission electron microscopy imaging of our mitochondria preparation and purification as previously reported (Léger et al, 2020, 2021). The black scale bars shown in the lower right of panels (A) and (B) represent sizes of 200 nm and 1 μm, respectively.
References
-
- Aatonen M, Grönholm M, Siljander PR‐M (2012) Platelet‐derived microvesicles: multitalented participants in intercellular communication. Semin Thromb Hemost 38: 102–113 - PubMed
-
- Al Amir Dache Z, Otandault A, Tanos R, Pastor B, Meddeb R, Sanchez C, Arena G, Lasorsa L, Bennett A, Grange T et al (2020) Blood contains circulating cell‐free respiratory competent mitochondria. FASEB J 34: 3616–3630 - PubMed
-
- Böyum A (1968) Isolation of leucocytes from human blood. A two‐phase system for removal of red cells with methylcellulose as erythrocyte‐aggregating agent. Scand J Clin Lab Invest Suppl 97: 9–29 - PubMed
Publication types
MeSH terms
Associated data
- Actions
Grants and funding
LinkOut - more resources
Full Text Sources
Molecular Biology Databases
