. 2022 Nov 7;221(11):e202109137.
doi: 10.1083/jcb.202109137. Epub 2022 Sep 20.

Recycling of cell surface membrane proteins from yeast endosomes is regulated by ubiquitinated Ist1

Affiliations

Recycling of cell surface membrane proteins from yeast endosomes is regulated by ubiquitinated Ist1

Kamilla M E Laidlaw et al. J Cell Biol. .

Abstract

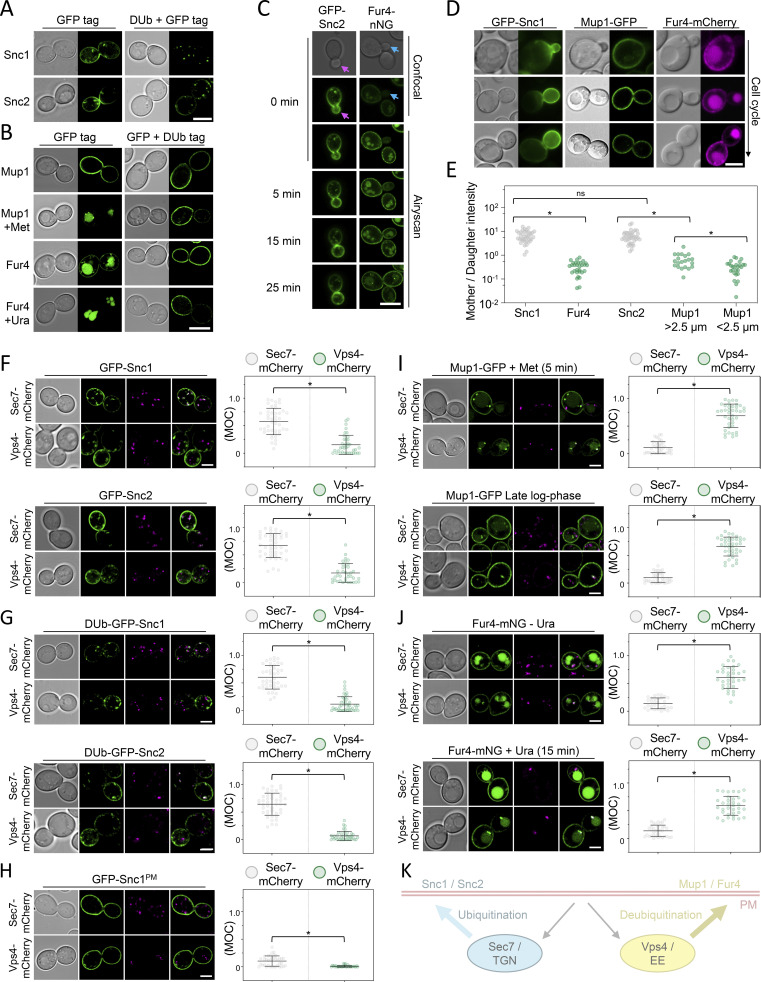
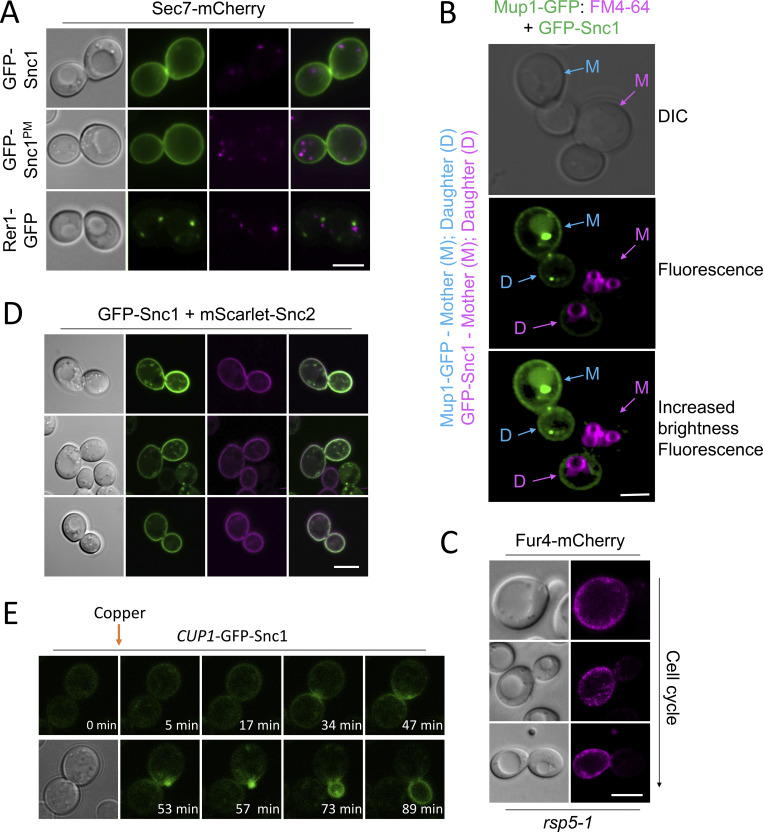
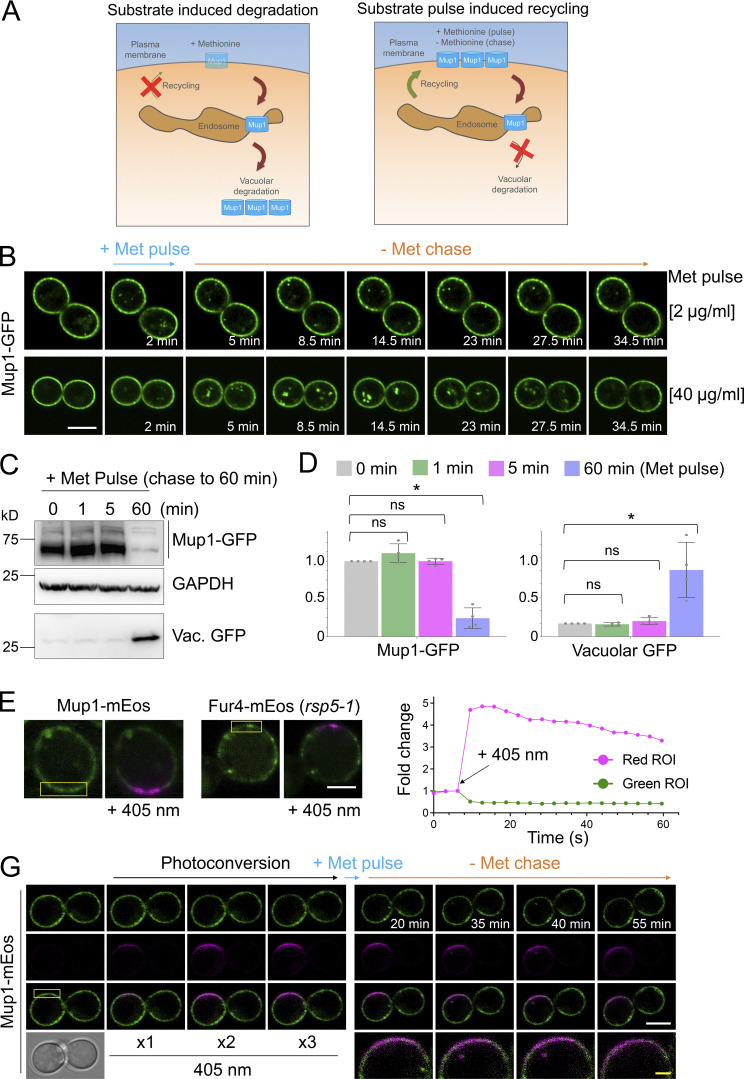
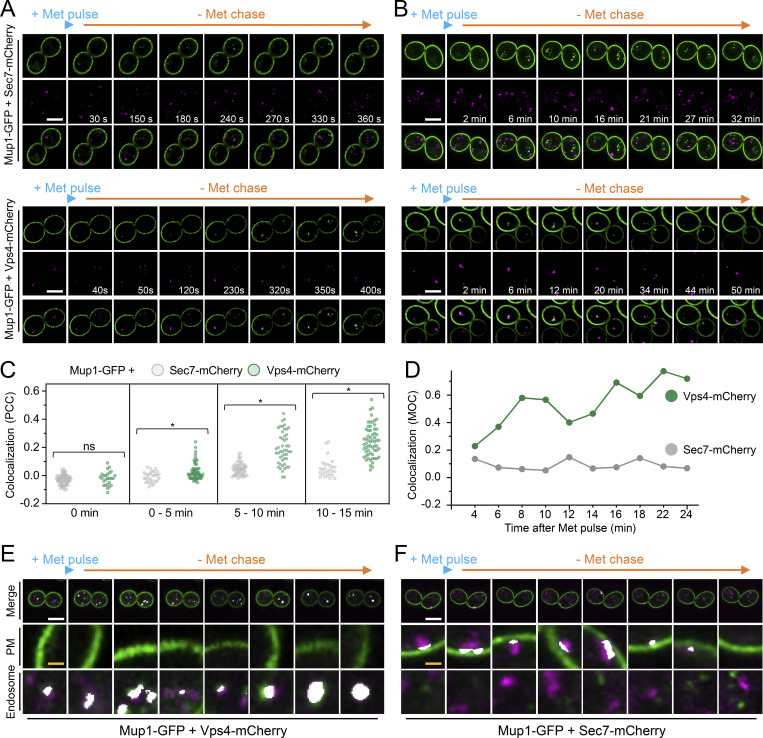
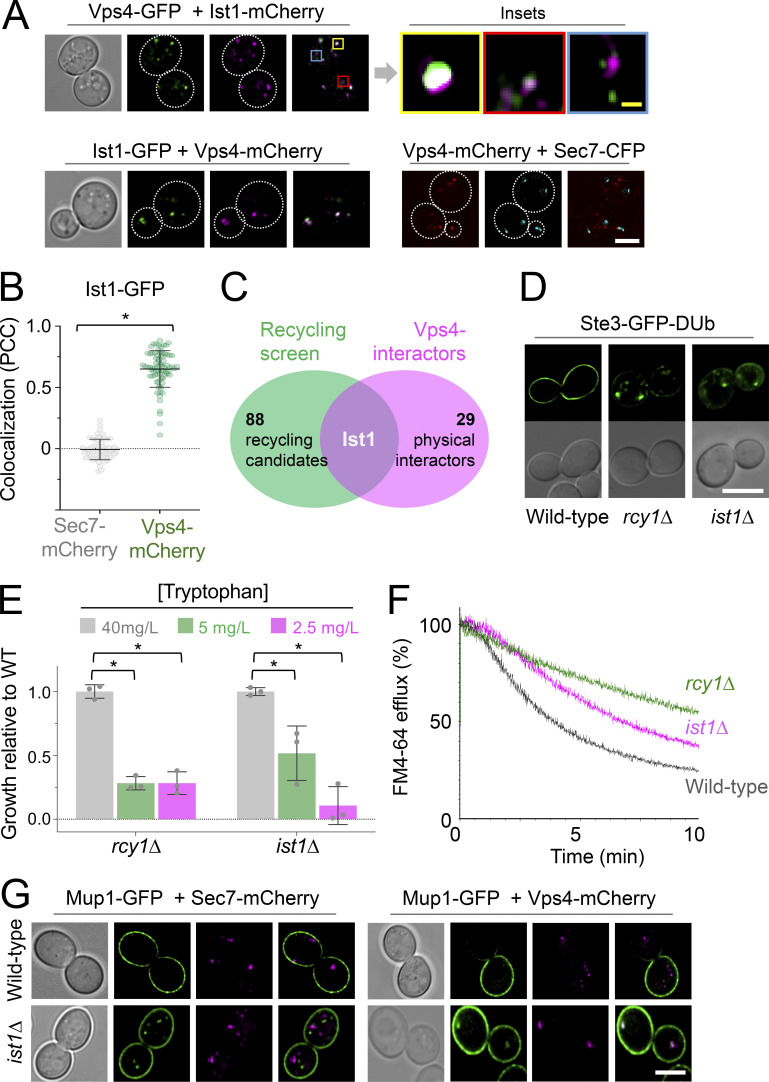
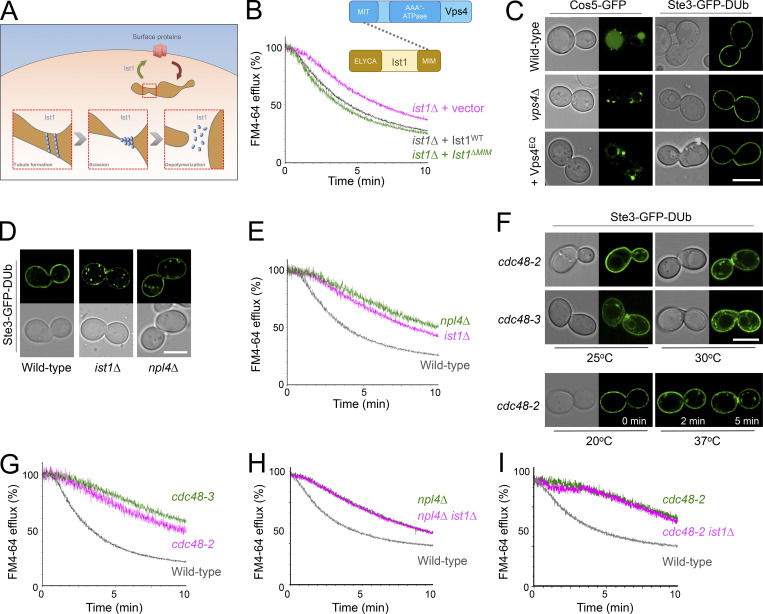
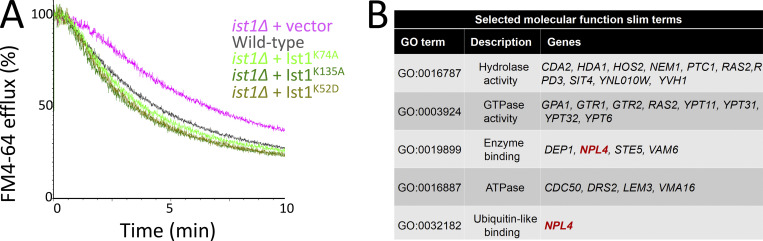
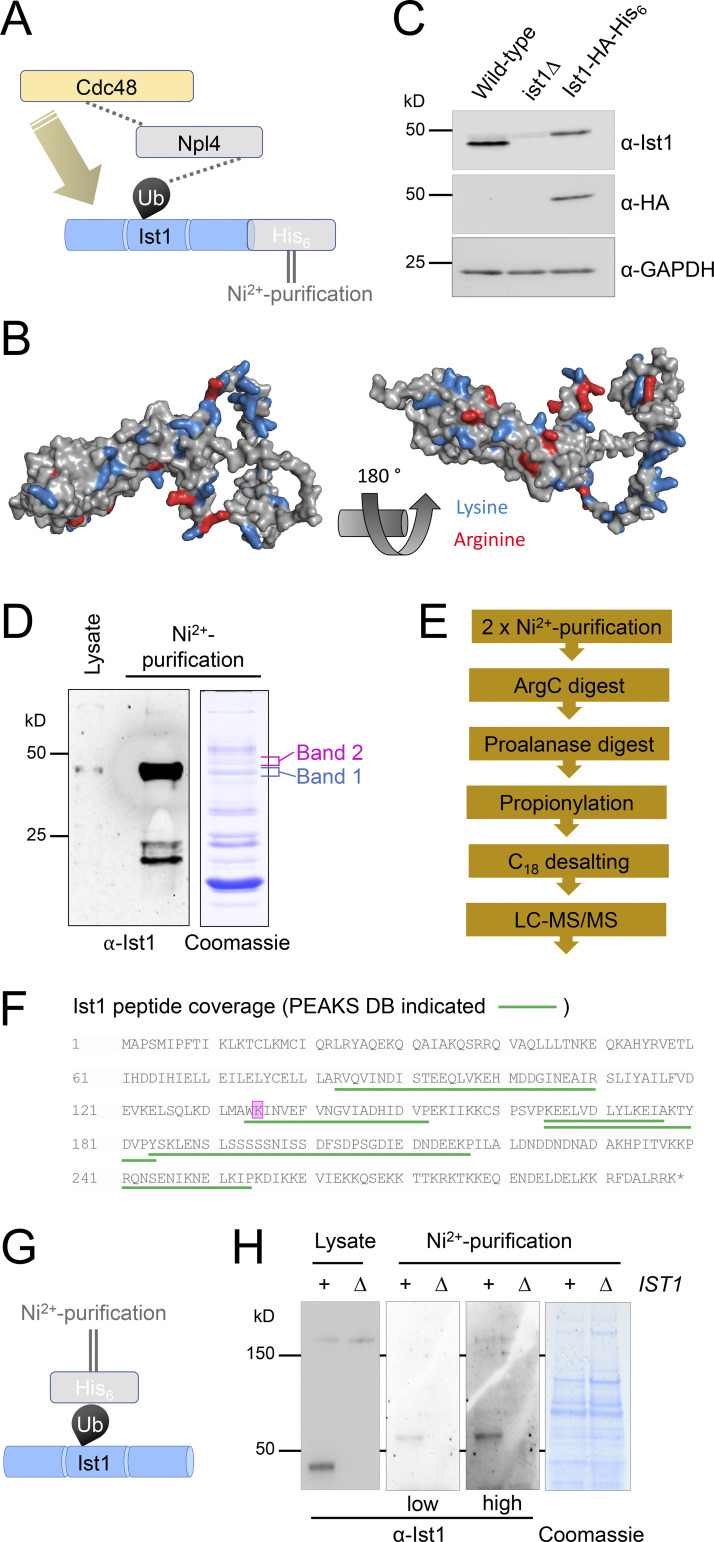
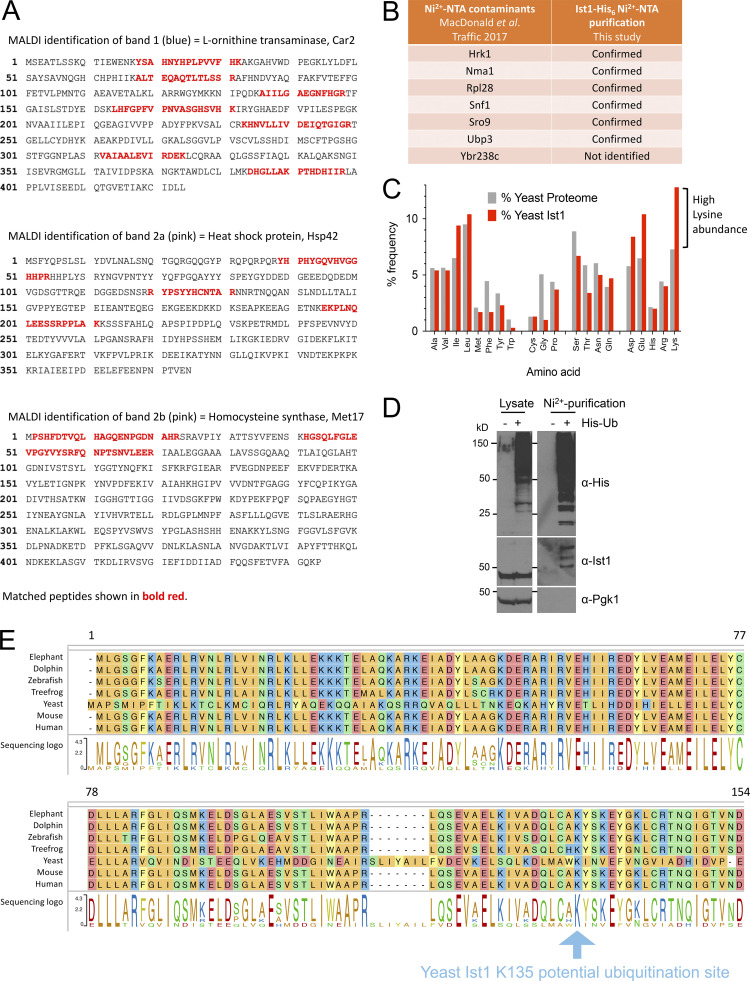
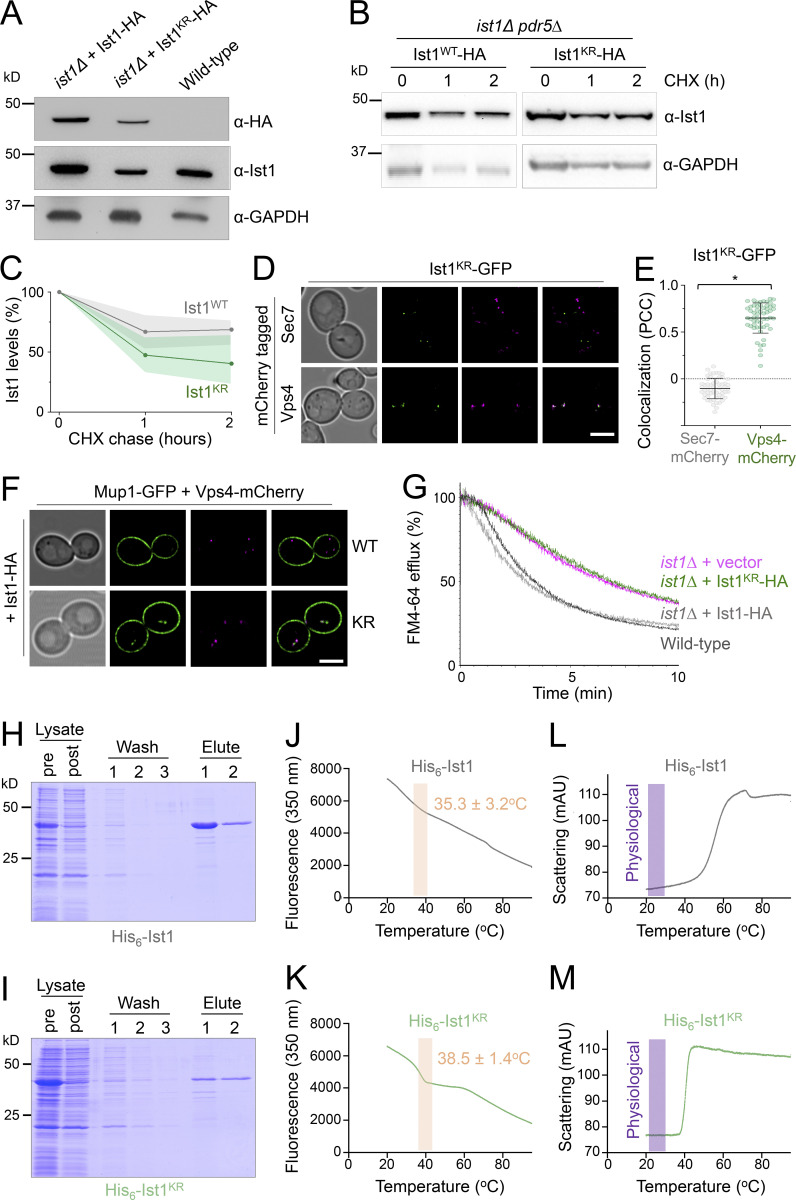
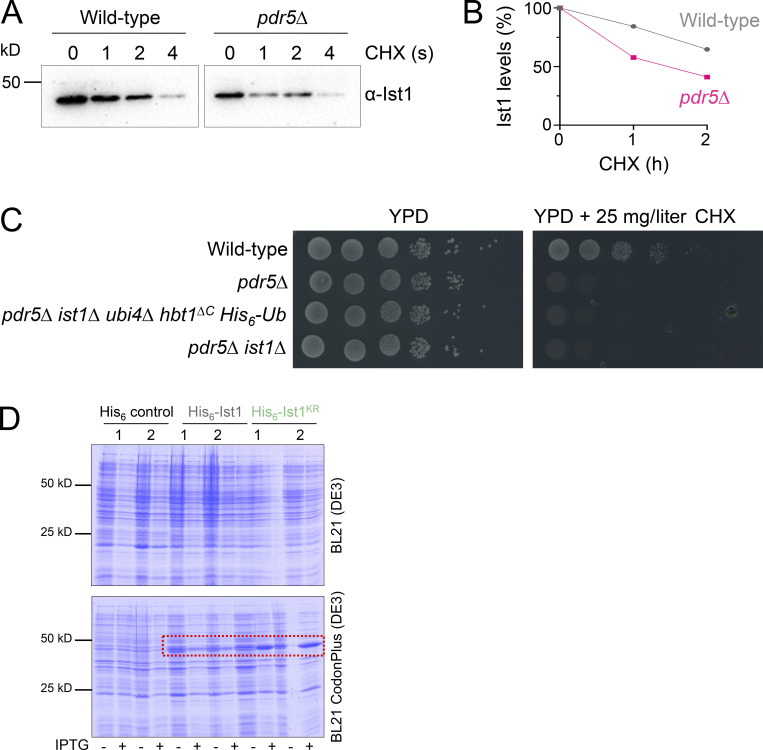
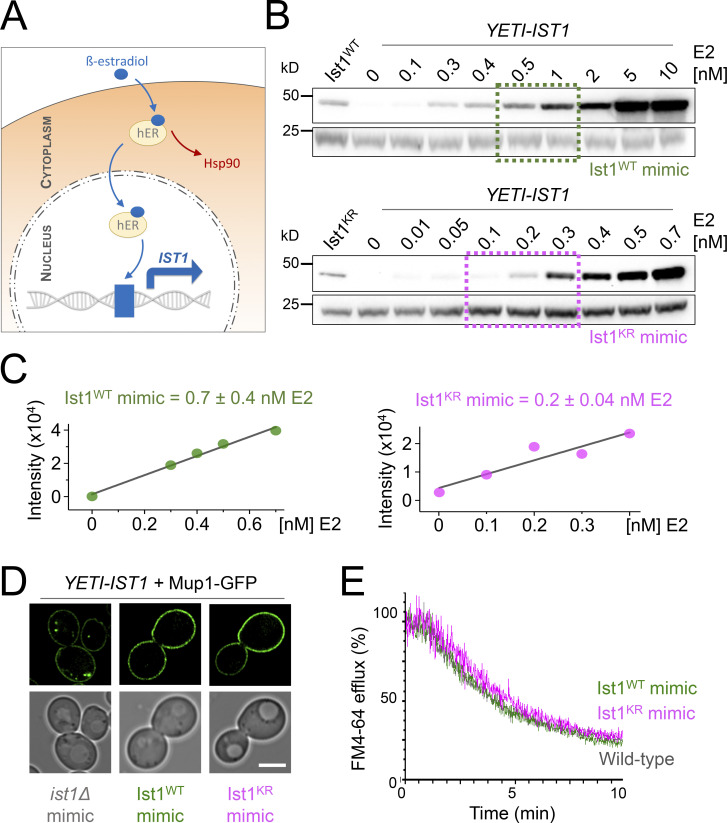
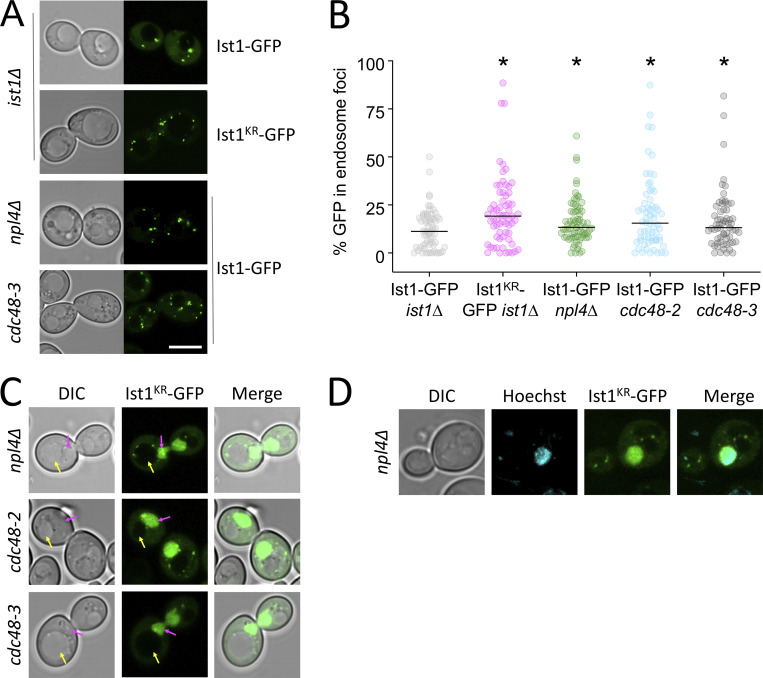
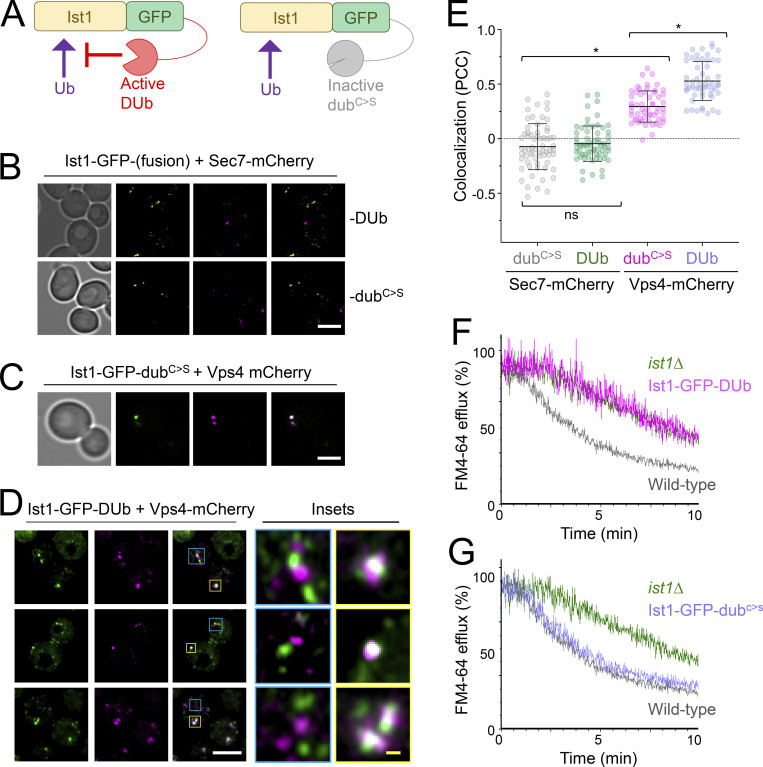
Upon internalization, many surface membrane proteins are recycled back to the plasma membrane. Although these endosomal trafficking pathways control surface protein activity, the precise regulatory features and division of labor between interconnected pathways are poorly defined. In yeast, we show recycling back to the surface occurs through distinct pathways. In addition to retrograde recycling pathways via the late Golgi, used by synaptobrevins and driven by cargo ubiquitination, we find nutrient transporter recycling bypasses the Golgi in a pathway driven by cargo deubiquitination. Nutrient transporters rapidly internalize to, and recycle from, endosomes marked by the ESCRT-III associated factor Ist1. This compartment serves as both "early" and "recycling" endosome. We show Ist1 is ubiquitinated and that this is required for proper endosomal recruitment and cargo recycling to the surface. Additionally, the essential ATPase Cdc48 and its adaptor Npl4 are required for recycling, potentially through regulation of ubiquitinated Ist1. This collectively suggests mechanistic features of recycling from endosomes to the plasma membrane are conserved.


Figures

Figure 1.
Figure 1.
Differential trafficking features of recycling cargoes. (A) WT cells expressing Snc1 and Snc2 tagged with either GFP or a fusion of GFP with the catalytic domain of DUb UL36 (DUb + GFP) expressed from the CUP1 promoter were imaged by Airyscan microscopy. (B) Mup1 and Fur4 expressed from their endogenous promoters and fused to C-terminal GFP or GFP-DUb tags were imaged by Airyscan microscopy. Where indicated, 20 µg/ml methionine (+Met) and 40 µg/ml uracil (+Ura) were added to media 1 h prior to imaging. (C) Time-lapse microscopy of cells expressing GFP-Snc2 (left) or Fur4-mNG (right). (D and E) WT cells expressing fluorescently labeled Snc1, Mup1, and Fur4 were imaged, with example cell cycle stages depicted, and fluorescence in mother–daughter pairs quantified. *, P < 0.002. (F–J). Indicated GFP tagged cargoes were imaged by Airyscan microscopy in Sec7-mCherry (upper micrographs) or Vps4-mCherry (lower micrographs) cells, with associated jitter plots of Mander’s overlap coefficients (MOC). *, P < 0.0001 from unpaired t test. (K) Schematic summarizing distinct yeast endosomal recycling pathways. Scale bar, 5 µm.
Figure S1.
Figure S1.
Differential trafficking itineraries of SNAREs and nutrient transporters. (A) Airyscan confocal microscopy of WT cells expressing an endogenously expressed Sec7-Cherry and indicated GFP-tagged proteins plasmids show expected localizations. (B) WT cells expressing GFP-Snc1 were mixed with Mup1-GFP expressing cells previously pulse-chased with FM4-64 prior to imaging. (C) rsp5-1 cells expressing Fur4-mCherry were grown to mid-log phase in SC media and processed for confocal microscopy imaging. (D) Airyscan microscopy shows colocalization and correct localization of tagged versions of Snc1 and Snc2 expressed from the CUP1 promoter. (E) Expression of GFP-Snc1 following microfluidic addition of 20 µM copper chloride to cells during time-lapse microscopy. Scale bar, 5 µM.
Figure 2.
Figure 2.
Substrate-induced transporter recycling. (A) Cartoon of substrate-induced degradation (left) and recycling (right) of Mup1 triggered by modulation of extracellular methionine. (B) Time-lapse Airyscan microscopy of cells expressing Mup1-GFP before and after 2-min methionine (2 µg/ml, upper and 40 µg/ml, lower) pulse-chase incubations. (C) Cells expressing Mup1-GFP were incubated with 20 µg/ml methionine for 0, 1, 5, and 60 min followed by three times washes and further incubation in SC-Met up to 60 min before lysates were generated and immunoblotted. (D) Quantification of average intensity of Mup1-GFP (left) and vacuolar processed GFP (right) from methionine pulse-chase experiments from C. *, P < 0.01. (E and F) Yellow regions from cells expressing Mup1-mEos and Fur4-mEos were exposed to 405-nm laser at 0.5% to photoconvert molecules (left) and mEOS fluorescence-tracked over time before (right). (G) Time-lapse microscopy of cells expressing Mup1-mEOS following three times pulse with 0.1% 405-nm laser followed by substrate-induced recycling stimulated by 2 µg/ml methionine for 30 s. Scale bar, 5 µm (white); 1 µm (yellow). Source data are available for this figure: SourceData F2.
Figure 3.
Figure 3.
Mup1-GFP recycling occurs from a Vps4-Ist1 endosome. (A and B) 4D Airyscan microscopy of WT cells co-expressing Mup1-GFP and Sec7-mCherry (upper) and Vps4-mCherry (lower) following a 30-s 20 µg/ml methionine pulse and subsequent SC-Met chase period over short 2–4 s (A) and long 30–60 s (B) imaging intervals. (C) Quantification of Pearson’s correlation coefficients between intercellular Mup1-GFP and either Sec7-mCherry (gray) or Vps4-mCherry (green) signal from steady state images acquired at indicated times during methionine pulse-chase (n = >27 cells), *, P < 0.0001 from unpaired Student’s t test, individual values are included as jitter plot over histograms and represent n = 61–79 cells per condition. (D) Mander’s overlap coefficient between Mup1-GFP and either Sec7-mCherry (gray) or Vps4-mCherry (green) from representative real-time methionine pulse-chase imaging experiment. (E and F) Time-lapse Airyscan micrographs of Mup1-GFP and Sec7-mCherry (E) or Vps4-mCherry (F) were analyzed by Zen Black colocalization software, and regions of Manders overlap (not signal colocalization) above background that were detected are depicted in white, with zoomed-in representations of the PM and endosome. Scale bar, 5 μm (white); 0.5 μm (yellow).
Figure 4.
Figure 4.
Ist1 is required for endosomal recycling in yeast. (A) WT cells coexpressing fluorescently labeled versions of Ist1, Vps4, and Sec7 were imaged by Airyscan microscopy. Insets show variation of colocalization. (B) Pearson’s correlation coefficient’s calculated For Ist1-GFP with Sec7-mCherry (gray) and Vps4-mCherry (green). *, P < 0.002 from unpaired t test; individual values are included as jitter plots over histograms and represent n = 27–72 cells per condition. (C) Venn diagram comparing 89 recycling factors (green) with known physical interactors of Vps4 (pink). (D) Localization of stably integrated Ste3-GFP-DUb in indicated strains by Airyscan microscopy. (E) Histogram showing relative growth of rcy1∆ and ist1∆ mutants compared with WT cells across media containing indicated concentrations of tryptophan. *, P < 0.02 from unpaired t test, n = 3. (F) FM4-64 efflux measurements from WT, rcy1∆, and ist1∆ cells loaded with dye for 8 min at RT followed by three times ice-cold media washes. (G) Airyscan microscopy images of cells co-expressing Mup1-GFP and Sec7-mCherry (left) or Vps4-mCherry (right) in WT or ist1∆ cells. Scale bars, 5 µm (white); 0.5 µm (yellow).
Figure 5.
Figure 5.
Npl4-Cdc48 implicated in Ist1-mediated recycling pathway. (A) Schematic representation of model for how yeast Ist1 could drive recycling, based on studies on human IST1 that drives polymerization/scission of endosome tubules to return material to the surface. (B) Efflux measurements were recorded from ist1∆ cells transformed with either vector control or plasmids expressing Ist1WT or Ist1∆MIM loaded with FM4-64 for 8 min at RT followed by ice-cold washes. Cartoon representation of domain interaction between Vps4 and Ist1 included above. (C) Airyscan confocal microscopy of Cos5-GFP from a plasmid (left) or stably integrated Ste3-GFP-DUb (right) expressed in WT and vps4∆ cells, and also in the presence of Vps4EQ expressed from the CUP1 promoter in the presence of 100 µM copper chloride. (D) Stably integrated Ste3-GFP-DUb expressed in WT, ist1∆, and npl4∆ cells imaged by Airyscan confocal microscopy. (E) FM4-64 efflux measurements from indicated strains WT, npl4∆, and ist1∆ cells grown to mid-log phase prior to loading with dye for 8 min at RT and efflux measured after washes. (F) Stably integrated Ste3-GFP-DUb was expressed in strains haboring temperature-sensitive alleles of CDC48 (cdc48-2 and cdc48-3), grown to mid-log phase at 25°C, and imaged by Airyscan confocal microscopy directly or following a 30-min incubation at 30°C. (G–I) Efflux measurements from indicated cells were first loaded with FM4-64 for 8 min, washed three times prior to cytometry. Scale bar, 5 μm.
Figure S2.
Figure S2.
The role of Ist1 mutants, and implication of Npl4, in endosomal recycling. (A) Either WT cells or ist1∆ mutants transformed with vector (pink) or indicated Ist1 point mutations (green) were grown to mid-log phase prior to loading with dye for 8 min at RT, washing in cold media, and efflux measured by flow cytometry. (B) Table showing selected slim term annotations for recycling machinery associated with relevant enzyme activity that exhibit enrichment compared with genome-wide distribution.
Figure 6.
Figure 6.
Ist1 is ubiquitinated in vivo. (A) Simplified representation of known interactions (dotted lines) between Cdc48, Npl4, and ubiquitin (Ub). We hypothesize this Npl4-Cdc48 enzyme module functionally connects with Ist1 via Ist1 ubiquitination. (B) Alphafold structural model of yeast Ist1 with lysine (blue) and arginine (red) residues indicated. (C) Immunoblot of lysates from WT, ist1∆, and Ist1-HA-His6 strains using ⍺-Ist1, ⍺-HA, and ⍺-GAPDH antibodies. (D) Whole cell lysates were generated from cells expressing Ist1-HA-His6 and run on the same SDS-PAGE gel as 0.5% of the purified elution from 2 liters culture followed by immunoblotting using ⍺-Ist1 antibodies (left). A separate gel with 10% of purified sample was stained with Coomassie (right) and the bands excised for MS-based identification indicated. (E) Flow diagram depicting sequence of sample preparation for MS analysis of Ist1 targeted at identifying ubiquitinated peptides. (F) Ist1 amino acid sequence annotated with identified peptides (green) and potentially ubiquitinated lysine residue (pink) shown from PEAKS analysis. (G) Simplified schematic of Ni2+-NTA purification of the ubiquitome to test is Ist1 is ubiquitinated. (H) Immunoblot using ⍺-Ist1 antibodies of lysates generated from His6-ubiquitin with (+) or lacking (∆) IST1 (left). 2 liters from each of these cells was purified via Ni2+-NTA twice and analyzed by immunoblot and levels indicated by Coomassie staining of SDS-PAGE gels (right). Source data are available for this figure: SourceData F6.
Figure S3.
Figure S3.
MS and pull-down controls to show Ist1 is ubiquitinated. (A) Amino acid sequence of MALDI identified proteins Car2 (top), Hsp4 (middle), and Met17 (bottom) with matched peptide sequences annotated in bold red. (B) Table showing previously identified contaminants from yeast lacking His6 tagged proteins purified on a Ni2+-NTA column. Table also includes which contaminants were identified by MS from purification of Ist1-HA-His6. (C) Histogram depicting average amino acid percentage distribution in yeast proteome (gray) and Ist1 (red). (D) WT and His6-ubiquitin expressing cells were grown to log phase before ubiquitinated proteins were isolated from a denatured lysate on Ni2+-NTA beads. Original lysates left and purified samples (right) were analyzed by SDS-PAGE followed by immunoblot with the indicated antibodies. (E) Ist1 amino acid sequence (from residue 1–154 from S. cerevisiae yeast) alignment across species indicated with the highly conserved lysine residue at position 135 (blue arrow).
Figure 7.
Figure 7.
Lysine-less Ist1 is defective in endosomal recycling. (A) Immunoblot with indicated antibodies of lysates generated from ist1∆ cells transformed with plasmids expressing Ist1WT-HA or Ist1KR-HA from endogenous promoter, alongside WT cells. (B) Cycloheximide chase experiments using ist1∆ pdr5∆ cells expressing Ist1WT-HA or Ist1KR-HA. Cells grown to mid-log phase were then exposed to 25 mg/liter cycloheximide for the denoted time before harvesting and immunoblot with ⍺-Ist1 and ⍺-GAPDH antibodies. (C) Graph of Ist1 stability following cycloheximide chase at indicated times of Ist1WT (gray) and Ist1KR (green), with SD (n = 3) indicated with respective shaded regions. (D) Airyscan images of ist1∆ cells co-expressing Ist1KR-GFP and Sec7-mCherry (upper) or Vps4-mCherry (lower) grown to mid-log phase. (E) Associated jitter plots from D showing Pearson’s correlation coefficient. *, P < 0.0001 from unpaired t test, n = 56 cells per condition. (F) Airyscan microscopy of ist1∆ cells coexpressing Mup1-GFP, Vps4-mCherry with either Ist1WT-HA (upper) or Ist1KR-HA (lower). (G) FM4-64 efflux measurements from WT cells (dark gray) and ist1∆ mutants expressing plasmid borne copies of Ist1WT-HA (light gray), Ist1KR-HA (green) or transformed with an empty vector (pink). (H and I) Plasmids of His6-Ist1WT and His6-Ist1KR were expressed in BL21 DE3 codon optimized E. coli strain using 0.5 mM IPTG at 15°C overnight. Lysates were generated by sonication and bound to 600 μl Ni2+-NTA bed volume, followed by washing in 20 mM imidazole and elution in 500 mM imidazole. Samples were analyzed by SDS-PAGE followed by Coomassie staining, showing protein levels in lysate pre- and postbinding to beads, the material lost during washes, and the final eluted products. (J–M) Intrinsic fluorescence at 350 nm (J and K) and unfolding induced aggregation via scattering in milli-absorbance units (mAU; L and M) was measured by nanoDSF for purified His6-Ist1WT and His6-Ist1KR samples exposed to a 1°C/min heat ramp. Scale bar, 5 μm. Source data are available for this figure: SourceData F7.
Figure S4.
Figure S4.
Assessments of Ist1 stability. (A) Cycloheximide (CHX) chase experiments using WT and pdr5∆ cells grown to mid-log phase before exposure to 25 mg/l cycloheximide for denoted time before harvesting and immunoblot with ⍺-Ist1 antibodies. (B) Graph of Ist1 stability following cycloheximide chase at indicated times in WT (gray) and pdr5∆ (pink) cells. (C) Growth assays in WT, pdr5∆, pdr5∆ ist1∆ hbt1∆C His6-Ub, and pdr5∆ ist1∆ yeast strains grown to exponentially dividing phase then spotted on YPD (left) and YPD containing 25 mg/liter cycloheximide (right). (D) SDS-PAGE Coomassie stained gels of lysates from BL21(DE3) (upper) or BL21 CodonPlus(DE3) (lower) E.coli strains expressing His6 control, His6-Ist1, or His6-Ist1KR under T7 promoter control. For each plasmid, two clones are shown from lysates grown to OD600 = 0.6, which were grown 16 h at 15°C −/+ 0.5 mM IPTG.
Figure 8.
Figure 8.
Reduced levels of ubiquitinatable Ist1 are sufficient for recycling. (A) Schematic showing YETI system to regulate levels of IST1 expression. (B and C) Immunoblot depicting Ist1 levels from YETI-IST1 cells exposed to indicated β-estradiol titrations with concentrations used to mimic Ist1WT (green) and Ist1KR (pink) levels estimated with SD (n = 3) shown. (D) Airyscan microscopy of Mup1-GFP expressed in YETI-IST1 cells exposed to β-estradiol concentrations required to mimic ist1∆, Ist1WT, and Ist1KR levels for 6 h prior to imaging. (E) FM4-64 efflux measurements from WT cells and YETI-IST1 cells exposed to β-estradiol to mimic Ist1WT and Ist1KR levels prior to loading with dye for 8 min at RT. Scale bar, 5 μm. Source data are available for this figure: SourceData F8.
Figure S5.
Figure S5.
Ist1 localizations in vivo. (A) Indicated strains expressing Ist1WT-GFP and Ist1KR-GFP were imaged by Airyscan microscopy. (B) The percentage GFP signal in endosomal foci quantified as a percentage of total cellular fluorescence. (C) Ist1KR-GFP mislocalizes to the nucleus (pink arrow or Hoechst stain) in indicated mutants. (D) Airyscan microscopy used to localize indicated fluorescent proteins in WT cells. Scale bar, 5 µm.
Figure 9.
Figure 9.
Reversal of Ist1 ubiquitination inhibits endosomal recycling. (A) Schematic illustrating the strategy to fuse Ist1-GFP to an active DUb and an inactive catalytically dead (dubC>S) mutant enzyme. (B–D) Airyscan microscopy of indicated fluorescent proteins expressed in WT cells grown to exponential phase prior to imaging. Insets (D) show of colocalization and distinct foci in yellow and blue, respectively. (E) Jitter plots showing Pearson’s correlation coefficient (PCC) from imaging shown in B–D. *, P < 0.0001 from unpaired t test, n = 55–65 cells per condition. (F and G) FM4-64 efflux measurements from dye loaded to cells expressing active Ist1-GFP-DUb (F) and inactive Ist1-GFP-DUbC>S (G) fusion proteins, with profiles from WT and ist1∆ mutants included for reference. Scale bar, 5 μm (white); 0.5 μm (yellow).

Comment in

References

    1. Adell, M.A.Y., Migliano S.M., Upadhyayula S., Bykov Y.S., Sprenger S., Pakdel M., Vogel G.F., Jih G., Skillern W., Behrouzi R., et al. . 2017. Recruitment dynamics of ESCRT-III and Vps4 to endosomes and implications for reverse membrane budding. Elife. 6:e31652. 10.7554/elife.31652 - DOI - PMC - PubMed
    1. Allison, R., Edgar J.R., Pearson G., Rizo T., Newton T., Günther S., Berner F., Hague J., Connell J.W., Winkler J., et al. . 2017. Defects in ER-endosome contacts impact lysosome function in hereditary spastic paraplegia. J. Cell Biol. 216:1337–1355. 10.1083/jcb.201609033 - DOI - PMC - PubMed
    1. Allison, R., Lumb J.H., Fassier C., Connell J.W., Martin D.T., Seaman M.N.J., Hazan J., and Reid E.. 2013. An ESCRT-spastin interaction promotes fission of recycling tubules from the endosome. J. Cell Biol. 202:527–543. 10.1083/jcb.201211045 - DOI - PMC - PubMed
    1. Arita, Y., Kim G., Li Z., Friesen H., Turco G., Wang R.Y., Climie D., Usaj M., Hotz M., Stoops E.H., et al. . 2021. A genome‐scale yeast library with inducible expression of individual genes. Mol. Syst. Biol. 17:e10207. 10.15252/msb.202110207 - DOI - PMC - PubMed
    1. Azmi, I., Davies B., Dimaano C., Payne J., Eckert D., Babst M., and Katzmann D.J.. 2006. Recycling of ESCRTs by the AAA-ATPase Vps4 is regulated by a conserved VSL region in Vta1. J. Cell Biol. 172:705–717. 10.1083/jcb.200508166 - DOI - PMC - PubMed

Publication types

MeSH terms

Substances