. 2022 Nov 8;7(21):e162290.
doi: 10.1172/jci.insight.162290.

Blockade of TGF-β signaling reactivates HIV-1/SIV reservoirs and immune responses in vivo

Affiliations

Blockade of TGF-β signaling reactivates HIV-1/SIV reservoirs and immune responses in vivo

Sadia Samer et al. JCI Insight. .

Erratum in

  • Blockade of TGF-β signaling reactivates HIV-1/SIV reservoirs and immune responses in vivo.
    Samer S, Thomas Y, Araínga M, Carter C, Shirreff LM, Arif MS, Avita JM, Frank I, McRaven MD, Thuruthiyil CT, Heybeli VB, Anderson MR, Owen B, Gaisin A, Bose D, Simons LM, Hultquist JF, Arthos J, Cicala C, Sereti I, Santangelo PJ, Lorenzo-Redondo R, Hope TJ, Villinger FJ, Martinelli E. Samer S, et al. JCI Insight. 2023 Nov 22;8(22):e176882. doi: 10.1172/jci.insight.176882. JCI Insight. 2023. PMID: 37991025 Free PMC article. No abstract available.

Abstract

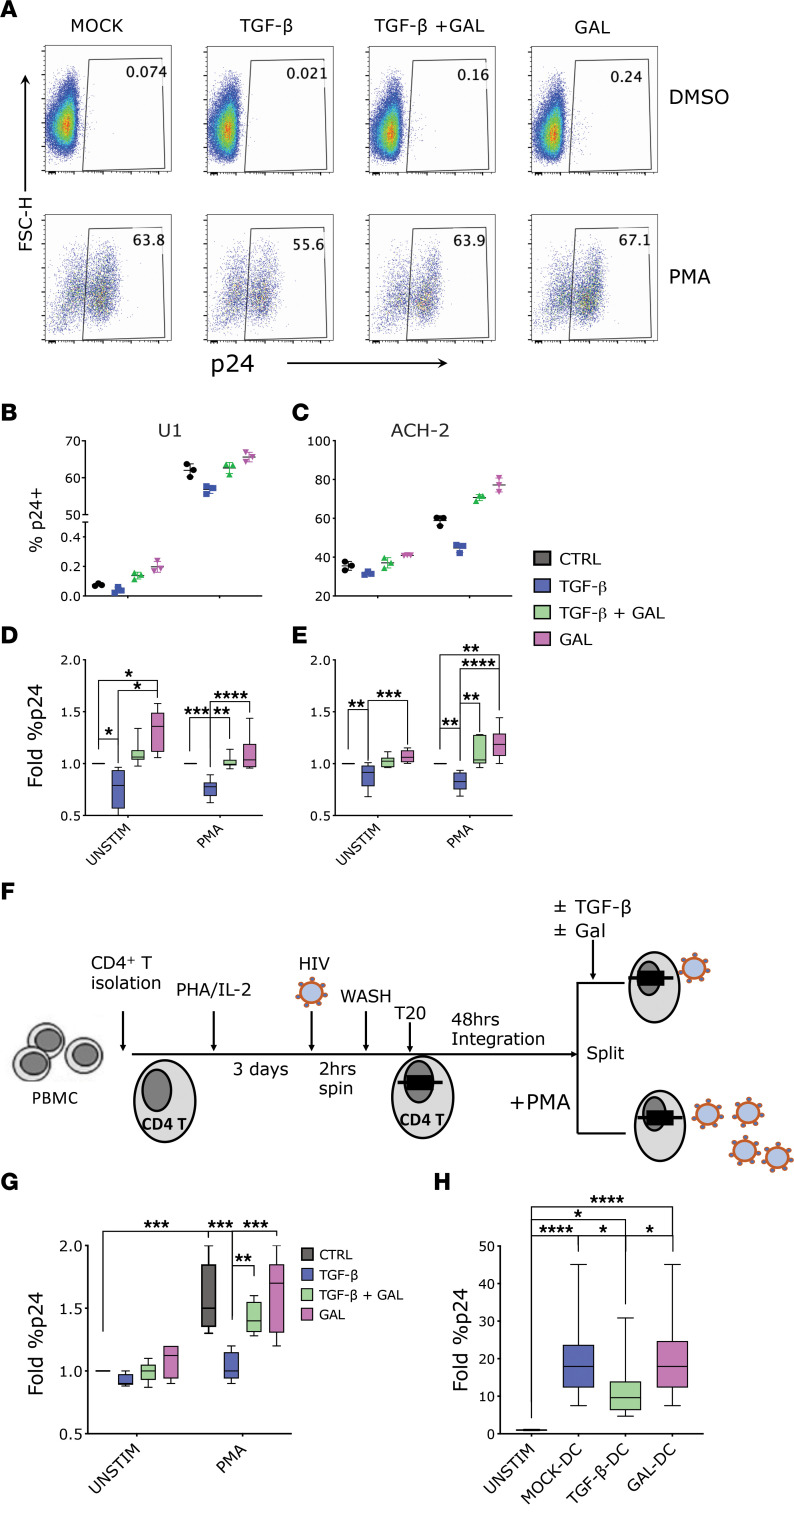
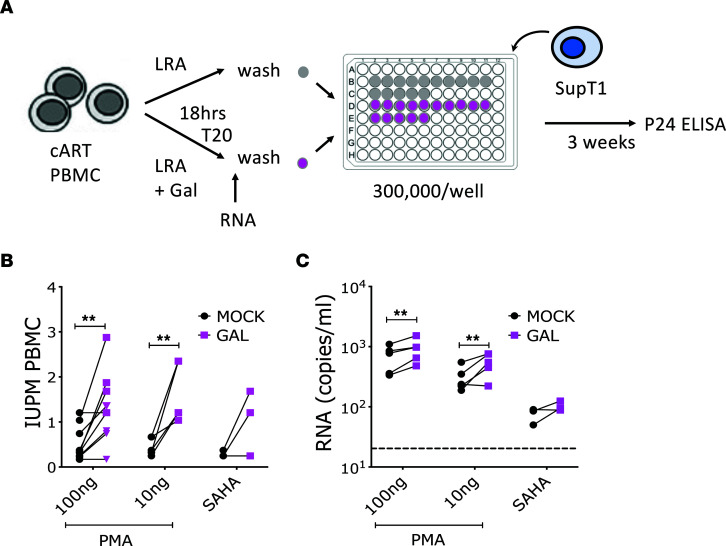
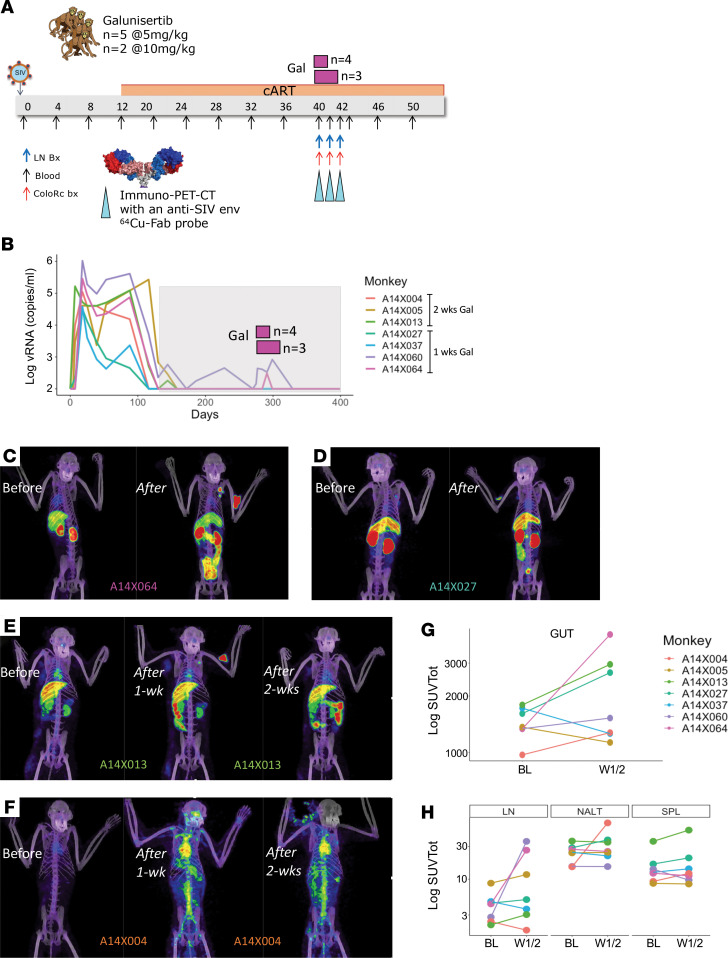
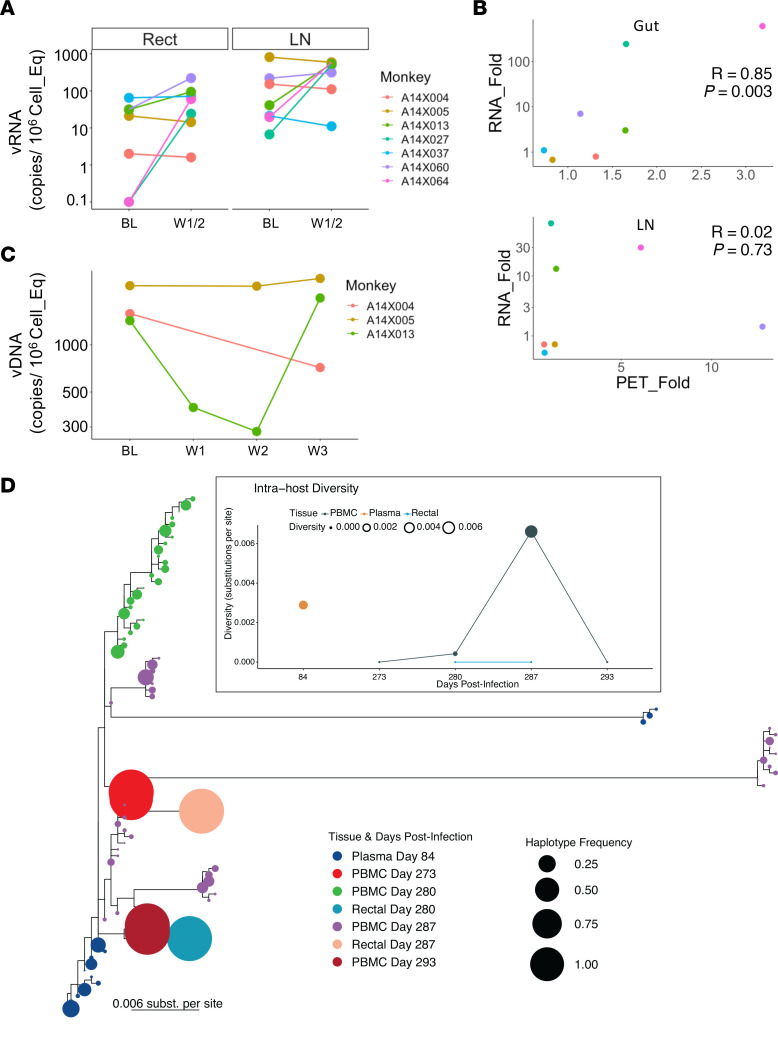
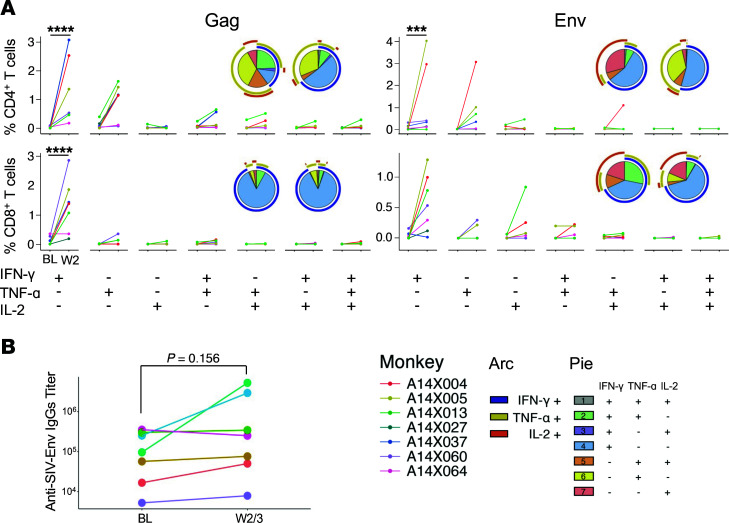
TGF-β plays a critical role in maintaining immune cells in a resting state by inhibiting cell activation and proliferation. Resting HIV-1 target cells represent the main cellular reservoir after long-term antiretroviral therapy (ART). We hypothesized that releasing cells from TGF-β-driven signaling would promote latency reversal. To test our hypothesis, we compared HIV-1 latency models with and without TGF-β and a TGF-β type 1 receptor inhibitor, galunisertib. We tested the effect of galunisertib in SIV-infected, ART-treated macaques by monitoring SIV-env expression via PET/CT using the 64Cu-DOTA-F(ab')2 p7D3 probe, along with plasma and tissue viral loads (VLs). Exogenous TGF-β reduced HIV-1 reactivation in U1 and ACH-2 models. Galunisertib increased HIV-1 latency reversal ex vivo and in PBMCs from HIV-1-infected, ART-treated, aviremic donors. In vivo, oral galunisertib promoted increased total standardized uptake values in PET/CT images in gut and lymph nodes of 5 out of 7 aviremic, long-term ART-treated, SIV-infected macaques. This increase correlated with an increase in SIV RNA in the gut. Two of the 7 animals also exhibited increases in plasma VLs. Higher anti-SIV T cell responses and antibody titers were detected after galunisertib treatment. In summary, our data suggest that blocking TGF-β signaling simultaneously increases retroviral reactivation events and enhances anti-SIV immune responses.

Keywords: AIDS/HIV; Cytokines; Immunotherapy; T cells.


Figures

Figure 1
Figure 1. TGF-β inhibits HIV-1 latency reactivation in vitro.
(AE) U1 and ACH-2 cells were treated with TGF-β1 (10 ng/mL) or galunisertib (GAL) (1 μM) or both or were mock treated in presence versus absence of PMA (100 ng/mL) for 18 hours and stained for intracellular p24. (A) An example of p24 detection in 1 experiment with U1 cells. (B and C) Raw p24 data from 1 representative experiment with U1 (B) or ACH-2 (C) cells (black circles: mock; blue squares: TGF-β1; green triangles: TGF-β1 + gal; pink triangles: galunisertib only). (D and E) Summary fold increase in the frequency of p24+ cells over the mock condition (box plot with median line and min/max whiskers) shown from 5 similar experiments (U1 on the left; ACH-2 on the right). (F and G) For this primary CD4+ T cell model of latency, CD4+ T cells were isolated from PBMCs, activated, infected by spinoculation, and incubated for 2 days in the presence of T20. PMA (100 ng/mL) was used for reactivation of latently infected cells for 18 hours in the presence of TGF-β1 (10 ng/mL) or galunisertib (1 μM), both, or mock treatment. A schematic of the experiment is shown in F. (G) Summary data (fold increase over the unstimulated condition) from 5 experiments with cells from different donors run in triplicate. (H) Data from a model of DC-driven HIV reactivation from U1 cells are shown. Fold difference in the frequency of p24+ U1 cells in absence versus presence of moDCs or TGF-β DCs shown for 5 different experiments in triplicate (box plot with median and min/max whiskers). (AH) Conditions were compared by Kruskal-Wallis ANOVA test followed by the Dunn’s test corrected for multiple comparisons. Significant P values of α < 0.05 (*), α < 0.01 (**), and α < 0.001 (***) are indicated. All other comparisons were nonsignificant. Box-and-whisker plots represent median, 25th and 75th percentile, with whiskers going from min to max.
Figure 2
Figure 2. Blocking TGF-β1 signaling increases latency reversal agent–induced HIV-1 reactivation ex vivo.
Deidentified PBMCs from aviremic, ART-treated PLWH collected at NIH and Northwestern University were used for viral outgrowth assays to estimate the frequency of HIV-infected cells able to produce replication-competent virus within the unfractionated PBMCs. (A) Schematic of the qVOA assay where activation with a latency reversal agent (LRA; namely PMA or vorinostat) was followed by collection of supernatant for viral RNA (vRNA) quantification (n = 5) and coculture with SupT1 cells (n = 9) in replicate wells (>14 wells). (B) The IUPM calculated based on the frequency of p24+ wells in each condition are shown (pink squares represent PBMCs from NIH; triangles represent PBMCs from Northwestern, RADAR). (C) vRNA-gag copies/mL of culturing media in presence versus absence of galunisertib (1 μM). Conditions were compared by a 2-way ANOVA followed by the Holm-Šídák multiple comparisons test. Significant P values of α < 0.05 (*) and α < 0.01 (**) are indicated. All other comparisons were nonsignificant.
Figure 3
Figure 3. Blocking TGF-β1 leads to HIV-1 reactivation in vivo.
(A) Schematic representation of the macaque studies. SIVmac251- and SIVmac239-infected macaques (n = 7) were treated with antiretroviral therapies starting week 12 postinfection. After 26–27 weeks of ART, animals were treated twice daily with 5 or 10 mg/kg of galunisertib orally. Colorectal biopsies, fine needle aspirates (FNAs), and PET/CT scans with the anti–SIV-env probe 64Cu-7D3 were performed before and at the end of the 1 or 2 weeks of treatment. The animals that were treated for 2 weeks underwent a second scan at the end of the first week of treatment. (B) pVLs measured at NIRC (lower limit of quantitation = 100 copies/mL). Galunisertib was administered every day (twice daily) for 1 or 2 weeks. Timing of galunisertib administration is represented by pink rectangles above the pVL. (CF) Representative images from the PET/CT scans of 4 out of 5 animals with increased PET signal following galunisertib treatment. (G and H) SUVtot for different anatomical areas (regions of interest) are shown before and after galunisertib treatment (Gut, small and large intestine; LN, axillary LNs; NALT, nasal associated lymphoid tissues; SPL, spleen). Data from baseline (BL) and postgalunisertib weeks 1 and 2 (W1/2) were compared using Wilcoxon matched pairs nonparametric test, and the differences were nonsignificant with α > 0.05.
Figure 4
Figure 4. Increased PET signal corresponds to increased vRNA.
(A) Copies of cell-associated unspliced vRNA normalized on 106 cells diploid genome equivalent are shown for colorectal biopsies and LNAs before and after galunisertib treatment. Data from BL and postgalunisertib W1/2 were compared using Wilcoxon matched pairs nonparametric test, and the differences were nonsignificant with α > 0.05. (B) The correlation between the fold increase in SUVtot for the gut (above) and LN (below) and the fold increase in vRNA copies in rectal biopsies and FNAs (only 1 of the axillary LNs was sampled) are shown. Pearson’s correlation coefficient and P values are indicated in each graph. (C) Copies of vDNA per 106 cells equivalent are shown for the PBMCs of the 3 animals that were treated with galunisertib for 2 weeks. W3 time point represents a sample collected 7 days after the last galunisertib administration. No statistical test was performed. (D) Intrahost viral quasispecies evolution before and after galunisertib treatment in A14X013 is shown. Inferred maximum likelihood (ML) tree with quasispecies within the same host in PBMCs, rectal tissues, and blood samples using deep sequencing of the gag gene. Circles at the tips represent each haplotype and are colored by time postinfection and sample type (D84 is plasma right before ART initiation; D273 is PBMC on the day of first galunisertib treatment, collected before treatment; D280-287-290 represent 7, 14, and 20 days after galunisertib initiation). Circle size indicates the frequency of the haplotype in the quasispecies. Insert represents the spatiotemporal evolution of the viral population diversity at each compartment and time point. Both y axis and circle size indicate diversity of quasispecies, and data from the same sample type are connected by lines. Intrahost viral diversity was calculated as weighted average of pairwise distances between every haplotype weighted by their frequency in the population in substitutions per site.
Figure 5
Figure 5. Blocking TGF-β1 stimulates SIV-specific responses.
(A) The frequency of CD4+ T cells and CD8+ T cells that express the cytokines indicated below the graphs in response to stimulation with a pool of 15-mer overlapping peptides from SIVmac239 gag and env are shown for before and after galunisertib treatment. The frequency of each population was calculated after subtraction of a DMSO unstimulated control performed in parallel with each sample. A mixed-effect model with the Holm-Šídák multiple comparisons test, with a single pooled variant, was used to test for significant differences. Significant P values of α < 0.001 (***) and α < 0.0001 (****) are indicated. Only IFN-γ was significant with this test. Nonsignificant differences in all other cytokine combinations are not indicated. (B) Anti–SIV-env titers in plasma before and after galunisertib treatment are shown for each animal. Wilcoxon matched pairs nonparametric t test was used to compare before and after galunisertib.

Similar articles

Cited by

References

    1. Siliciano JD, Siliciano RF. Recent developments in the search for a cure for HIV-1 infection: targeting the latent reservoir for HIV-1. J Allergy Clin Immunol. 2014;134(1):12–19. doi: 10.1016/j.jaci.2014.05.026. - DOI - PubMed
    1. Yukl SA, et al. HIV latency in isolated patient CD4+ T cells may be due to blocks in HIV transcriptional elongation, completion, and splicing. Sci Transl Med. 2018;10(430):eaap9927. doi: 10.1126/scitranslmed.aap9927. - DOI - PMC - PubMed
    1. Halvas EK, et al. HIV-1 viremia not suppressible by antiretroviral therapy can originate from large T cell clones producing infectious virus. J Clin Invest. 2020;130(11):5847–5857. doi: 10.1172/JCI138099. - DOI - PMC - PubMed
    1. Kruize Z, Kootstra NA. The role of macrophages in HIV-1 persistence and pathogenesis. Front Microbiol. 2019;10:2828. doi: 10.3389/fmicb.2019.02828. - DOI - PMC - PubMed
    1. Abreu CM, et al. Myeloid and CD4 T cells comprise the latent reservoir in antiretroviral therapy-suppressed SIVmac251-infected macaques. mBio. 2019;10(4):e01659–19. - PMC - PubMed

Publication types

MeSH terms