. 2022 Nov 15;132(22):e154229.
doi: 10.1172/JCI154229.

H3.3-G34 mutations impair DNA repair and promote cGAS/STING-mediated immune responses in pediatric high-grade glioma models

Affiliations

H3.3-G34 mutations impair DNA repair and promote cGAS/STING-mediated immune responses in pediatric high-grade glioma models

Santiago Haase et al. J Clin Invest. .

Abstract

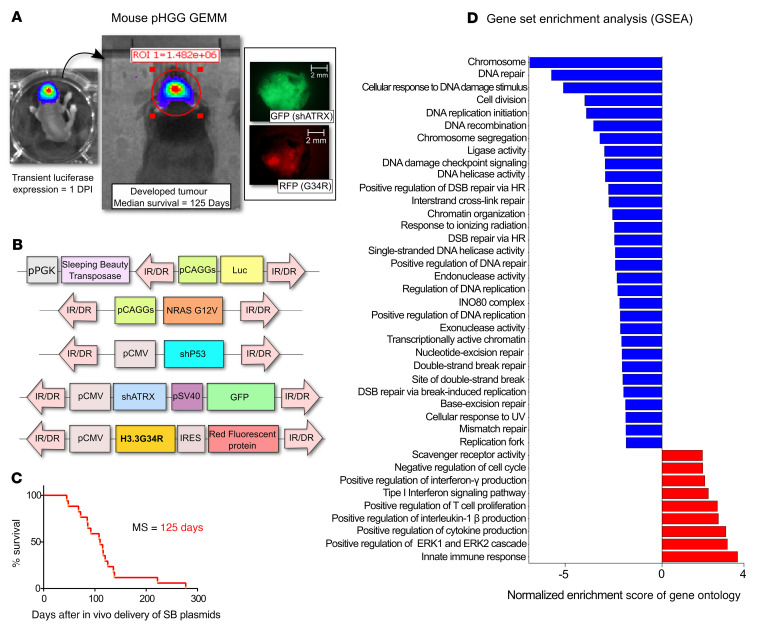
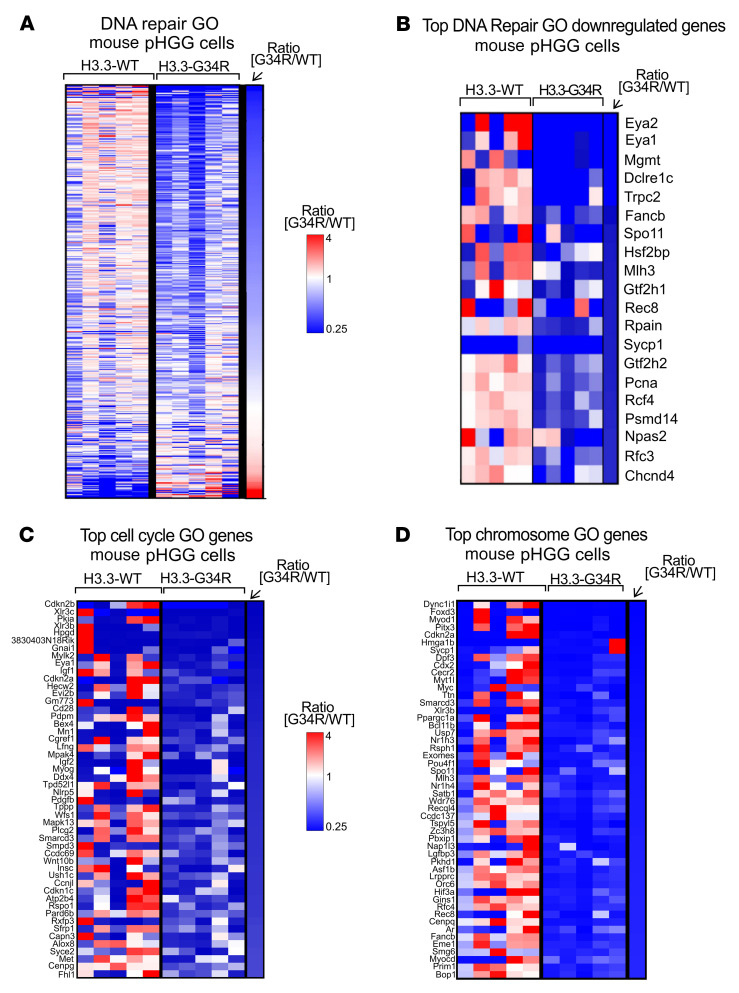
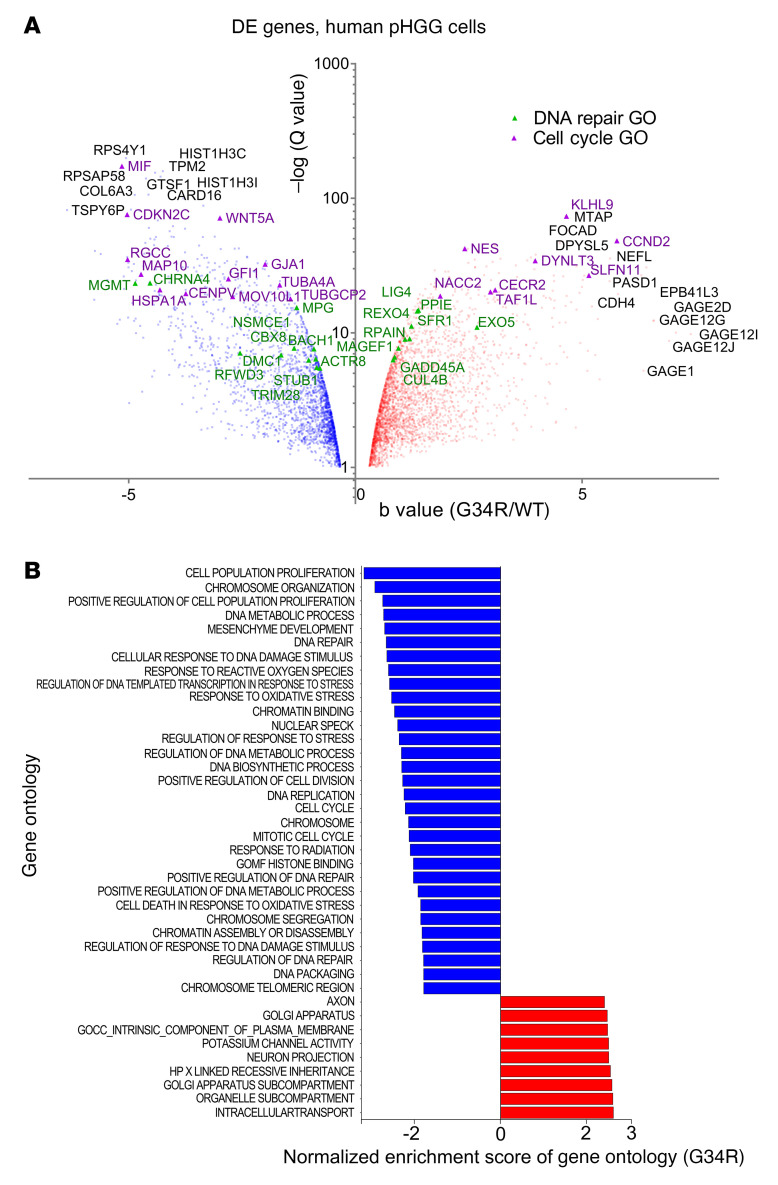
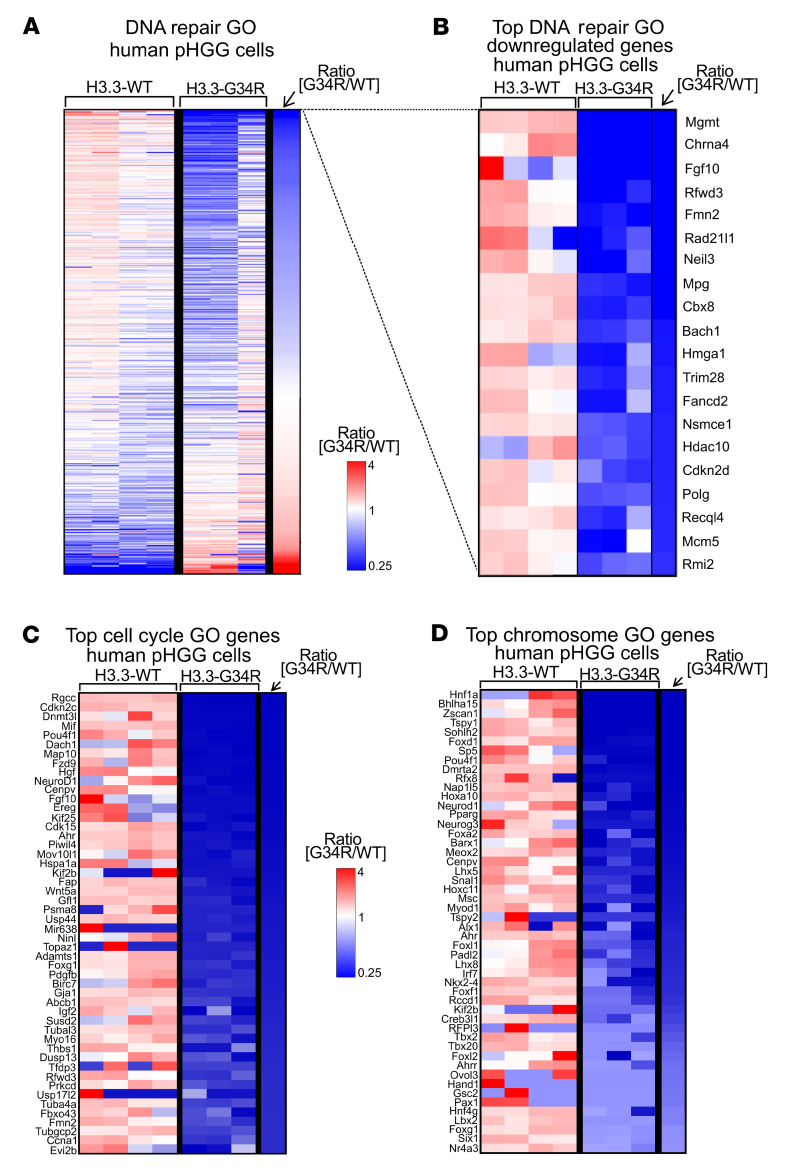
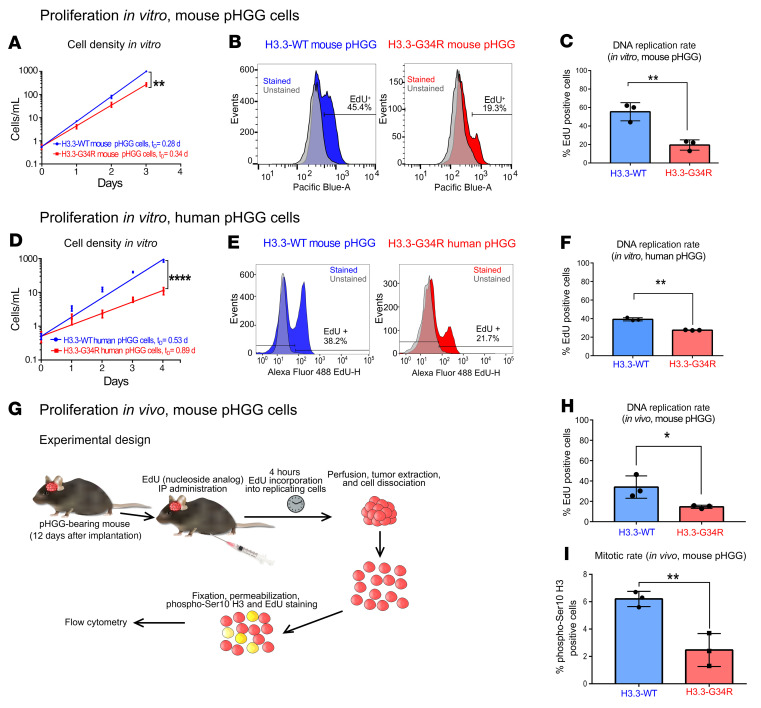
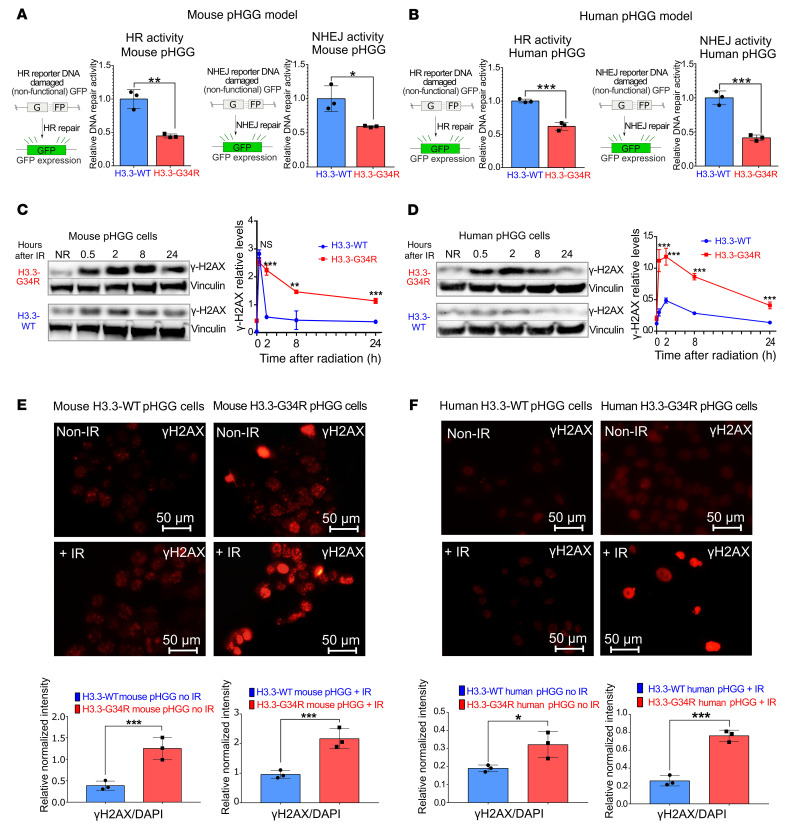
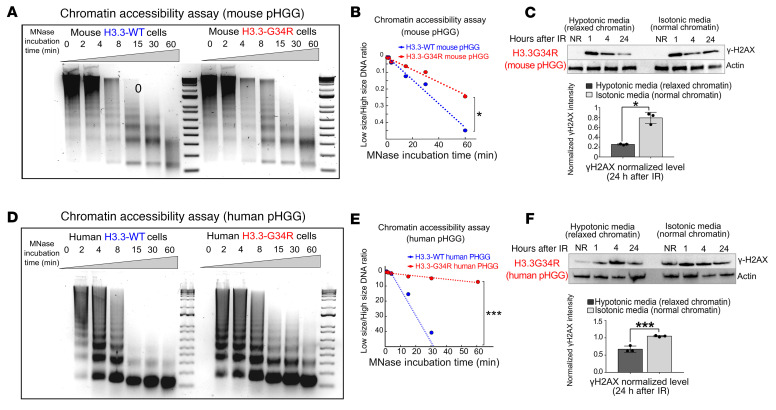
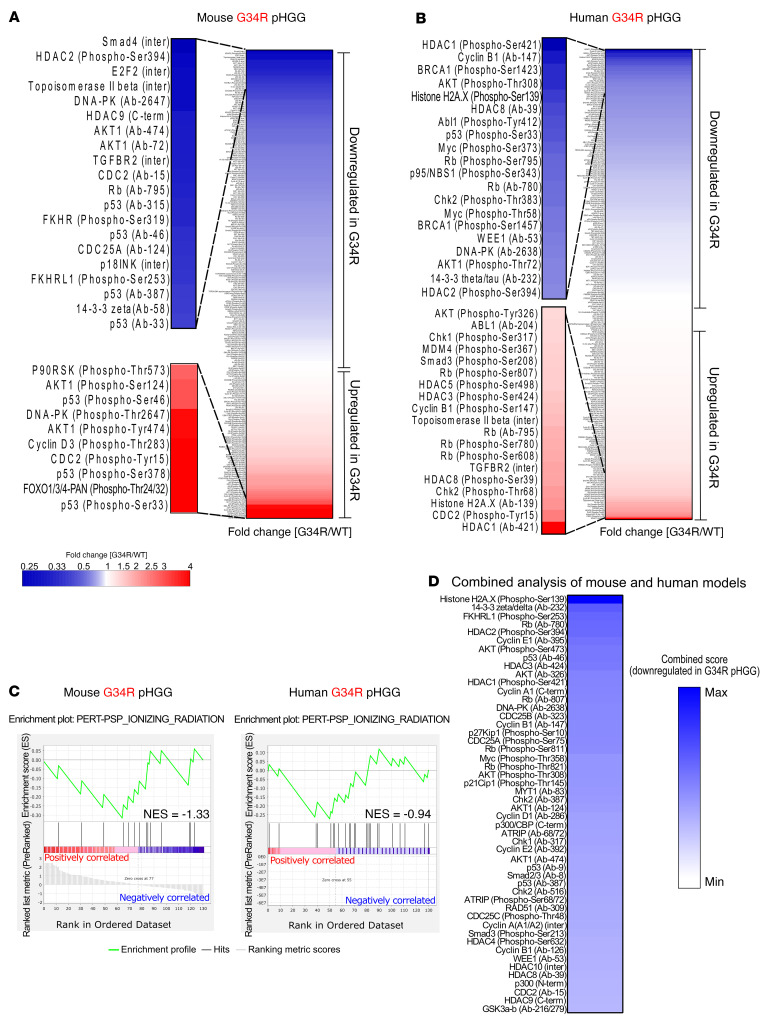
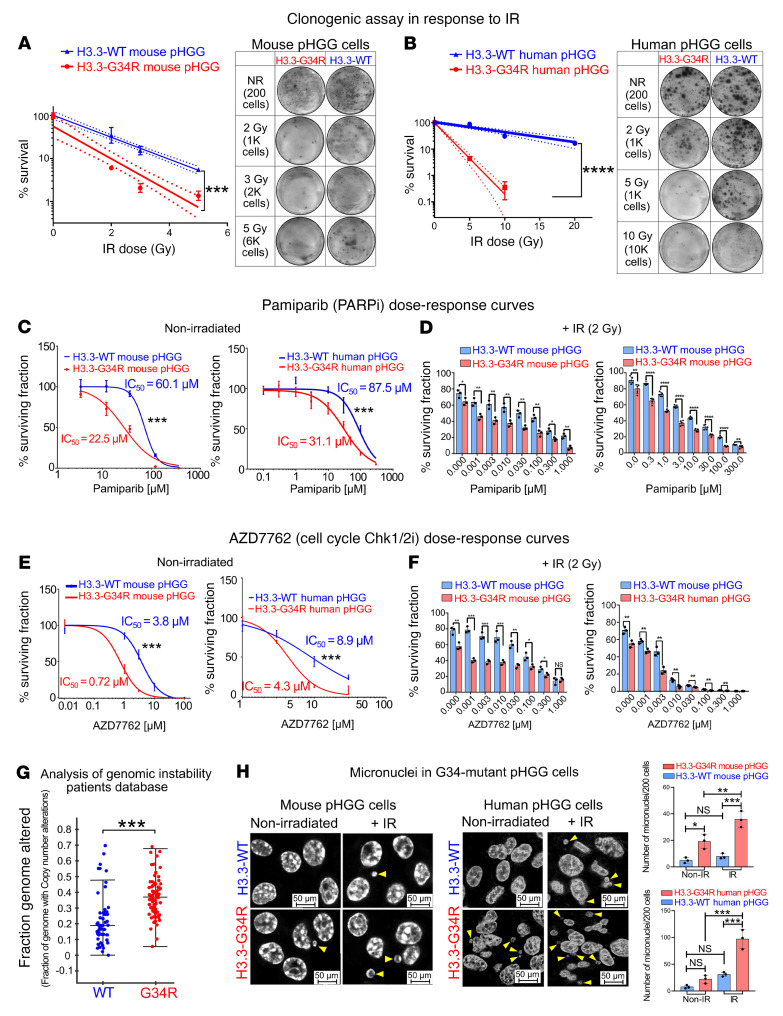
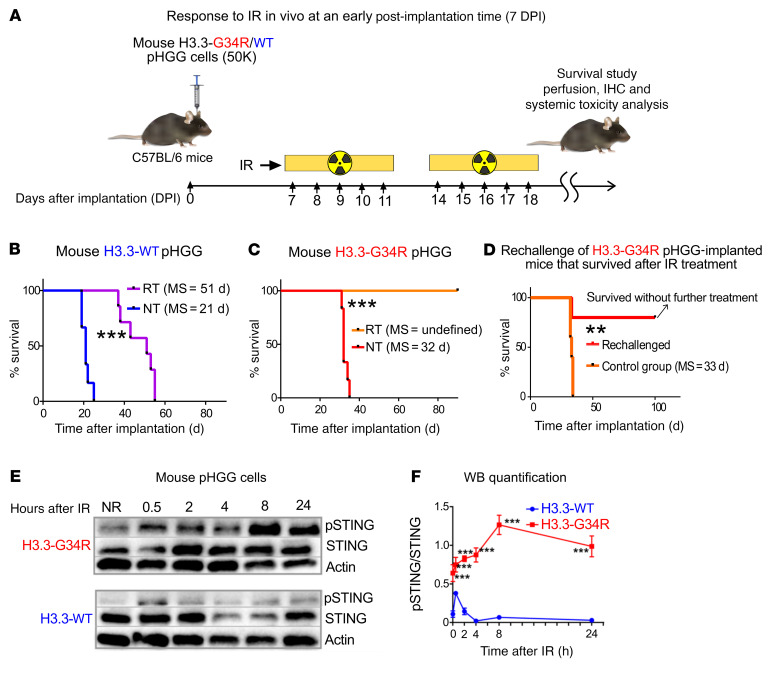
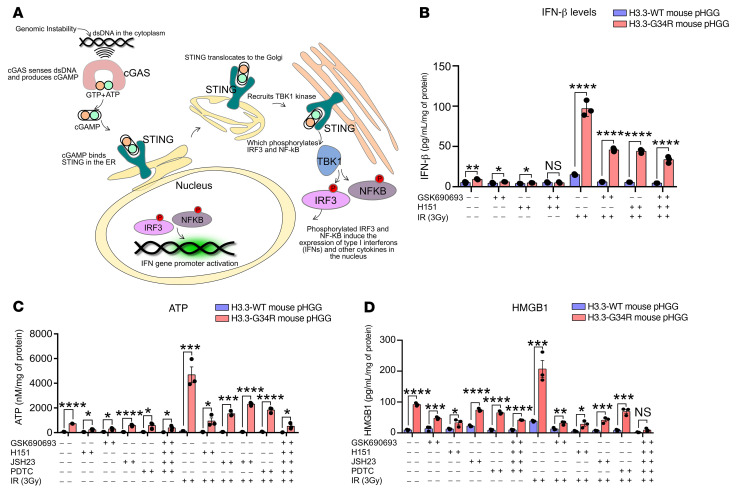
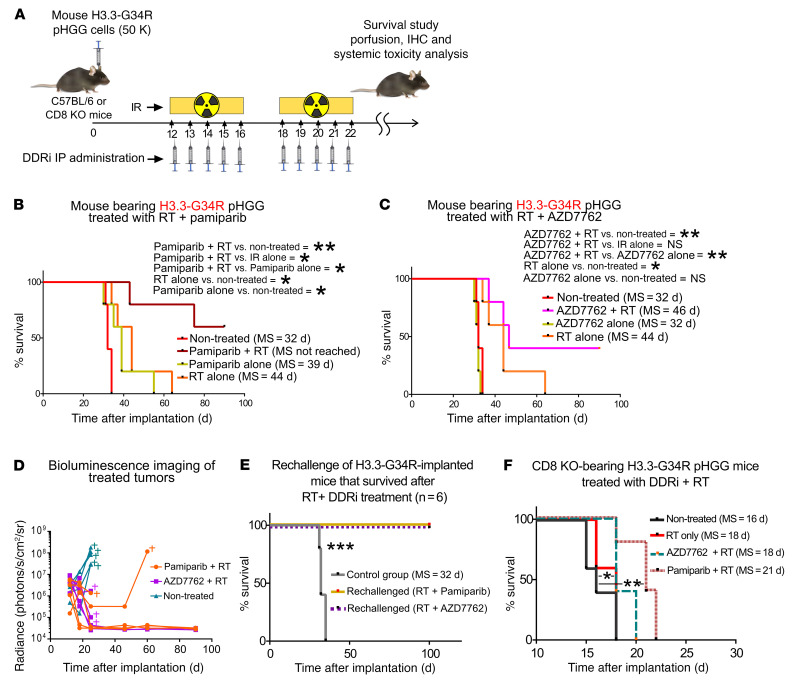
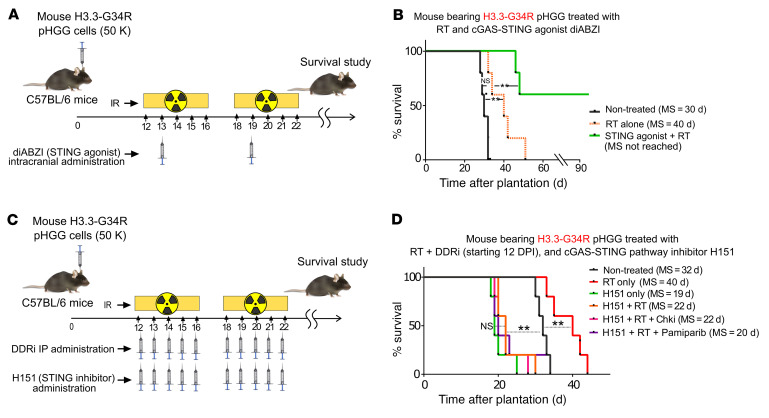
Pediatric high-grade gliomas (pHGGs) are the leading cause of cancer-related deaths in children in the USA. Sixteen percent of hemispheric pediatric and young adult HGGs encode Gly34Arg/Val substitutions in the histone H3.3 (H3.3-G34R/V). The mechanisms by which H3.3-G34R/V drive malignancy and therapeutic resistance in pHGGs remain unknown. Using a syngeneic, genetically engineered mouse model (GEMM) and human pHGG cells encoding H3.3-G34R, we demonstrate that this mutation led to the downregulation of DNA repair pathways. This resulted in enhanced susceptibility to DNA damage and inhibition of the DNA damage response (DDR). We demonstrate that genetic instability resulting from improper DNA repair in G34R-mutant pHGG led to the accumulation of extrachromosomal DNA, which activated the cyclic GMP-AMP synthase/stimulator of IFN genes (cGAS/STING) pathway, inducing the release of immune-stimulatory cytokines. We treated H3.3-G34R pHGG-bearing mice with a combination of radiotherapy (RT) and DNA damage response inhibitors (DDRi) (i.e., the blood-brain barrier-permeable PARP inhibitor pamiparib and the cell-cycle checkpoint CHK1/2 inhibitor AZD7762), and these combinations resulted in long-term survival for approximately 50% of the mice. Moreover, the addition of a STING agonist (diABZl) enhanced the therapeutic efficacy of these treatments. Long-term survivors developed immunological memory, preventing pHGG growth upon rechallenge. These results demonstrate that DDRi and STING agonists in combination with RT induced immune-mediated therapeutic efficacy in G34-mutant pHGG.

Keywords: Brain cancer; DNA repair; Drug therapy; Oncology; Therapeutics.


Conflict of interest statement

Conflict of interest: The authors have declared that no conflict of interest exists.

Figures

Figure 1
Figure 1. Characterization of a GEMM of G34R pHGG.
(A) Procedure to induce genetically engineered H3.3-G34R pHGG in mice. Neonatal murine brain stem cells were transfected in vivo with SB transposase integration sequences to incorporate pHGG-inducing genetic lesions into the cells, including H3.3-G34R expression. pHGG development was monitored in vivo by luminescence driven by luciferase expression, and mice were perfused once signs of pHGG burden appeared; tumor tissue can be identified by its red (G34R) and green (ATRX-KO) fluorescence. Scale bars: 2 mm. DPI, days post implantation. (B) Illustration of the transposable fragments of the plasmids used to induce H3.3-G34R pHGG in mice via SB transposition. (C) Survival of animals transfected in vivo to develop de novo H3.3-G34R pHGG. (D) Selection of differentially enriched GOs between H3.3-G34R and H3.3-WT de novo–induced mouse pHGG, arranged by NES.
Figure 2
Figure 2. Transcriptomic analysis of relevant pathways in G34R mouse pHGG.
(A) Heatmap depicting the expression levels of each gene within the “DNA repair” GO, comparing H3.3-G34R with H3.3-WT mouse pHGG cells. (B) Heatmap highlighting the top DNA repair genes that were more downregulated in H3.3-G34R than in H3.3-WT mouse pHGG cells. (C and D) Heatmaps highlighting the top genes that were more downregulated for “cell cycle” (C) and “chromosome” GOs (D) in H3.3-G34R versus H3.3-WT mouse pHGG cells.
Figure 3
Figure 3. Transcriptomic analysis of a human model of H3.3-G34R pHGG.
(A) Volcano plot of genes differentially expressed between H3.3-G34R and H3.3-WT human pHGG cells. DNA repair GO genes are highlighted in green, and cell cycle GO genes are highlighted in purple. (B) Selection of differentially enriched GOs between H3.3-G34R and H3.3-WT human pHGG cells, arranged by NES.
Figure 4
Figure 4. Transcriptomic analysis of relevant pathways in G34R human pHGG.
(A) Heatmap depicting the gene expression levels of each gene within the “DNA repair” GO, comparing H3.3-G34R with H3.3-WT human pHGG cells. (B) Top most downregulated DNA repair GO genes in H3.3-G34R versus H3.3-WT human pHGG cells. (C and D) Heatmaps highlighting the top most downregulated genes for the GOs “cell cycle” (C) and “chromosome” (D) in H3.3-G34R versus H3.3-WT human pHGG cells.
Figure 5
Figure 5. Analysis of proliferation of H3.3-G34R pHGG in vitro and in vivo.
(A) In vitro cell growth curve comparing mouse H3.3-G34R and H3.3-WT pHGG cells. tD, cell doubling time, in days. (B) Analysis of the fraction of replicating cells by cytometry-based quantification of EdU incorporation comparing mouse H3.3-G34R and H3.3-WT pHGG cells. (C) Statistical analysis of the fraction of replicating cells from B. (D) In vitro cell growth curve comparing human H3.3-G34R and H3.3-WT pHGG cells. (E) Analysis of the fraction of replicating cells by cytometry-based quantification of EdU incorporation, comparing human H3.3-G34R and H3.3-WT pHGG cells. (F) Statistical analysis of the fraction of replicating cells from E. (G) Scheme depicting the experimental strategy to analyze the fraction of replicating cells and mitotic rates in H3.3-G34R and H3.3-WT mouse pHGG cells in vivo. (H) Statistical analysis of the fraction of replicating cells from the experiment illustrated in G. (I) Statistical analysis of the fraction pHGG cells undergoing mitosis (stained with H3 phospho-Ser10 in cells from the experiment illustrated in G); *P < 0.05, **P < 0.01, and ****P < 0.001; analysis of the slope difference in the nonlinear regression model (A and D); unpaired t test (C, F, H, and I). Data represent the mean ± SD of 3 identical experimental.
Figure 6
Figure 6. DNA repair activity is diminished in mouse G34R pHGG cells.
(A and B) Schemes on the left in A and B show plasmid-based reporter assays to assess HR DNA repair activity levels. The HR plasmid was linearized to disrupt the Gfp gene, and the repair of the plasmid through HR reconstituted GFP expression. Graphs on the left show in A and B HR DNA repair levels in H3.3-G34R and H3.3-WT mouse (A) and human (B) pHGG cells. Schemes on the right in A and B show plasmid-based reporter assays to assess NHEJ DNA repair activity levels. The NHEJ plasmid was linearized to disrupt the Gfp gene, and the repair of the plasmid through NHEJ reconstituted GFP expression. Graphs on the right in A and B show NHEJ DNA repair levels on H3.3-G34R and H3.3-WT mouse (A) and human (B) pHGG cells. (C and D) Western blotting for γH2AX levels of H3.3-G34R and H3.3-WT mouse (C) and human (D) pHGG cells at different time points after 3 Gy IR. Graphs on the right show quantification of γH2AX levels from the experiment described. (E and F) Immunofluorescence images of γH2AX levels in H3.3-G34R and H3.3-WT mouse (E) and human (F) pHGG cells processed 4 hours after 3 Gy IR. Scale bars: 50 μm. Graphs on the bottom show quantification of γH2AX levels determined by immunofluorescence. *P < 0.05, **P < 0.01, and ***P < 0.005; unpaired t test (AF). Data represent the mean ± SD of 3 technical replicates.
Figure 7
Figure 7. Chromatin accessibility is reduced in G34R pHGG.
(A) DNA gel depicting chromatin accessibility analyzed by timed MNase digestion of chromatin from H3.3-G34R and H3.3-WT mouse pHGG cells. (B) Statistical analysis of MNase digestion from A. (C) Western blot depicting γH2AX levels in response to IR under normal conditions (isotonic media) or under conditions that favored chromatin relaxation in H3.3-G34R and H3.3-WT mouse pHGG cells. Graph shows statistical analysis of γH2AX levels 24 hours after IR. (D) Chromatin accessibility analyzed by timed MNase digestion of chromatin from H3.3-G34R and H3.3-WT human pHGG cells. (E) Statistical analysis of MNase digestion of chromatin from D. (F) Western blot depicting γH2AX levels in response to IR under normal conditions (isotonic media) or under conditions that favored chromatin relaxation in H3.3-G34R and H3.3-WT human pHGG cells. Graph below shows statistical analysis of the γH2AX levels 24 hours after IR. *P < 0.05 and ***P < 0.005; unpaired t test (C and F); analysis of the slope difference in the nonlinear regression model (B and E). Data represent the mean ± SD of 3 technical replicates (C and F).
Figure 8
Figure 8. Analysis of DNA repair pathway activity according to protein and PTM levels in G34R pHGG cells.
(A) Heatmap showing the results of total DNA repair proteins and PTM levels in G34R mouse pHGG cells versus H3.3-WT cells, highlighting the main upregulated and downregulated proteins and PTMs. (B) Heatmap showing the results of total DNA repair proteins and PTM levels in G34R human pHGG cells versus WT cells, highlighting the main upregulated and downregulated proteins and PTMs. (C) Result of GSEA using the PTM signature PSP_IONIZING_RADIATION (a signature composed of PTMs induced by irradiation of cells). (D) Heatmap of a combined analysis highlighting the marks that were most downregulated in G34R pHGG cells in both the mouse and human models.
Figure 9
Figure 9. H3.3-G34R pHGG cells exhibit increased susceptibility to IR and to DDRi in vitro.
Clonogenic assay in H3.3-G34R and H3.3-WT mouse (A) and human (B) pHGG cells in response to increasing doses of IR. NR, no radiation. (C) Dose-response curves of H3.3-G34R and H3.3-WT mouse and human pHGG cells in response to the PARPi pamiparib. (D) Survival of H3.3-G34R and H3.3-WT mouse and human pHGG cells in response to the combination of IR and increasing doses of pamiparib. (E) Dose-response curves of H3.3-G34R and H3.3-WT mouse and human pHGG cells in response to the CHK1/2i AZD7762. (F) Survival of H3.3-G34R and H3.3-WT mouse and human pHGG cells in response to the combination of IR and increasing doses of AZD7762. (G) Analysis of the CNAs of genomes of patients carrying H3.3-WT or H3.3-G34R pHGG, from the PedcBioPortal database. (H) Analysis of the number of micronuclei in H3.3-G34R and H3.3-WT mouse and human pHGG cells under basal conditions and after IR. Yellow arrowheads indicate micronuclei. Scale bars: 50 μm. *P < 0.05, **P < 0.01, ***P < 0.005, and ****P < 0.001; analysis of the slope difference in the nonlinear regression model (A and B); the survival fraction for each irradiation dose was calculated for each irradiated plate as follows: (colonies on nontreated plate)/(cells plated on nontreated plate)/(colonies on case plate)/(cells plated on case plate); analysis of the IC50 difference in the sigmoid nonlinear regression model (C and E); unpaired t test (D and F), Wilcoxon test (G), and 1-way ANOVA with Šidák’s multiple-comparison correction (H). Data represent the mean ± SD of 3 identical experiments (AF).
Figure 10
Figure 10. H3.3G34R pHGG shows an improved therapeutic response to RT, and DNA damage in these cells mediates cGAS/STING pathway activation.
(A) H3.3-G34R and H3.3-WT mouse cells were implanted to generate allogenic pHGG in mice. Mice were subjected to 20 Gy RT starting on day 7 after implantation according to the schedule indicated in the scheme (2 Gy/d, 10 days). (B) Kaplan-Meier survival plot of H3.3-WT–bearing mice treated with RT compared with NT mice. (C) Kaplan-Meier survival plot of H3.3-G34R–bearing mice treated with RT compared with NT mice. (D) Kaplan-Meier survival plot of H3.3-G34R–bearing mice that survived after RT treatment as indicated in C and that were rechallenged by implantation of H3.3-G34R cells into the contralateral hemisphere. (E) STING (phospho-Ser365) levels in H3.3-G34R and H3.3-WT mouse cells at different time points after 3 Gy IR. (F) Quantification of the Western blot (WB) results represented in E. **P < 0.01 and ***P < 0.005; analysis of MS from the Kaplan-Meier curve; n = 5 mice/group (BD). Data were analyzed by log-rank (Mantel-Cox) test (BD) and unpaired t test (F). Data in F represent the mean ± SD of 3 technical replicates.
Figure 11
Figure 11. H3.3G34R pHGG mediates cytokine and DAMP release via cGAS/STING pathway activation.
(A) Scheme illustrating the cGAS/STING pathway and the link between cytosolic dsDNA and activation of the immune system. (B) Release of IFN-β in H3.3-G34R and H3.3-WT mouse cells in response to 3 Gy IR and inhibition of IFN-β release by the STING inhibitors GSK690693 and H151. (C) Levels of soluble DAMP ATP in H3.3-G34R and H3.3-WT mouse cells in response to 3 Gy IR and inhibition of the cGAS/STING pathway with GSK690693 (STING-dependent IRF3 activation inhibitor); H151 (STING inhibitor); JSH23 (NF-κB activation inhibitor); and PDTC (NF-κB inhibitor). (D) Levels of soluble DAMP HMGB1 in H3.3-G34R and H3.3-WT mouse cells in response to IR and inhibition of the cGAS/STING pathway with the inhibitors GSK690693, H151, JSH23, and PDTC. *P < 0.05, **P < 0.01, ***P < 0.005, and ****P < 0.001; unpaired t test (BD). Data in BD represent the mean ± SD of 3 experimental replicates.
Figure 12
Figure 12. H3.3-G34R pHGG shows an improved therapeutic response to DDRi in combination with RT, and long-term survivors acquire antitumor immunological memory.
(A) Illustration depicting the time frame of the combined treatment with DDRi and RT. (B) Kaplan-Meier survival plot of H3.3-G34R–bearing mice treated with RT alone or in combination with the PARPi pamiparib. (C) Kaplan-Meier survival plot of H3.3-G34R–bearing mice treated with RT alone or in combination with the CHK1/2i AZD7762. (D) Results of the in vivo imaging of tumor size in response to the DDRi plus RT treatment. The mark indicates that the animal was euthanized because of signs of tumor burden. (E) Kaplan-Meier survival plot of H3.3-G34R–bearing mice that survived following RT plus DDRi therapies and that were rechallenged with H3.3-G34R pHGG cells, compared with naive mice implanted with the same cells (control group). (F) Kaplan-Meier survival plot of CD8-KO mice implanted with H3.3-G34R cells and treated with RT alone or in combination with the CHK1/2i AZD7762 or the PARPi pamiparib. n = 5 mice/group. *P < 0.05, **P < 0.01, and ***P < 0.005; log-rank (Mantel-Cox) test.
Figure 13
Figure 13. H3.3-G34R pHGG shows an improved therapeutic response to a STING agonist, and a STING inhibitor diminishes RT and DDRi efficacy.
(A) Illustration depicting the time frame of the combined treatment with DDRi, RT, and the STING agonist diABZI. (B) Survival of H3.3-G34R–bearing mice treated with RT alone or with RT in combination the STING agonist diABZI. (C) Illustration depicting the time frame of the combined treatment with DDRi, RT, and the STING inhibitor H151. (D) Survival of H3.3-G34R–bearing mice that received no treatment or that were treated with RT alone; the STING inhibitor H151 alone; or with RT in combination with H151, H151 plus CHK1/2i, or H151 plus the PARPi pamiparib. n = 5 mice/group. **P < 0.01; log-rank (Mantel-Cox) test.

Comment in

Similar articles

Cited by

References

    1. Fangusaro J. Pediatric high grade glioma: a review and update on tumor clinical characteristics and biology. Front Oncol. 2012;2:105. - PMC - PubMed
    1. Haase S, et al. Hemispherical pediatric high-grade glioma: molecular basis and therapeutic opportunities. Int J Mol Sci. 2020;21(24):9654. doi: 10.3390/ijms21249654. - DOI - PMC - PubMed
    1. Ostrom QT, et al. CBTRUS statistical report: primary brain and other central nervous system tumors diagnosed in the United States in 2012-2016. Neuro Oncol. 2019;21(suppl 5):v1–v100. - PMC - PubMed
    1. Schwartzentruber J, et al. Driver mutations in histone H3.3 and chromatin remodelling genes in paediatric glioblastoma. Nature. 2012;482(7384):226–231. doi: 10.1038/nature10833. - DOI - PubMed
    1. Sturm D, et al. Hotspot mutations in H3F3A and IDH1 define distinct epigenetic and biological subgroups of glioblastoma. Cancer Cell. 2012;22(4):425–437. doi: 10.1016/j.ccr.2012.08.024. - DOI - PubMed

Publication types