

First wave COVID-19 pandemic in Senegal: Epidemiological and clinical characteristics
- PMID: 36126041
- PMCID: PMC9488827
- DOI: 10.1371/journal.pone.0274783
First wave COVID-19 pandemic in Senegal: Epidemiological and clinical characteristics
Abstract
Background: The novel coronavirus disease 2019 (COVID-19) pandemic has spread from China to the rest of the world. Africa seems less impacted with lower number of cases and deaths than other continents. Senegal recorded its first case on March 2, 2020. We present here data collected from March 2 to October 31, 2020 in Senegal.
Methods: Socio-demographic, epidemiological, clinical and virological information were collected on suspected cases. To determine factors associated with diagnosed infection, symptomatic disease and death, multivariable binary logistic regression and log binomial models were used. Epidemiological parameters such as the reproduction number and growth rate were estimated.
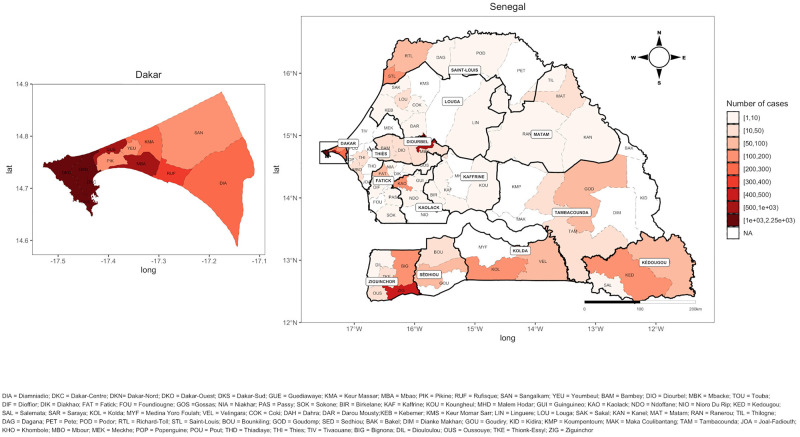
Results: 67,608 suspected cases were tested by the IPD laboratories (13,031 positive and 54,577 negative). All age categories were associated with SARS-CoV-2 infection, but also patients having diabetes or hypertension or other cardiovascular diseases. With diagnosed infection, patients over 65 years and those with hypertension and cardiovascular disease and diabetes were highly associated with death. Patients with co-morbidities were associated with symptomatic disease, but only the under 15 years were not associated with. Among infected, 27.67% were asymptomatic (40.9% when contacts were systematically tested; 12.11% when only symptomatic or high-risk contacts were tested). Less than 15 years-old were mostly asymptomatic (63.2%). Dakar accounted for 81.4% of confirmed cases. The estimated mean serial interval was 5.57 (± 5.14) days. The average reproduction number was estimated at 1.161 (95%CI: 1.159-1.162), the growth rate was 0.031 (95%CI: 0.028-0.034) per day.
Conclusions: Our findings indicated that factors associated with symptomatic COVID-19 and death are advanced age (over 65 years-old) and comorbidities such as diabetes and hypertension and cardiovascular disease.
Conflict of interest statement
The authors have declared that no competing interests exist.
Figures


References
-
- World Health Organization. Statement on the meeting of the International Health Regulations (2005) Emergency Committee regarding the outbreak of novel coronavirus 2019 (n-CoV) on 23 January 2020. [cited 2020 Jul 15]; https://www.who.int/news-room/detail/23-01-2020-statement-on-the-meeting....
-
- Johns Hopkins University. Coronavirus COVID-19 (2019-nCoV): COVID-19 Dashboard by the Center for Systems Science and Engineering (CSSE) at Johns Hopkins University (JHU). [cited 2020 Oct 29]; https://gisanddata.maps.arcgis.com/apps/opsdashboard/index.html#/bda7594....
-
- Africa CDC. Coronavirus Disease 2019 (COVID-19)- Africa CDC Dashboard. [cited 2022 Feb 15]; https://africacdc.org/covid-19/.
MeSH terms
LinkOut - more resources
Full Text Sources
Medical
Miscellaneous
