. 2022 Dec 2;82(23):4386-4399.
doi: 10.1158/0008-5472.CAN-22-1744.

Stress-Mediated Attenuation of Translation Undermines T-cell Activity in Cancer

Affiliations

Stress-Mediated Attenuation of Translation Undermines T-cell Activity in Cancer

Brian P Riesenberg et al. Cancer Res. .

Abstract

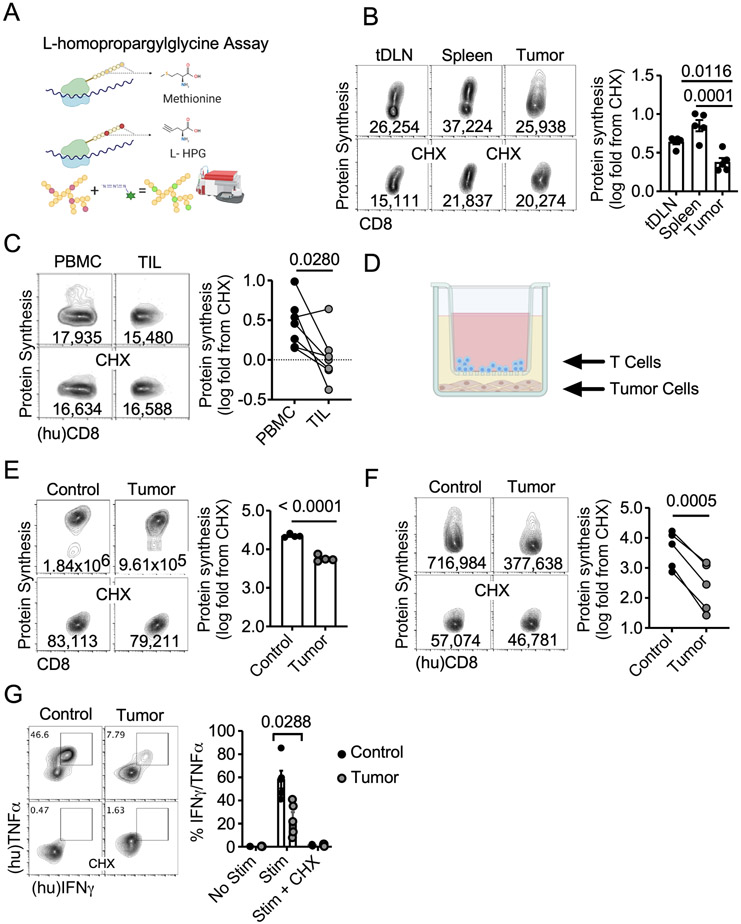
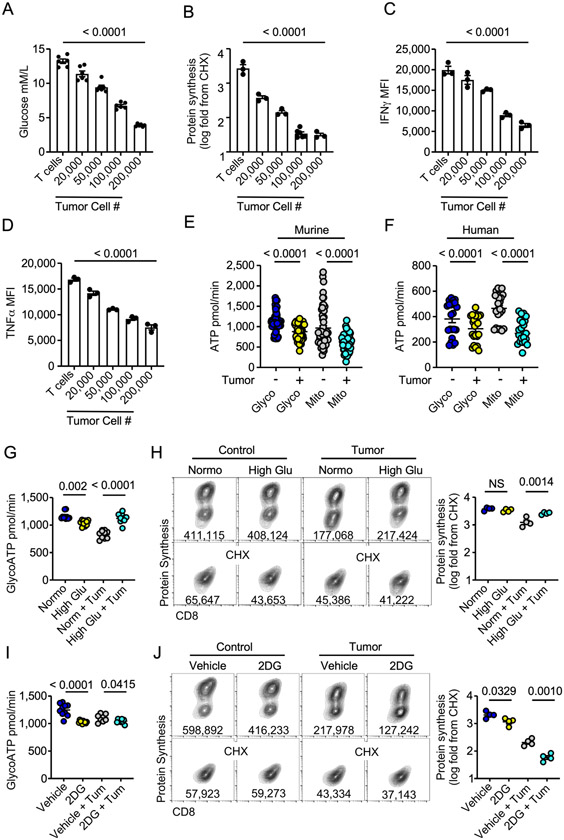
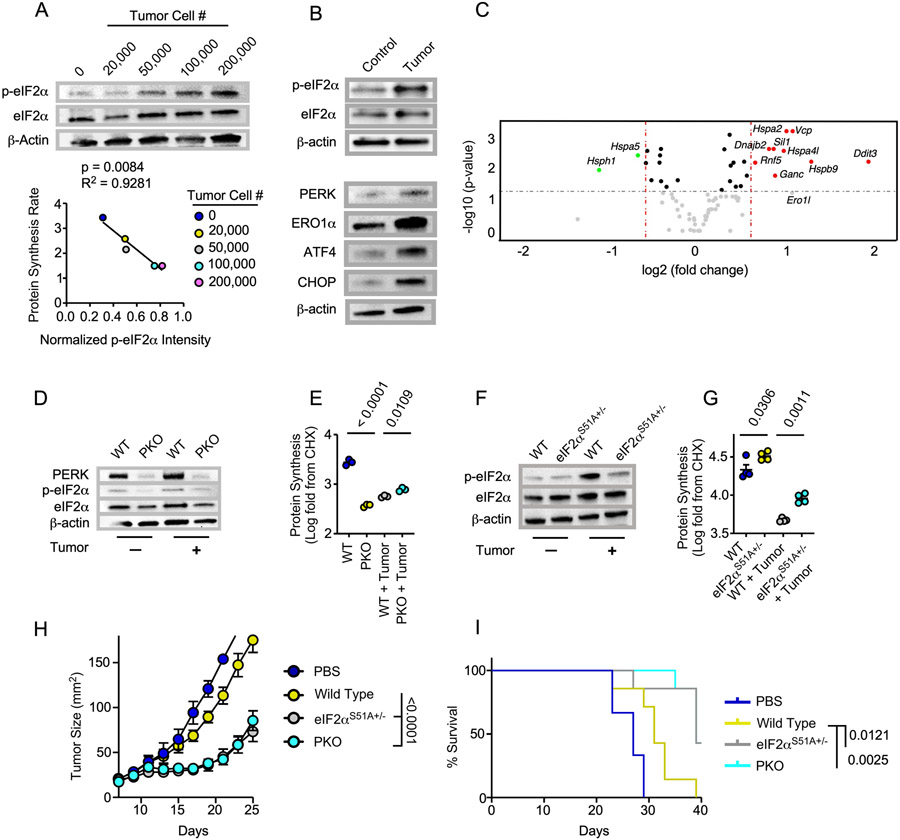
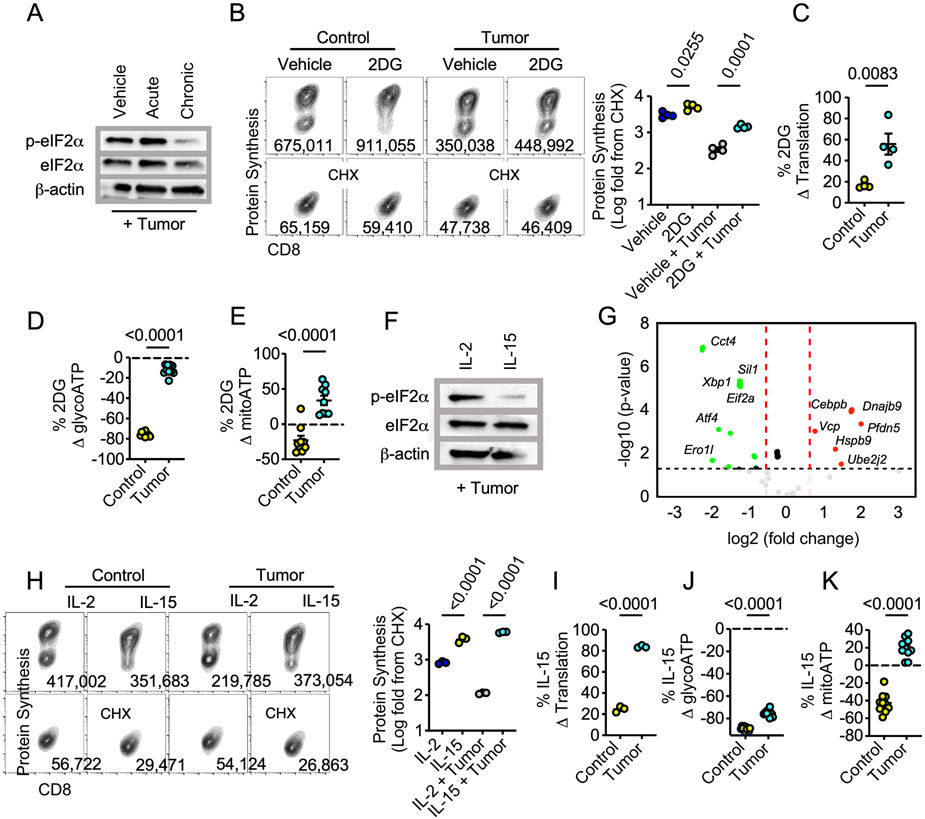
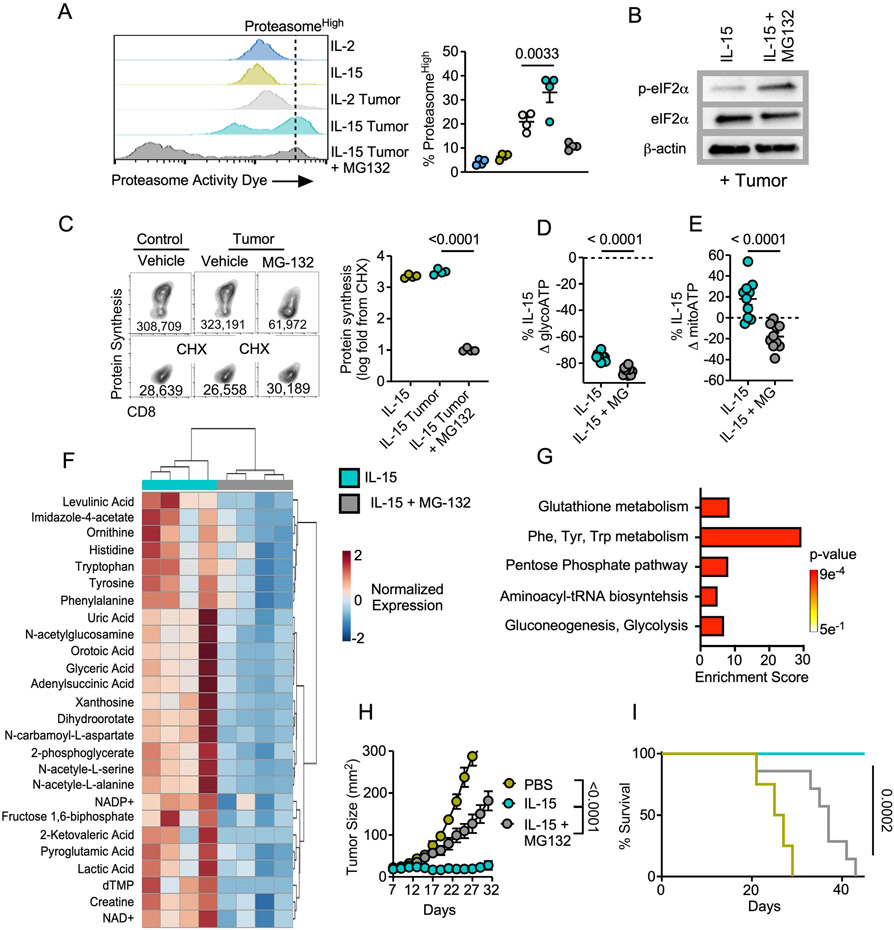
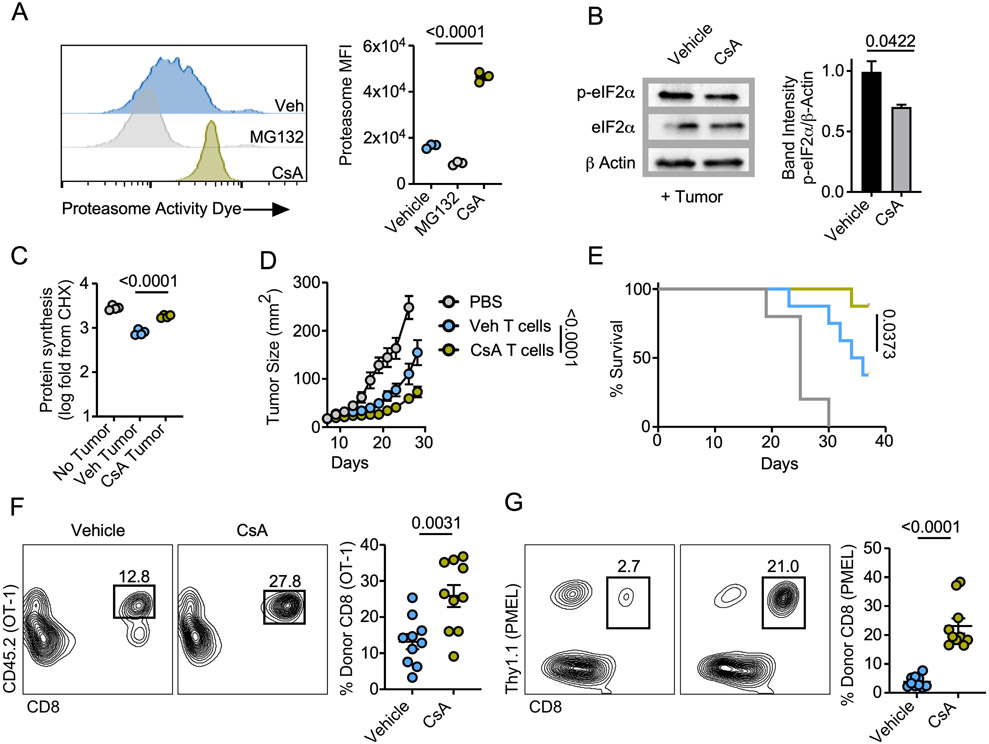
Protein synthesis supports robust immune responses. Nutrient competition and global cell stressors in the tumor microenvironment (TME) may impact protein translation in T cells and antitumor immunity. Using human and mouse tumors, we demonstrated here that protein translation in T cells is repressed in solid tumors. Reduced glucose availability to T cells in the TME led to activation of the unfolded protein response (UPR) element eIF2α (eukaryotic translation initiation factor 2 alpha). Genetic mouse models revealed that translation attenuation mediated by activated p-eIF2α undermines the ability of T cells to suppress tumor growth. Reprograming T-cell metabolism was able to alleviate p-eIF2α accumulation and translational attenuation in the TME, allowing for sustained protein translation. Metabolic and pharmacological approaches showed that proteasome activity mitigates induction of p-eIF2α to support optimal antitumor T-cell function, protecting from translation attenuation and enabling prolonged cytokine synthesis in solid tumors. Together, these data identify a new therapeutic avenue to fuel the efficacy of tumor immunotherapy.

Significance: Proteasome function is a necessary cellular component for endowing T cells with tumor killing capacity by mitigating translation attenuation resulting from the unfolded protein response induced by stress in the tumor microenvironment.


Conflict of interest statement

Conflict of Interest:

The authors declare no potential conflicts of interest.

Figures

Figure 1.
Figure 1.. Protein synthesis is attenuated in tumor infiltrating T cells
A) Schematic representation of flow cytometry-based L-homopropargylglycine Assay to measure protein translation. Representative FACS plots and quantification of protein synthesis rates in B) endogenous CD8+ tDLNs, splenocytes, and TILs from B16F1 tumor-bearing mice (n=5 mice) and C) CD8+ TILs and autologous PBMC from n=7 untreated pleiomorphic undifferentiated sarcoma (3), metastatic (bone) renal cell, multiple myeloma (1), breast (1), and melanoma (1) patients. D) Graphic of tumor-T cell contact independent transwell coculture assay. Representative FACS plots and quantification of protein synthesis rates from E) OT-1 splenocytes stimulated with OVA peptide or F) CD8+ PBMC activated with CD3/28 activators as (n=5 donors) in the tumor-T cell transwell coculture. G) Representative FACS plots and quantification of IFNγ and TNFα production from CD8+ PBMC activated with CD3/28 activators (n=5 donors) in the tumor-T cell transwell assay followed by PMA/Ionomycin stimulation ± pretreatment with protein synthesis inhibitor cycloheximide (CHX). Data represent three to five independent experiments. p values based on statistical analysis by one-way ANOVA with Dunnett’s multiple comparison tests against tumor (B), unpaired Student’s t-test (E) or paired Student’s t-test (C, F, G), error bars indicate the SEM. (hu) indicates human samples. For measurements of protein translation rate presented throughout the manuscript, each T cell condition was treated ± CHX, and CHX-treated wells were used to normalize protein synthesis rates in various in vivo and in vitro conditions defined as log2 (T cell protein synthesis rate/T cell protein synthesis rate in the presence of CHX).
Figure 2.
Figure 2.. Glucose stress undermines T cell translation
Quantification of A) exogenous glucose concentration, B) protein synthesis rates, C) IFNγ or D) TNFα production from the tumor-T cell transwell assay with increasing numbers of tumor cells seeded prior to introduction of T cells A-D) Significance indicated in figure based on comparison between T cells vs T cells with 200,000 tumor cells. ATP rate measured by Seahorse Bioanalysis from glycolysis (glycoATP) or mitochondria (mitoATP) in E) OT-1 CD8+ PBMC (n = 4 donors) in the tumor-T cell coculture transwell assay. Quantification of G) ATP rate from glycolysis or H) protein synthesis rate ± exogenous glucose (25mM) from OT-1 T cells in the tumor-T cell transwell assay. Quantification of I) ATP rate from glycolysis or J) protein synthesis rate with 2-deoxy-glucose (2DG) or vehicle added 2 hours prior to harvest to OT1 T cells in the tumor-T cell transwell assay. Glucose measurements, ATP rate data, and protein synthesis measurements represent one of three to six independent experiments. p values are noted based on statistical analysis by one-way ANOVA with a Dunnett’s multiple comparison correction (A-D), one-way ANOVA with a Tukey’s multiple comparison correction (E, G-J), or paired Student’s t-test (F), error bars indicate SEM.
Figure 3.
Figure 3.. p-eIF2α attenuates T cell translation and tumor control
A) Western blot analysis from OT-1 T cells cocultured with ascending numbers of tumor cells in the tumor-T cell transwell coculture assay where normalized p-eIF2α intensities were correlated with protein synthesis rates B) Western bot analysis from OT-1 T cells harvested from the tumor-T cell transwell coculture assay. C) Volcano plot analysis from a targeted gene array measuring 83 common UPR associated genes from OT-1 T cells harvested from the tumor-T cell coculture assay. Genes in red are upregulated in tumor condition while genes in green are downregulated. D, F) Western blot analysis and E, G) quantification of protein synthesis murine or F) human rates from D-E) LckcrePERKf/f (PKO) or wild type (WT) littermate OT-1 controls or F-G), eIF2αS51A+/− or WT littermate OT-1 controls harvested from the tumor-T cell transwell assay. H) Tumor growth rate and I) overall survival from adoptive transfer of 7-day expanded PKO, eIF2αS51A+/−, or WT littermate OT-1 T cells infused into CD57BL/6 mice bearing 7-day established B16-F1-OVA melanomas. For the experiment shown, eIF2αS51A+/− OT1 WT littermates were used. Western blot and FACS plots represent one of three to six independent experiments. UPR gene array was performed with T cells from 3 control or tumor-seeded transwells. Tumor control experiments represent one of two independent experiments. p values are noted based on statistical analysis by linear regression (A), one-way ANOVA with Tukey’s multiple comparison correction (E,G) mixed linear regression modeling (H) and log-rank, mantel-cox test of survival proportions (I), (N = 4-8 mice per group). Criteria for significance in the UPR gene array (C) were Fold Change > 1.5 and p < 0.05, normalization was performed using the ThermoFisher global normalization platform, all error bars indicate the SEM.
Figure 4.
Figure 4.. Metabolic reprogramming alleviates translation attenuation
A) Western blot analysis from OT-1 T cells cultured with vehicle, acute (2 hours), or chronic (36 hours) 2DG harvested from the tumor-T cells transwell coculture assay. B) Representative FACS plots and quantification of protein synthesis rates, and percent change in C) protein synthesis rate, D) glycolytic ATP or, E) mitochondrial ATP of chronic 2DG-treated OT1 T cells relative to vehicle controls from tumor or non-tumor conditions in the tumor-T cell transwell assay. F) Western blot analysis and G) Volcano plot analysis from a targeted gene array measuring 83 common UPR associated genes from OT-1 T cells conditioned with IL-2 or IL-15 prior to harvest from the tumor-T cell coculture assay. Genes in green are down regulated in the IL-15 condition relative to the IL-2 controls. H) Representative FACS plots and quantification of protein synthesis rates, and percent change in I) protein synthesis rate, J) glycolytic ATP or, K) mitochondrial ATP of IL-15 conditioned OT1 T cells relative to IL-2 controls from tumor or non-tumor conditions in the tumor-T cell transwell assay. Western blot and FACS plots represent one of three to six independent experiments. p values are noted in each panel based on statistical analysis by unpaired Student’s t-test (C-E, I-K), one-way ANOVA with Tukey’s multiple comparison correction (B, H). Criteria for significance in the UPR gene array (G) were Fold Change > 1.5 and p < 0.05, normalization was performed using the ThermoFisher global normalization platform, all error bars indicate the SEM.
Figure 5.
Figure 5.. Proteasome function sustains translation and tumor immunity.
A) Representative histograms and quantification of the frequency of proteasome activityhigh cells from IL-2 or IL-15 conditioned OT-1 T harvested from the tumor-T cell coculture assay. Proteasome inhibitor MG-132 was added as an internal control 2-4 hours prior to cell harvest. B) Western blot analysis, C) representative FACS plots and quantification of protein synthesis rates, and percent change in D) glycolytic ATP or E) mitochondrial ATP of IL-15 conditioned OT1 T cells treated with MG-132 or vehicle for 2-4 hours prior harvest from the tumor-T cell transwells. F) Heatmap of significantly enriched metabolites and G) pathway enrichment analysis in IL-15 conditioned OT-1 T cells treated with vehicle relative to MG-132 for 2-4 hours prior to harvest from the tumor-T cell transwell assay. H) Tumor growth rate and I) overall survival from adoptive transfer of 7-day expanded IL-15 conditioned OT-1 T cells treated with MG-132 or vehicle control for 4 hours prior to transfer to B6 mice bearing 7-day established B16-F1-OVA melanomas. Data are representative of one to three independent experiments. p values are noted in each panel based on statistical analysis by one way ANOVA with Dunnett’s (A) or Tukey’s multiple comparison correction (C), unpaired Student’s t-test (D-E) or mixed linear regression (H) and log-rank, mantel-cox test of survival proportions (I), (N = 4-8 mice per group), error bars indicate the SEM. Criteria for significant differences in metabolite fold change > 2 and raw p-value < 0.1 (F, G).
Figure 6.
Figure 6.. Proteasome stimulation enhances T cell tumor immunity
A) Proteasome activity of purified CD8+ splenocytes treated for 4 hours with cyclosporine A (CsA) or MG-132. B) Western blot analysis and band quantification or C) quantification of protein synthesis rates from IL-2 effector T cells conditioned with CsA or vehicle control prior to seeding in the tumor-T cell transwell assay. D) Tumor growth rate and E) overall survival from adoptive transfer of 7-day expanded vehicle or CsA conditioned OT-1 T cells infused to C57BL/6 mice bearing 7-day established B16-F1-OVA melanomas. Frequency of adoptively transferred F) CD45.2+ OT1 or G) Thy1.1+ pmel T cells infused as in D-E harvested from B16-F1-OVA or B16-F1 melanomas 5 days post transfer, respectively. Data are representative of one to three independent experiments. p values are noted in each panel based on statistical analysis by one way ANOVA with Tukey’s multiple comparison correction (A, C) two tailed Student’s t-test (B, F-G) or mixed linear regression (D) and log-rank, mantel-cox test of survival proportions (E), (N = 4-8 mice per group), all error bars indicate the SEM.

References

    1. Araki K, Morita M, Bederman AG, Konieczny BT, Kissick HT, Sonenberg N, et al. Translation is actively regulated during the differentiation of CD8(+) effector T cells. Nat Immunol 2017;18:1046–57 - PMC - PubMed
    1. Holcik M Could the eIF2α-Independent Translation Be the Achilles Heel of Cancer? Frontiers in Oncology 2015;5 - PMC - PubMed
    1. Scheuner D, Song B, McEwen E, Liu C, Laybutt R, Gillespie P, et al. Translational control is required for the unfolded protein response and in vivo glucose homeostasis. Mol Cell 2001;7:1165–76 - PubMed
    1. Bian Y, Li W, Kremer DM, Sajjakulnukit P, Li S, Crespo J, et al. Cancer SLC43A2 alters T cell methionine metabolism and histone methylation. Nature 2020;585:277–82 - PMC - PubMed
    1. Chang CH, Qiu J, O'Sullivan D, Buck MD, Noguchi T, Curtis JD, et al. Metabolic Competition in the Tumor Microenvironment Is a Driver of Cancer Progression. Cell 2015;162:1229–41 - PMC - PubMed

Publication types

Substances