. 2022 Sep 19;14(18):7470-7504.
doi: 10.18632/aging.204292. Epub 2022 Sep 19.

Identification of immune and stromal cell infiltration-related gene signature for prognosis prediction in acute lymphoblastic leukemia

Affiliations

Identification of immune and stromal cell infiltration-related gene signature for prognosis prediction in acute lymphoblastic leukemia

Wen-Liang Yu et al. Aging (Albany NY). .

Abstract

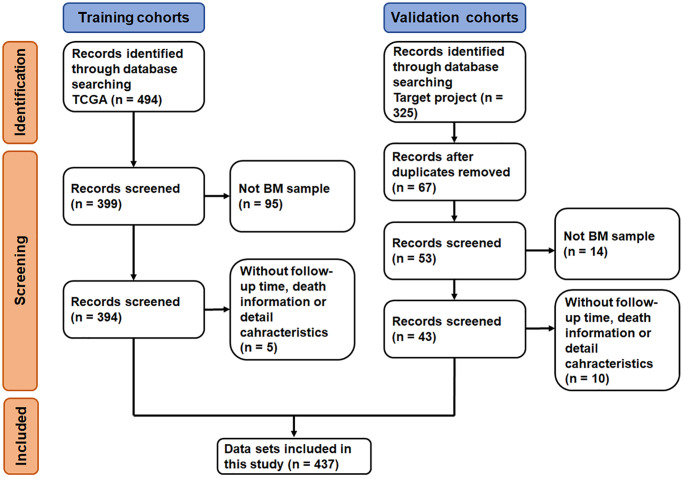
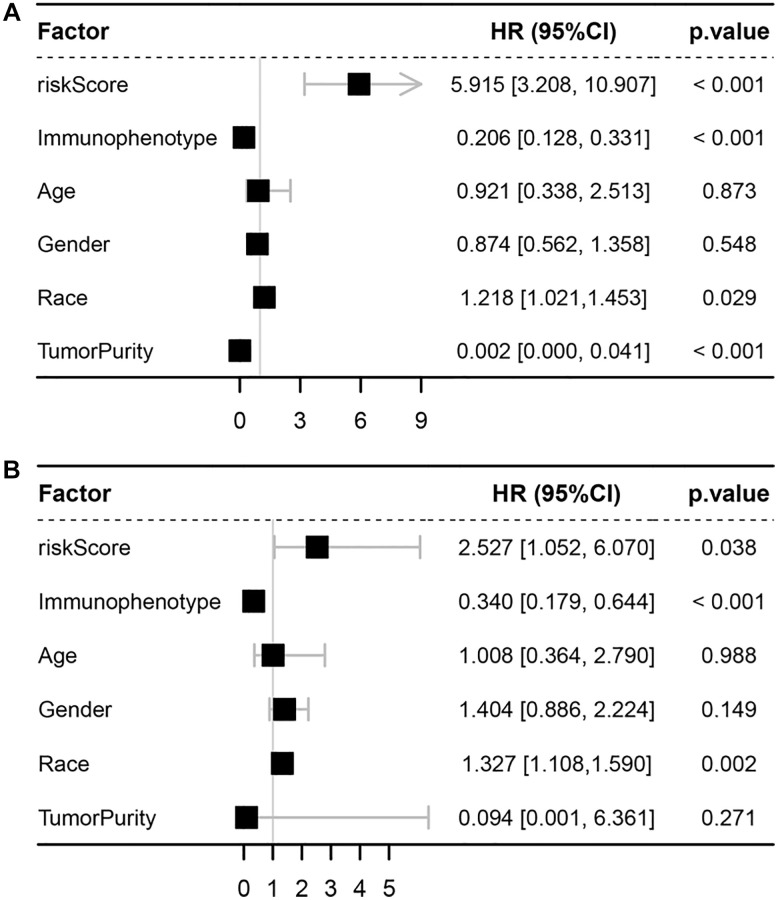
Acute lymphoblastic leukemia (ALL) is a common and life-threatening hematologic malignancy, its occurrence and progression are closely related to immune/stromal cell infiltration in the bone marrow (BM) microenvironment. However, no studies have described an immune/stromal cell infiltration-related gene (ISCIRG)-based prognostic signature for ALL. A total of 444 patients involving 437 bulk and 7 single-cell RNA-seq datasets were included in this study. Eligible datasets were searched and reviewed from the database of TCGA, TARGET project and GEO. Then an integrated bioinformatics analysis was performed to select optimal prognosis-related genes from ISCIRGs, construct a nomogram model for predicting prognosis, and assess the predictive power. After LASSO and multivariate Cox regression analyses, a seven ISCIRGs-based signature was proved to be able to significantly stratify patients into high- and low-risk groups in terms of OS. The seven genes were confirmed that directly related to the composition and status of immune/stromal cells in BM microenvironment by analyzing bulk and single-cell RNA-seq datasets. The calibration plot showed that the predicted results of the nomogram were consistent with the actual observation results of training/validation cohort. This study offers a reference for future research regarding the role of ISCIRGs in ALL and the clinical care of patients.

Keywords: acute lymphoblastic leukemia; bioinformatics; bone marrow microenvironment; immune cell infiltration; overall survival.


Conflict of interest statement

CONFLICTS OF INTEREST: The authors declare no conflicts of interest. The funders had no role in the design of the study; in the collection, analyses, or interpretation of data; in the writing of the manuscript, or in the decision to publish the results.

Figures

Figure 1
Figure 1
Flow-diagram of the datasets selection process.
Figure 2
Figure 2
The association between immune conditions and the clinical features in training group. (A, B) Distribution of immune scores and stromal scores for immunophenotypes of ALL patients. (C, D) Distribution of immune score and stromal score for races of ALL patients. (E) KM survival curve for comparison between samples with high and low stromal scores. (F) KM survival curve for comparison between samples with high and low immune scores.
Figure 3
Figure 3
Identification of DEGs based on immune score and stromal score. (A) Volcano plot of DEGs from the low/high immune and stromal score groups. Note: Genes with p < 0.05 are shown in red (FC > 2) and green (FC < −2). Black plots represent the remaining genes (those with no significant difference). (B) Heatmap of DEGs from the low/high immune and stromal score groups. (C) Venn plot for common up- and downregulated DEGs in the stromal and immune score groups.
Figure 4
Figure 4
Identification of an ISCIRG-based signature. (A) The coefficient profile plot was produced against the log(lambda) sequence. A vertical line was drawn at the value selected using ten-fold cross-validation, where an optimal lambda value resulted in ten features with nonzero coefficients. (B) Optimal parameter (lambda) selection in the LASSO model used ten-fold cross-validation via minimum criteria. The partial likelihood deviance (binomial deviance) curve was plotted versus the log(lambda) value. Dotted vertical lines were drawn at the optimal values by using the minimum criteria and the I standard error of the minimum criteria. (C) The mRNA expression profiles of the seven prognostic ISCIRGs between health and tumor tissues (bulk RNA-seq datasets). **p < 0.01, ***p < 0.001 and ****p < 0.0001. (D) Genetic alterations of seven prognostic ISCIRGs in ALL calculated by cBioPortal database. *p < 0.05.
Figure 5
Figure 5
Assessment of the prognostic value of the ISCIRG signature in training group. (A) KM survival curve for high-risk and low-risk patients. (B) Risk score analysis for the high-risk group and low-risk group. Upper panel: Patient survival status and time distributed by the risk score. Middle panel: Risk score curves of the ISCIRG signature. Bottom panel: Heatmaps of the expression levels of the seven ISCIRGs. The colors from green to red indicate the gene expression levels from low to high. (C) Time-dependent ROC curve for 1-, 3-, and 5-year OS rates.
Figure 6
Figure 6
Univariate and multivariate Cox analyses. (A) Forest plot of univariate Cox analyses. (B) Forest plot of multivariate Cox analyses.
Figure 7
Figure 7
Evaluation of the ISCIRGs-based signature via stratification of patients based on specific clinicopathological features. (A) B-ALL. (B) Mixed. (C) White. (D) Black or African American.
Figure 8
Figure 8
Cell composition and mRNA expression profiles of seven ISCIRGs in single-cell RNA-seq samples. (A) tSNE of the 27810 cells profiled here, with each cell color-coded for (left to right): its sample group of origin (ALL or health BM), the corresponding case (health cases: H1 to H4, ALL patients: P1 to P7) and the associated cell type. (B) Expression of marker genes for the cell types defined above each panel. (C) Proportion of cell type in BM of each participant. (D) The mRNA expression profiles of the seven ISCIRGs in each type of cell.
Figure 9
Figure 9
The landscape of immune cell infiltration between the high- and low-risk groups. (A) Proportion of cell type of the low- and high-risk groups in bulk RNA-seq samples. (B) Differential immune cell infiltrates between the high- and low-risk groups. (C) Correlation matrix of the relationship between the expression levels of the seven ISCIRGs and differential immune infiltration levels. (D) KM survival curves for patients with higher and lower proportions of specific cell.
Figure 10
Figure 10
Prognostic nomogram to predict the 1-, 3-, and 5-year OS of ALL patients. (A) Nomogram model to predict the prognosis of ALL patients. (B) Calibration test for the prognostic nomogram. (C) Calibration plot of the prognostic nomogram for predicting OS at 1-, 3-, and 5-years.
Figure 11
Figure 11
Web-based calculator for predicting OS in patients with ALL. (A) Web-based overall survival rate calculator. (B) The 95% CI of the web-based progression-free survival rate.

References

    1. Dander E, Palmi C, D'Amico G, Cazzaniga G. The Bone Marrow Niche in B-Cell Acute Lymphoblastic Leukemia: The Role of Microenvironment from Pre-Leukemia to Overt Leukemia. Int J Mol Sci. 2021; 22:4426. 10.3390/ijms22094426 - DOI - PMC - PubMed
    1. Alexander TB, Orgel E. Mixed Phenotype Acute Leukemia: Current Approaches to Diagnosis and Treatment. Curr Oncol Rep. 2021; 23:22. 10.1007/s11912-020-01010-w - DOI - PubMed
    1. Yu WL, Hua ZC. Chimeric Antigen Receptor T-cell (CAR T) Therapy for Hematologic and Solid Malignancies: Efficacy and Safety-A Systematic Review with Meta-Analysis. Cancers (Basel). 2019; 11:47. 10.3390/cancers11010047 - DOI - PMC - PubMed
    1. Bassan R, Hoelzer D. Modern therapy of acute lymphoblastic leukemia. J Clin Oncol. 2011; 29:532–43. 10.1200/JCO.2010.30.1382 - DOI - PubMed
    1. Hu J, Chen Z, Bao L, Zhou L, Hou Y, Liu L, Xiong M, Zhang Y, Wang B, Tao Z, Chen K. Single-Cell Transcriptome Analysis Reveals Intratumoral Heterogeneity in ccRCC, which Results in Different Clinical Outcomes. Mol Ther. 2020; 28:1658–72. 10.1016/j.ymthe.2020.04.023 - DOI - PMC - PubMed

Publication types