. 2023 Jan 26;141(4):391-405.
doi: 10.1182/blood.2022016892.

A MIR17HG-derived long noncoding RNA provides an essential chromatin scaffold for protein interaction and myeloma growth

Affiliations

A MIR17HG-derived long noncoding RNA provides an essential chromatin scaffold for protein interaction and myeloma growth

Eugenio Morelli et al. Blood. .

Abstract

Long noncoding RNAs (lncRNAs) can drive tumorigenesis and are susceptible to therapeutic intervention. Here, we used a large-scale CRISPR interference viability screen to interrogate cell-growth dependency to lncRNA genes in multiple myeloma (MM) and identified a prominent role for the miR-17-92 cluster host gene (MIR17HG). We show that an MIR17HG-derived lncRNA, named lnc-17-92, is the main mediator of cell-growth dependency acting in a microRNA- and DROSHA-independent manner. Lnc-17-92 provides a chromatin scaffold for the functional interaction between c-MYC and WDR82, thus promoting the expression of ACACA, which encodes the rate-limiting enzyme of de novo lipogenesis acetyl-coA carboxylase 1. Targeting MIR17HG pre-RNA with clinically applicable antisense molecules disrupts the transcriptional and functional activities of lnc-17-92, causing potent antitumor effects both in vitro and in vivo in 3 preclinical animal models, including a clinically relevant patient-derived xenograft NSG mouse model. This study establishes a novel oncogenic function of MIR17HG and provides potent inhibitors for translation to clinical trials.


Conflict of interest statement

Conflict-of-interest disclosure: N.C.M. serves on advisory boards of and as consultant to Takeda, BMS, Celgene, Janssen, Amgen, AbbVie, Oncopep, Karyopharm, Adaptive Biotechnology, and Novartis and holds equity ownership in Oncopep. K.C.A. serves on advisory boards to Janssen, Pfizer, Astrazeneca, Amgen, Precision Biosciences, Mana, Starton, and Raqia and is a Scientific Founder of OncoPep and C4 Therapeutics. R.A.Y. is a founder and shareholder of Syros Pharmaceuticals, Camp4 Therapeutics, Omega Therapeutics, and Dewpoint Therapeutics. E.M., S.G., and N.C.M filed a provisional patent on MIR17HG as a target for cancer therapy. D.C. reports other support from Stemline Therapeutics, Oncopeptides, and C4 Therapeutics outside the submitted work. The remaining authors declare no competing financial interests.

Figures

None
Graphical abstract
Figure 1.
Figure 1.
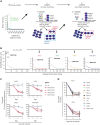
CRISPRi viability screens identify MIR17HG as a leading cell growth dependency in MM. (A) Schematic of CRISPRi viability screens. (B) Robust rank algorithm (RRA)-based ranked analysis of lncRNA dependencies in the secondary screen, considering 4 MM cell lines either together or individually. The top lncRNA dependency, MIR17HG, is highlighted, along with the protein-coding genes IRF4 and MYC used as positive controls. (C) CCK-8 proliferation assay of MM cell lines (AMO1, H929, KMS11, and KMS12BM) stably expressing KRAB-dCAS9 fusion protein and transduced with lentivectors to conditionally express anti-MIR17HG sgRNAs. CCK-8 assay was performed at indicated time points after exposure to doxycycline (0.5 μg/mL). Cell proliferation is calculated compared with parental cells infected with the empty sgRNA vector and exposed to doxycycline under the same conditions. (D) CCK-8 proliferation assay of MM cell lines (n = 11) transfected with 2 different ASOs targeting the MIR17HG pre-RNA or a nontargeting ASO (NC). ASOs were used at a concentration of 25 nM. Cell viability was measured 2 and 4 days after electroporation, and it is represented as % viability compared with cells transfected with NC-ASO. Data from 1 out of 3 independent experiments are shown in panel D. Data present mean ± standard deviation in panel D. ∗P < .05 by Student t test.
Figure 2.
Figure 2.
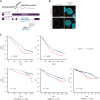
MIR17HG-derived lnc-17-92 mediates cell growth dependency in an miRNA- and DROSHA-independent manner. (A) Overview of MIR17HG locus, including both lncRNA (lnc-17-92)- and miRNA (miR-17-92)-derived transcripts. (B) Single molecule RNA FISH analysis of subcellular localization of lnc-17-92 in AMO1. Cell nuclei are stained by 4',6-diamidino-2-phenylindole (DAPI). (C) Prognostic significance (event-free survival [PFS] and overall survival [OS]) of high lnc-17-92 expression (top quartile) in 3 large cohorts of MM patients. (D) CCK-8 proliferation assay in AMO1 and H929 cells stably transduced with either a lentivector carrying pri-mir-17-92 (pri-miR) or a lentiviral vector carrying GFP as a control and transfected with 2 different ASOs targeting the 5' end (5'-ASO) of MIR17HG pre-RNA or a scrambled control (NC). Effects on cell proliferation were assessed 48 hours after transfection. (E) CCK-8 proliferation assay of DROSHA WT or KO AMO1 and H929 exposed to ASO1 (1 μM for AMO1 and 2.5 μM for H929) for 6 days. Western blot analysis of DROSHA expression in WT and KO cells. Vinculin was used as a protein-loading control. (F) Effects of lnc-17-92 depletion in a matrigel-based AMO1DR-KO xenograft in NOD SCID mice. Tumor growth of AMO1DR-KO with (ASO-1) or without (NC) lnc-17-92 depletion. (G) Survival analysis of tumor-injected mice. ∗P < .05. ns, not significant (P > .05 after Student t test).
Figure 2.
Figure 2.
MIR17HG-derived lnc-17-92 mediates cell growth dependency in an miRNA- and DROSHA-independent manner. (A) Overview of MIR17HG locus, including both lncRNA (lnc-17-92)- and miRNA (miR-17-92)-derived transcripts. (B) Single molecule RNA FISH analysis of subcellular localization of lnc-17-92 in AMO1. Cell nuclei are stained by 4',6-diamidino-2-phenylindole (DAPI). (C) Prognostic significance (event-free survival [PFS] and overall survival [OS]) of high lnc-17-92 expression (top quartile) in 3 large cohorts of MM patients. (D) CCK-8 proliferation assay in AMO1 and H929 cells stably transduced with either a lentivector carrying pri-mir-17-92 (pri-miR) or a lentiviral vector carrying GFP as a control and transfected with 2 different ASOs targeting the 5' end (5'-ASO) of MIR17HG pre-RNA or a scrambled control (NC). Effects on cell proliferation were assessed 48 hours after transfection. (E) CCK-8 proliferation assay of DROSHA WT or KO AMO1 and H929 exposed to ASO1 (1 μM for AMO1 and 2.5 μM for H929) for 6 days. Western blot analysis of DROSHA expression in WT and KO cells. Vinculin was used as a protein-loading control. (F) Effects of lnc-17-92 depletion in a matrigel-based AMO1DR-KO xenograft in NOD SCID mice. Tumor growth of AMO1DR-KO with (ASO-1) or without (NC) lnc-17-92 depletion. (G) Survival analysis of tumor-injected mice. ∗P < .05. ns, not significant (P > .05 after Student t test).
Figure 3.
Figure 3.
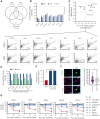
Lnc-17-92 forms a transcriptional axis with ACACA to promote proliferation and survival of MM cells. (A) Transcriptomic analysis after lnc-17-92 depletion in MM cell lines that have either DROSHA WT (AMO1, H929) or KO (AMO1DR-KO). Venn diagram of commonly downregulated genes (adjusted P < .05; log2FC < −1). Cells were exposed to ASO1 for 24 hours. (B) qRT-PCR analysis of lnc-17-92 targets in CD138+ cells from 3 MM patients exposed to ASO1 for 24 hours. The results shown are average mRNA expression levels after normalization with GAPDH and ΔΔCt calculations. RNA level in cells exposed to NC (vehicle) were set as an internal reference. (C) Correlation analysis between lnc-17-92 targets (mRNA) and lnc-17-92 in CD138+ MM patient cells from 2 large RNA-seq cohorts (DFCI/IFM, n = 360; MMRF/CoMMpass, n = 720). Spearman r obtained in DFCI/IFM (x-axis) and MMRF/CoMMpass (y-axis) data sets. Dotted red lines indicate r = 0.3. Individual correlation plots (below). (D) GLuc/SEAP dual reporter assay showing reduced activity of ACACA, ANO6, CCDC91, EPT1, EXT1, FER, and KIAA1109 promoter activity after lnc-17-92 knockdown using ASO1. The reporter vectors were cotransfected into 293T cells with either ASO1 or control ASO. Cells were harvested for the luciferase activity assay 48 hour after transfection. Results are shown as % of normalized GLuc activity in ASO1-transfected cells compared with control. (E) ChIRP-qPCR analysis showing effective amplification of ACACA promoter in chromatin purified using 2 lnc-17-92 antisense probe sets (ps1 and ps2), compared with chromatin purified using LacZ antisense probes (negative control). (F) (left) Snapshot obtained by dual RNA-FISH analysis of ACACA pre-mRNA (green) and lnc-17-92 (purple) in a representative AMO1 cell; (right) box plot showing the distance (nm) of ACACA pre-RNA spots to the nearest lnc-17-92 spots (n = 57) or to the nearest random spots (160); 300 nm was used as a cut-off determining proximity. (G) CCK-8 proliferation assay in 5 MM cells lines after transfection with siRNAs against lnc-17-92 targets. Two siRNAs were used for each target, plus a scramble siRNA (NC) as a control. Cell viability was measured at the indicated time point, represented as % of NC-transfected cells. ∗P < .05 after Student t test in panels B, D, and G or after Fisher exact test in panels E and F. Pt, patient.
Figure 4.
Figure 4.
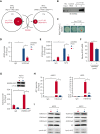
Lnc-17-92 directly interacts with c-MYC and promotes its occupancy at the ACACA promoter. (A) Western blot analysis of MYC in RPPD material precipitated with control RNA or lnc-17-92TV1 or lnc-17-92TV2. 5% input is used as a reference. (B) qRT-PCR analysis of lnc-17-92 (detecting lnc-17-92TV1) in RIP material precipitated using an anti-MYC antibody (α-MYC) or immunoglobulin G (IgG) control. LncRNA PVT1 is used as a positive control for its role as MYC interactor. (C) RNA Y3H using MYC as hybrid protein 2 and, as hybrid RNAs, a negative control RNA (−) or lnc-17-92TV1 or lnc-17-92TV2. (D) ChIP-qPCR analysis of MYC occupancy at the ACACA promoter in AMO1, H929, and U266MYC+ exposed for 24 hours to ASO1 or NC (vehicle). MYC occupancy at ACACA promoter is calculated as % of input chromatin. Western blot analysis of MYC from paired samples (below). GAPDH or α-tubulin were used as protein loading controls. (E) qRT-PCR analysis of ACACA mRNA in P493-6 cells exposed for 2 days to either doxycycline or DMSO to knock down MYC and then exposed for 2 additional days to either ASO1 or vehicle (NC) to deplete lnc-17-92. ACACA expression levels in cells exposed to NC were set as an internal reference. ∗P < .05, Student t test.
Figure 5.
Figure 5.
Lnc-17-92 mediates the assembly of a MYC-WDR82 transcriptional complex, leading to transcriptional and epigenetic activation of ACACA. (A) Schematic of integrated BioID and coimmunoprecipitation assay followed by mass-spectrometry analysis (Co-IP/MS) assays to explore the MYC-protein interacting network in the presence or absence of lnc-17-92 depletion. (B) Western blot analysis of WDR82 in RPPD material precipitated with lnc-17-92TV1 or lnc-17-92TV2 or with control RNA; 5% input is used as a reference. (C) RNA Y3H using WDR82 as hybrid protein 2 and, as hybrid RNAs, either a negative control RNA (−) or lnc-17-92TV1 or lnc-17-92TV2. Red arrows indicate yeast colony growth. (D) ChIP-qPCR analysis of H3K4me3 occupancy at ACACA promoter after silencing of WDR82 with a siRNA pool (n-4) in H929 (24-hour time point). Data are represented as % of input chromatin. (E) ChIP-qPCR analysis of MYC occupancy at the ACACA promoter after silencing of WDR82 with a siRNA pool (n-4) (24-hour time point). Data are represented as % of input chromatin. (F) qRT-PCR analysis of ACACA mRNA after silencing of WDR82 with a siRNA pool (n-4) (48-hour time point). Raw Ct values were normalized to GAPDH mRNA and expressed as ΔΔCt values calculated using the comparative cross threshold method. ACACA expression levels in cells transfected with NC were set as an internal reference. (G) ChIP-qPCR analysis of WDR82-GFP occupancy at the ACACA promoter in AMO1 exposed for 24 hours to gymnotic ASO1. Data are represented as % of input chromatin. Western blot analysis of WDR82-GFP from paired samples. α-Tubulin was used as the protein loading control. (H) ChIP-qPCR analysis of H3K4me3 occupancy at the ACACA promoter in AMO1 and H929 exposed for 24 hours to gymnotic ASO1. Data are represented as % of input chromatin. (I) Western blot analysis of H3, H3H3K4me1, H3H3K4me2, and H3H3K4me3 in AMO1 and H929 exposed for 24 hours to gymnotic ASO1. Lamin A/C was used as the protein loading controls (nuclear lysates). ∗P < .05, Student t test.
Figure 6.
Figure 6.
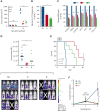
Therapeutic inhibitors of MIR17HG exert potent antitumor activity in vitro and in vivo in animal models of human MM. (A) Subcutaneous in vivo tumor growth of AMO1 cells in NOD SCID mice, 21 days after treatment with G2-15b∗-TO (G; n = 5), B9-19-TO (B; n = 5), or vehicle (NC; n = 5). (B-C) qRT-PCR analysis of lnc-17-92 (C) and lnc-17-92 targets (D) in AMO1 xenografts, retrieved from animals treated with G2-15b∗-TO (G; n = 1), B9-19-TO (B; n = 1), or vehicle (NC; n = 1) as a control. Raw Ct values were normalized to ACTB mRNA and expressed as ΔΔCt values calculated using the comparative cross threshold method. Expression levels in NC were set as an internal reference. (D) Bioluminescent imaging–based (BLI-based) measurement of in vivo tumor growth of MOLP8-luc+ in NSG mice, after treatment with G2-15b∗-TO (G; n = 8), B9-19-TO (B; n = 6), or vehicle (NC; n = 11). On the top, a scatter plot shows the analysis of bioluminescence intensity. Red bars indicate median value. Bioluminescence was measured at the end of the treatment cycle (day 15). Image acquisition (below). Mice removed from the study owing to failed IV injection of tumor cells are covered by a black rectangle. (E) Survival analysis from experiment in panel E. (F) Human κ light chain enzyme-linked immunosorbent assay–based measurement of in vivo tumor growth of MM patient cells in NSG mice (PDX-NSG), after treatment with G2-15b∗-TO (G; n = 2), bortezomib (BTZ; n = 2), or vehicle (NC; n = 3). Black arrows indicate treatments. ∗P < .05; ∗∗P < .01; ∗∗∗P < .001. Max, maximum; Min, minimum; ns, not significant.

Comment in

References

    1. Gulla A, Anderson KC. Multiple myeloma: the (r)evolution of current therapy and a glance into future. Haematologica. 2020;105(10):2358–2367. - PMC - PubMed
    1. Morelli E, Gulla A, Rocca R, et al. The non-coding RNA landscape of plasma cell dyscrasias. Cancers (Basel) 2020;12(2):320. - PMC - PubMed
    1. Pichiorri F, Suh SS, Rocci A, et al. Downregulation of p53-inducible microRNAs 192, 194, and 215 impairs the p53/MDM2 autoregulatory loop in multiple myeloma development. Cancer Cell. 2016;30(2):349–351. - PubMed
    1. Amodio N, Stamato MA, Juli G, et al. Drugging the lncRNA MALAT1 via LNA gapmeR ASO inhibits gene expression of proteasome subunits and triggers anti-multiple myeloma activity. Leukemia. 2018;32(9):1948–1957. - PMC - PubMed
    1. Morelli E, Biamonte L, Federico C, et al. Therapeutic vulnerability of multiple myeloma to MIR17PTi, a first-in-class inhibitor of pri-miR-17-92. Blood. 2018;132(10):1050–1063. - PMC - PubMed

Publication types