. 2022 Dec;13(6):3149-3162.
doi: 10.1002/jcsm.13084. Epub 2022 Sep 20.

Ginsenoside Rd ameliorates muscle wasting by suppressing the signal transducer and activator of transcription 3 pathway

Affiliations

Ginsenoside Rd ameliorates muscle wasting by suppressing the signal transducer and activator of transcription 3 pathway

Yoseph Toni Wijaya et al. J Cachexia Sarcopenia Muscle. 2022 Dec.

Abstract

Background: The effects of some drugs, aging, cancers, and other diseases can cause muscle wasting. Currently, there are no effective drugs for treating muscle wasting. In this study, the effects of ginsenoside Rd (GRd) on muscle wasting were studied.

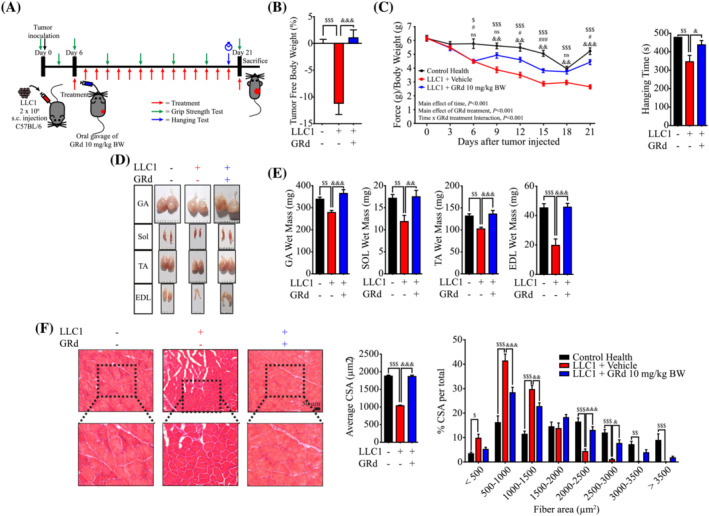
Methods: Tumour necrosis factor-alpha (TNF-α)/interferon-gamma (IFN-γ)-induced myotube atrophy in mouse C2C12 and human skeletal myoblasts (HSkM) was evaluated based on cell thickness. Atrophy-related signalling, reactive oxygen species (ROS) level, mitochondrial membrane potential, and mitochondrial number were assessed. GRd (10 mg/kg body weight) was orally administered to aged mice (23-24 months old) and tumour-bearing (Lewis lung carcinoma [LLC1] or CT26) mice for 5 weeks and 16 days, respectively. Body weight, grip strength, inverted hanging time, and muscle weight were assessed. Histological analysis was also performed to assess the effects of GRd. The evolutionary chemical binding similarity (ECBS) approach, molecular docking, Biacore assay, and signal transducer and activator of transcription (STAT) 3 reporter assay were used to identify targets of GRd.

Results: GRd significantly induced hypertrophy in the C2C12 and HSkM myotubes (average diameter 50.8 ± 2.6% and 49.9% ± 3.7% higher at 100 nM, vs. control, P ≤ 0.001). GRd treatment ameliorated aging- and cancer-induced (LLC1 or CT26) muscle atrophy in mice, which was evidenced by significant increases in grip strength, hanging time, muscle mass, and muscle tissue cross-sectional area (1.3-fold to 4.6-fold, vs. vehicle, P ≤ 0.05; P ≤ 0.01; P ≤ 0.001). STAT3 was found to be a possible target of GRd by the ECBS approach and molecular docking assay. Validation of direct interaction between GRd and STAT3 was confirmed through Biacore analysis. GRd also inhibited STAT3 phosphorylation and STAT3 reporter activity, which led to the inhibition of STAT3 nuclear translocation and the suppression of downstream targets of STAT3, such as atrogin-1, muscle-specific RING finger protein (MuRF-1), and myostatin (MSTN) (29.0 ± 11.2% to 84.3 ± 30.5%, vs. vehicle, P ≤ 0.05; P ≤ 0.01; P ≤ 0.001). Additionally, GRd scavenged ROS (91.7 ± 1.4% reduction at 1 nM, vs. vehicle, P ≤ 0.001), inhibited TNF-α-induced dysregulation of ROS level, and improved mitochondrial integrity (P ≤ 0.05; P ≤ 0.01; P ≤ 0.001).

Conclusions: GRd ameliorates aging- and cancer-induced muscle wasting. Our findings suggest that GRd may be a novel therapeutic agent or adjuvant for reversing muscle wasting.

Keywords: cachexia; ginsenoside Rd; muscle wasting; sarcopenia; signal transducer and activator of transcription 3.


Conflict of interest statement

The authors declare that they have no competing interests.

Figures

Figure 1
Figure 1
GRd protects C2C12 and HSkM myotubes against muscle cell atrophy. (A, B) C2C12 myotubes were treated with GRd at the indicated concentration in the presence or absence of TI (TNF‐α at 20 ng/mL and IFN‐γ at 100 U/mL) for 24 h. (C, D) HSkM myotubes were treated with GRd at the indicated concentration in the presence or absence of TNF‐α (10 ng/mL) for 24 h. Then, C2C12 and HSkM myotubes were stained with anti‐MHC ab. (A, C) Representative images were shown. (B, D) Average myotube diameter was measured by ImageJ software. The data were shown as mean ± SEM of more than 100 myotubes from 10 randomly chosen fields. One‐way ANOVA (B–D) followed by Tukey's multiple comparisons were used to compare between data (*P ≤ 0.05; **P ≤ 0.01; ***P ≤ 0.001).
Figure 2
Figure 2
GRd improves muscle function and mass in aged mice. (A) Experiment design of sarcopenia model with GRd treatment. Aged C57BL/6 mice (23 to 24 months old) were orally administrated with GRd (10 mg/kg body weight/day) or vehicle daily for 36 days. Adult C57BL/6 mice (4 months old) were used as healthy control. Four months old mice (n = 8), 23 to 24 months old mice + vehicle (n = 8), and 23 to 24 months old mice + GRd 10 mg/kg (n = 8). (B) Grip strength was evaluated every 7 days (the main effect of treatment, P < 0.001; the main effect of time, P = 0.0034; interaction, P < 0.001). (C) Hanging test was performed at day 34. (D, E) Skeletal muscles, including GA, SOL, TA, and EDL, were dissected at day 36. Representative images of skeletal muscles were shown. The weights of skeletal muscles and organs were determined. (F) GA muscles were stained with H&E staining, and representative images were shown. The average cross‐sectional area (CSA) of GA muscle fibre was quantified by ImageJ and plotted depending on the frequency as indicated. The data were shown as mean ± SEM. One‐way (C, E, F) or two‐way (B, F) ANOVA followed by Tukey's multiple comparisons were used to compare between data (ns, not significant; $ P < 0.05, $$ P < 0.01, $$$ P ≤ 0.001, control adult vs. control old; ## P < 0.01, ### P ≤ 0.001, control adult vs. old + GRd; & P < 0.05, && P < 0.01, &&& P ≤ 0.001, control old vs. old + GRd).
Figure 3
Figure 3
GRd ameliorates Lewis lung carcinoma (LLC1)‐induced cancer cachexia in vivo. (A) Experiment design of LLC1‐induced cancer cachexia. C57BL/6 mice were injected subcutaneously (s.c.) with LLC1 cells. Then, after 6 days of injection, mice were orally administrated with GRd (10 mg/kg body weight/day) or vehicle daily for 16 days. Mice without tumour inoculation was used as control health. Control (n = 6), LLC1 + vehicle (n = 6), and LLC1 + GRd 10 mg/kg (n = 6). (B) Tumor‐free body weight was measured in the day 21. (C) Muscle performance for grip strength was evaluated every 3 days (the main effect of treatment, P < 0.001; the main effect of time, P < 0.001; interaction, P < 0.001), and hanging test was conducted on day 20. (D, E) Skeletal muscles, including GA, SOL, TA, and EDL, were dissected after 21 days, and the weights were determined. Representative images of skeletal muscles were shown. (F) GA muscles were stained with H&E staining, and representative images were shown. The average cross‐sectional area (CSA) of GA muscle fibre was quantified by ImageJ and plotted depending on the frequency as indicated. The data were shown as mean ± SEM. One‐way (B, C, E, F) or two‐way (C, F) ANOVA followed by Tukey's multiple comparisons were used to compare between data (ns, not significant; $ P ≤ 0.05, $$ P ≤ 0.01,$$$ P ≤ 0.001, control health vs. LLC1 + vehicle; # P ≤ 0.05, ### P ≤ 0.001, control health vs. LLC1 + GRd; & P ≤ 0.05, && P ≤ 0.01, &&& P ≤ 0.001, LLC1 + vehicle vs. LLC1 + GRd).
Figure 4
Figure 4
GRd ameliorates (CT26)‐induced cancer cachexia in vivo. (A) Experiment design of CT26‐induced cancer cachexia. BALB/c mice were injected subcutaneously with CT26 cells. Then, after 6 days of injection, mice were orally administrated with GRd (10 mg/kg body weight/day) or vehicle daily for 16 days. Mice without tumour inoculation was used as control health. Control (n = 6), CT26 + vehicle (n = 6), and CT26 + GRd 10 mg/kg (n = 6). (B) Tumor free body weight was measured in the day 21. (C) Muscle performance for grip strength was evaluated every 3 days (the main effect of treatment, P < 0.001; the main effect of time, P < 0.001; interaction, P < 0.001), and hanging test was conducted on day 20. (D, E) Skeletal muscles, including GA, SOL, TA, and EDL were dissected after 21 days, and the weights were determined. Representative images of skeletal muscles were shown. (F) GA muscles were stained with H&E staining, and representative images were shown. The average cross‐sectional area (CSA) of GA muscle fibre was quantified by ImageJ and plotted depending on the frequency as indicated. The data were shown as mean ± SEM. One‐way (B, C, E, F) or two‐way (C, F) ANOVA followed by Tukey's multiple comparisons were used to compare between data (ns, not significant; $ P ≤ 0.05, $$ P ≤ 0.01, $$$ P ≤ 0.001, control health vs. CT26 + vehicle. # P ≤ 0.05, ## P ≤ 0.01, ### P ≤ 0.001, control health vs. CT26 + GRd. & P ≤ 0.05, && P ≤ 0.01, &&& P ≤ 0.001, CT26 + vehicle vs. CT26 + GRd).
Figure 5
Figure 5
GRd inhibits muscle wasting through direct binding with STAT3. (A) Molecular docking between GRd and STAT3. (B) Biacore analysis was used to analyse the binding ability of GRd to STAT3. (C) C2C12 cells were transduced with STAT3 reporter, and then treated for 8 h with TNF‐α at 20 ng/mL and IFN‐γ at 100 U/mL (TI) in the presence or absence of GRd (100 nM). STAT3 reporter expressions were measured by flow cytometry. (D) C2C12 myotubes were treated for 24 h with TNF‐α at 20 ng/mL and IFN‐γ at 100 u/mL in the presence or absence of GRd (100 nM) as indicated (n = 4). Then, the protein levels of pSTAT3/tSTAT3 were evaluated by western blot. Representative images were shown and images were measured by ImageJ software. The data were shown as mean ± SEM. (E, F) GA tissue lysates were isolated from aged mice (n = 3), LLC1 (n = 6), or CT26‐implanted mice (n = 6). Then, the protein levels of pSTAT3/tSTAT3 were evaluated by western blot. Representative images were shown and images were measured by ImageJ software. The data were shown as mean ± SEM. One‐way (C‐F) ANOVA followed by Tukey's multiple comparisons were used to compare between data (*P ≤ 0.05; **P ≤ 0.01; ***P ≤ 0.001).
Figure 6
Figure 6
GRd inhibits STAT3 nuclear translocalization. (A) C2C12 myotubes were incubated for 30 min with TI ± GRd (100 nM) as indicated and stained with antibodies against pSTAT3 (green) and counterstained with DAPI (blue) to determine the localization of STAT3 in the nucleus. (B–D) Cryosections of GA muscles from aged mice, LLC1, and CT26‐implanted mice were stained with antibodies against pSTAT3 (green) and counterstained with DAPI (blue). Representative images were shown. Arrows indicate nuclear localization of STAT3.
Figure 7
Figure 7
GRd suppresses the downstream pathways of STAT3. (A) C2C12 myotubes were treated for 24 h with TNF‐α at 20 ng/mL, IFN‐γ at 100 U/mL or GRd (100 nM) as indicated, and then protein levels of muscle atrophy‐related genes were evaluated by western blot. The data were shown as mean ± SEM of three to four independent experiments. (B–D) GA tissue lysates were isolated from aged mice‐, LLC1‐, and CT26‐implanted mice, respectively. Then, the protein levels of muscle atrophy‐related genes were evaluated by western blot. Representative images were shown, and images were measured by ImageJ software. The data were shown as mean ± SEM (n = 6). One‐way (A–D) ANOVA followed by Tukey's multiple comparisons were used to compare between data (*P ≤ 0.05; **P ≤ 0.01; ***P ≤ 0.001).
Figure 8
Figure 8
GRd reduces ROS levels and protects mitochondrial integrity. (A) C2C12 myotubes were incubated for 4 h with TNF‐α (20 ng/mL), with/without GRd (100 nM) as indicated, and then analysed using fluorescence microscope to analyse ROS levels. Representative fluorescence images were shown, and fluorescence intensity was quantified using the ImageJ software. The data were presented as mean ± SEM of at least 10 randomly chosen fields of each condition. (B) The effect of GT on scavenging hydroxyl radicals was analysed using iron (II)‐dependent TBA reactive substance. Ascorbic acid (AA) at 125 ng/mL was used as a positive control. Data were shown as mean ± SEM of three independent experiments. (C) C2C12 myoblast was incubated for 24 h with TNF‐α (20 ng/mL) ± GRd (100 nM) as indicated, and mitochondria ROS were measured by flow cytometry. Representative FACS profiles were shown, and the data were presented as mean ± SEM of three independent experiments. (D) C2C12 myoblast was incubated for 24 h with TNF‐α (20 ng/mL) with/without GRd (100 nM) as indicated, and mitochondrial membrane potential (ΔѰm) were measured by flow cytometry. Representative FACS profiles were shown, and the data were presented as mean ± SEM of three independent experiments. (E) C2C12 myoblast was incubated for 24 h with TNF‐α (20 ng/mL) or GRd (100 nM) as indicated, and then the number of mitochondria were measured by fluorescence microscope. Representative fluorescence images were shown, and fluorescence intensity was quantified using the ImageJ software. The data were presented as mean ± SEM of three independent experiment. (F) C2C12 myoblast were differentiated for 72 h with TNF‐α (20 ng/mL) in the presence or absence of GRd (100 nM), and then the mtDNA copy number were quantified by RT‐PCR. The data were presented as mean ± SEM of four independent experiments. One‐way (A–F) ANOVA followed by Tukey's multiple comparisons were used to compare between data (*P ≤ 0.05; **P ≤ 0.01; ***P ≤ 0.001).

References

    1. Furrer R, Handschin C. Muscle Wasting Diseases: Novel Targets and Treatments. Annu Rev Pharmacol Toxicol 2019;59:315–339. - PMC - PubMed
    1. Cruz‐Jentoft AJ, Sayer AA. Sarcopenia. Lancet 2019;393:2636–2646. - PubMed
    1. McGovern J, Dolan RD, Skipworth RJ, Laird BJ, McMillan DC. Cancer cachexia: a nutritional or a systemic inflammatory syndrome? Br J Cancer 2022;127:379–382. - PMC - PubMed
    1. Ma JF, Sanchez BJ, Hall DT, Tremblay AK, Di Marco S, Gallouzi IE. STAT3 promotes IFNγ/TNFα‐induced muscle wasting in an NF‐κB‐dependent and IL‐6‐independent manner. EMBO Mol Med 2017;9:622–637. - PMC - PubMed
    1. Anker MS, Holcomb R, Muscaritoli M, von Haehling S, Haverkamp W, Jatoi A, et al. Orphan disease status of cancer cachexia in the USA and in the European Union: a systematic review. J Cachexia Sarcopenia Muscle 2019;10:22–34. - PMC - PubMed

Publication types