. 2022 Sep 20;13(1):5498.
doi: 10.1038/s41467-022-32980-z.

Deciphering multi-way interactions in the human genome

Affiliations

Deciphering multi-way interactions in the human genome

Gabrielle A Dotson et al. Nat Commun. .

Abstract

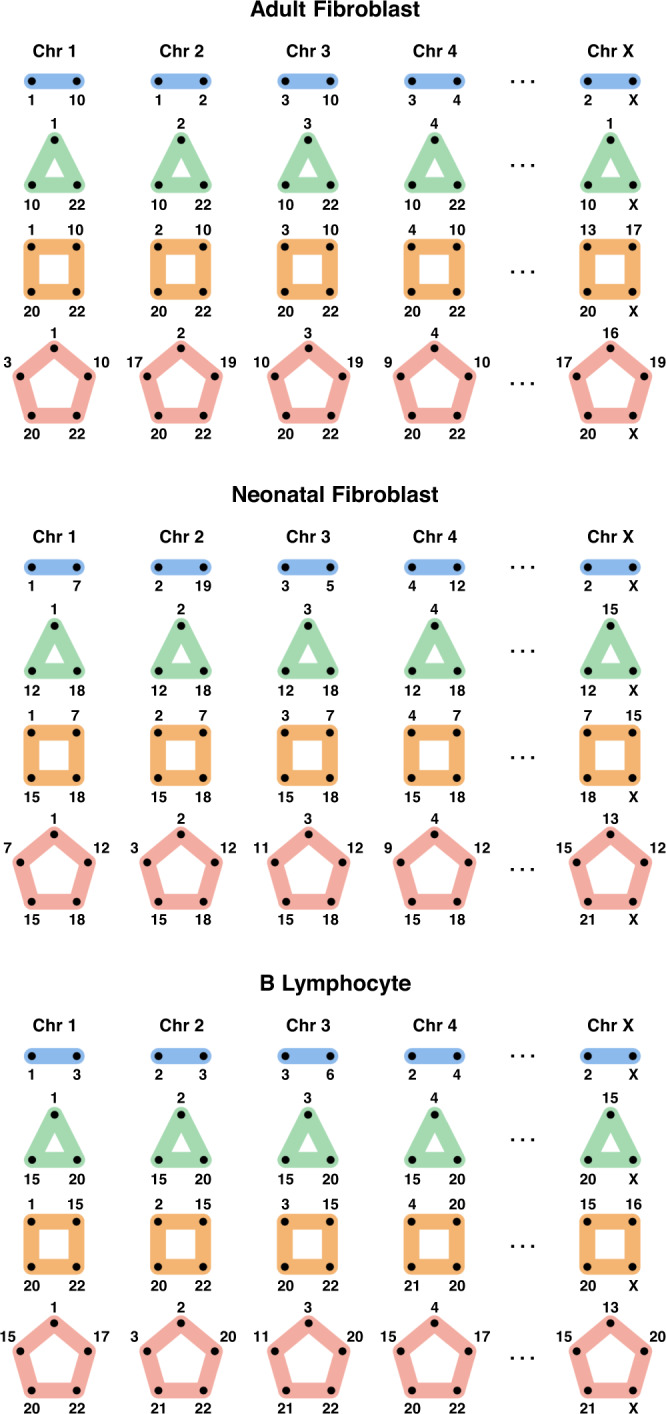
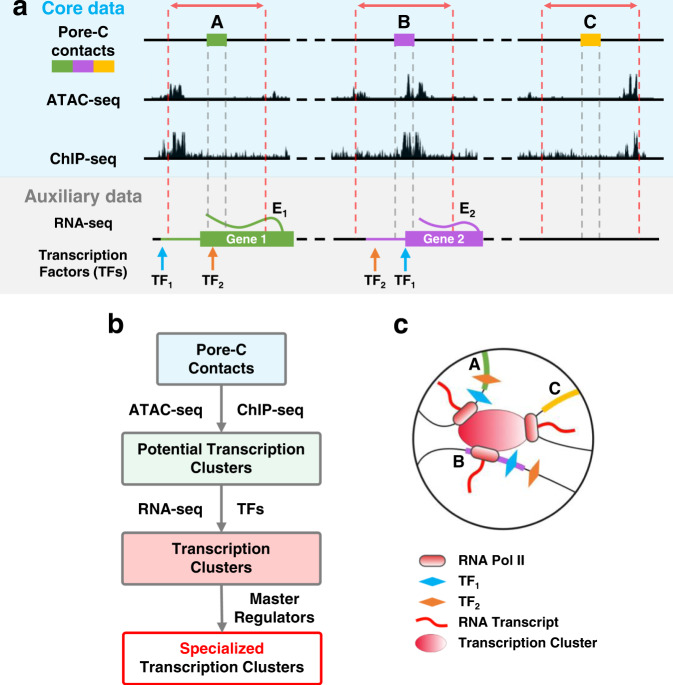
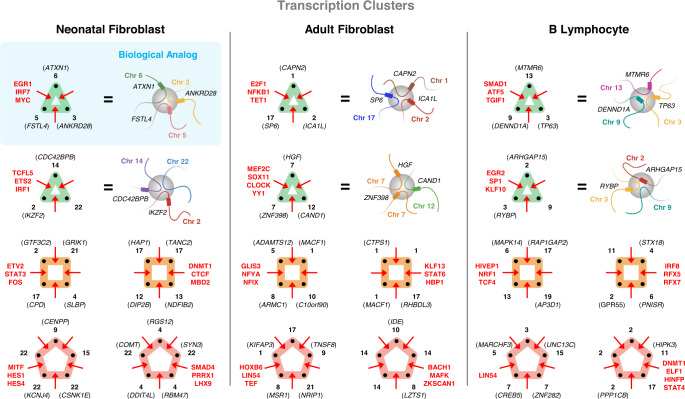
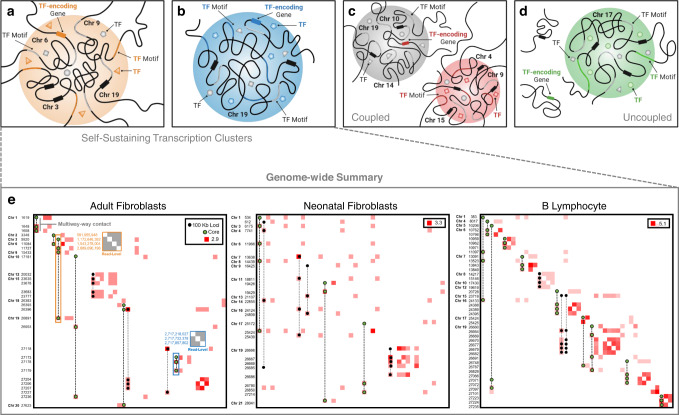
Chromatin architecture, a key regulator of gene expression, can be inferred using chromatin contact data from chromosome conformation capture, or Hi-C. However, classical Hi-C does not preserve multi-way contacts. Here we use long sequencing reads to map genome-wide multi-way contacts and investigate higher order chromatin organization in the human genome. We use hypergraph theory for data representation and analysis, and quantify higher order structures in neonatal fibroblasts, biopsied adult fibroblasts, and B lymphocytes. By integrating multi-way contacts with chromatin accessibility, gene expression, and transcription factor binding, we introduce a data-driven method to identify cell type-specific transcription clusters. We provide transcription factor-mediated functional building blocks for cell identity that serve as a global signature for cell types.


Conflict of interest statement

S.D. is an employee of iReprogram, L.L.C. L.M. and I.R. are co-founders of iReprogram, L.L.C. N.B. is an employee of Oxford Nanopore Technologies. S.L., C.C., and I.R. have submitted a patent application for the computational framework (2115-008250-US-PS1). The remaining authors declare no competing interests.

Figures

Fig. 1
Fig. 1. Pore-C experimental and data workflow.
a The Pore-C experimental protocol, which captures pairwise and multi-way contacts (see Methods). b Representation of multi-way contacts at different resolutions (top). Incidence matrix visualizations of a representative example from Chromosome 8 in adult human fibroblasts at each resolution (bottom). The numbers in the left columns represent the location of each genomic locus present in a multi-way contact, where values are either the chromosome base-pair position (read-level) or the bin into which the locus was placed (binning at 100 kb, 1 Mb, or 25 Mb). c Hypergraph representation of Pore-C contacts (left) and an incidence matrix (right) of four multi-way contacts within (yellow-to-yellow) and between (yellow-to-purple) chromosomes. Contacts correspond to examples from (a). The numbers in the left column represent genomic bins in which a locus resides. Each vertical line represents a multi-way contact, with nodes at participating genomic loci. d Multi-way contacts can be decomposed into pairwise contacts. Decomposed multi-way contacts can be represented using graphs (left) or incidence matrices (middle), which when decomposed are interchangeable with traditional Hi-C contact matrices (right). Contacts correspond to examples from (a) and (c). e Flowchart overview of the computational framework. Descriptions of file type formats (red text) are in Supplementary Table 1.
Fig. 2
Fig. 2. Local organization of the genome.
a Incidence matrix visualization of a region in Chromosome 22 from adult fibroblasts (V1-V4). The numbers in the left column represent genomic loci at 100 kb resolution, vertical lines represent multi-way contacts, where nodes indicate the corresponding locus' participation in this contact. The blue and yellow regions represent two TADs, T1 and T2. The six contacts, denoted by the labels i-vi, are used as examples to show intra- and inter-TAD contacts in (b, c, and d). b Hyperedge and read-level visualizations of the multi-way contacts i-vi from the incidence matrix in (a). Blue and yellow shaded areas (bottom) indicate which TAD each locus corresponds to. c A hypergraph is constructed using the hyperedges from (b) (multi-way contacts i-vi from a). The hypergraph is decomposed into its pairwise contacts in order to be represented as a graph. d Contact frequency matrices were constructed by separating all multi-way contacts within this region of Chromosome 22 into their pairwise combinations. TADs were computed from the pairwise contacts using the methods from. Example multi-way contacts i-vi are superimposed onto the contact frequency matrices. Multi-way contacts in this figure were determined at 100 kb resolution after noise reduction, originally derived from read-level multi-way contacts (see Hypergraph Filtering in Methods).
Fig. 3
Fig. 3. Patterning of intra- and inter-chromosomal contacts.
a Incidence matrix visualization of Chromosome 22 in adult fibroblasts. The numbers in the left column represent genomic loci at 1 Mb resolution. Each vertical line represents a multi-way contact, in which the nodes indicate the corresponding locus' participation in this contact. b Frequencies of Pore-C contacts in Chromosome 22. Bars are colored according to the order of contact. Blue, green, orange, and red correspond to 2-way, 3-way, 4-way, and 5-way contacts. c The most common 2-way, 3-way, 4-way, and 5-way intra-chromosome contacts within Chromosome 22 are represented as motifs, color-coded similarly to (b). d Zoomed in incidence matrix visualization in 100 kb resolution shows the multi-way contacts between three 1 Mb loci: L19 (blue), L21 (yellow), and L22 (red). An example 100 kb resolution multi-way contact is zoomed to read-level resolution. e Hypergraph representation of the 100 kb multi-way contacts from (d). Blue, yellow, and red labels correspond to loci L19, L21, and L22, respectively. f Incidence matrix visualization of the inter-chromosomal multi-way contacts between Chromosome 20 (orange) and Chromosome 22 (green) in 1 Mb resolution. Within this figure, all data are from one adult fibroblast sequencing run (V2) and multi-way contacts were determined after noise reduction at 1 Mb or 100 kb resolution accordingly (see Hypergraphs and Hypergraph Filtering in Methods).
Fig. 4
Fig. 4. Genome-wide patterning of multi-way contacts.
Incidence matrix visualization of the top 10 most common multi-way contacts per chromosome. Matrices are constructed at 25 Mb resolution for both adult fibroblasts (top, V1-V4) and B lymphocytes (bottom). Specifically, 5 intra-chromosomal and 5 inter-chromosomal multi-way contacts were identified for each chromosome with no repeated contacts. If 5 unique intra-chromosomal multi-way contacts are not possible in a chromosome, they are supplemented with additional inter-chromosomal contacts. Vertical lines represent multi-way contacts, nodes indicate the corresponding locus' participation in a multi-way contact, and color-coded rows delineate chromosomes. Highlighted boxes indicate example intra-chromosomal contacts (red), inter-chromosomal contacts (magenta), and combinations of intra- and inter-chromosomal contacts (blue). Examples for each type of contact are shown in the top right corner. Multi-way contacts of specific regions are compared between cell types by connecting highlighted boxes with black dashed lines, emphasizing similarities and differences between adult fibroblasts and B lymphocytes. Normalized degree of loci participating in the top 10 most common multi-way contacts for each chromosome in adult fibroblast and B lymphocytes are shown on the left. Red dashed lines indicate the mean degree for adult fibroblasts and B lymphocytes (top and bottom, respectively). Genomic loci that do not participate in the top 10 most common multi-way contacts for adult fibroblasts or B lymphocytes were removed from their respective incidence matrices and degree plots. Multi-way contacts were determined at 25 Mb resolution after noise reduction (see Hypergraphs and Hypergraph Filtering in Methods).
Fig. 5
Fig. 5. Inter-chromosomal interactions.
The most common 2-way, 3-way, 4-way, and 5-way inter-chromosome combinations for each chromosome are represented using motifs from adult fibroblasts (top), neonatal fibroblasts (center), and B lymphocytes (bottom). Rows represent the combinations of 2-way, 3-way, 4-way, and 5-way inter-chromosomal interactions, and columns are the chromosomes. Inter-chromosomal combinations are determined using 25 Mb resolution multi-way contacts after noise reduction (see Hypergraphs and Hypergraph Filtering in Methods) and are normalized by chromosome length. Here we only consider unique chromosome instances (i.e., multiple loci in a single chromosome are ignored).
Fig. 6
Fig. 6. Data-driven identification of transcription clusters.
a Blue shaded area: A 5 kb region before and after each locus in a Pore-C read (region between red dashed lines) is queried for chromatin accessibility and RNA Pol II binding (ATAC-seq and ChIP-seq, respectively). Multi-way contacts between accessible loci that have ≥1 instance of RNA Pol II binding are indicative of potential transcription clusters. Gray shaded area: Gene expression (RNA-seq, E1 for gene 1 and E2 for gene 2, respectively) and transcription factor binding sites (TF1 and TF2) are integrated to determine potential coexpression and coregulation within multi-way contacts with multiple genes. Transcription factor binding sites are queried ±5 kb from the gene's transcription start site (see Data-driven Identification of Transcription Clusters in Methods). Genes are colored based on the overlapping Pore-C locus, and the extended horizontal line from each gene represents the 5 kb flanking region used to query transcription factor binding sites. b Pipeline for extracting transcription clusters (Supplementary Methods). c Schematic representation of a transcription cluster.
Fig. 7
Fig. 7. Example transcription clusters.
Six examples of transcription clusters are shown for neonatal fibroblasts (left), adult fibroblasts (center), and B lymphocytes (right) as multi-way contacts (hypergraph motifs). Black labels indicate genes and chromosomes (bold). Red labels correspond to transcription factors shared between the majority of genes within the transcription cluster. For three-way contacts (green motifs), we highlight the transcription clusters' biological analog (blue-shaded box), showing how fragments of chromatin fold and congregate at a common transcription cluster (grey sphere). Each node (black dot) of the hyperedge and its denoted chromosome and gene in the hypergraph motif corresponds to a single chromatin fragment, colored according to chromosome, in the biological analog. Thus, a three-way hyperedge is depicted by three chromatin fragments in close spatial proximity. Multi-way contacts used for adult and neonatal fibroblasts include all experiments (V1-V4). Examples were selected from the subset of multi-way contacts summarized in the "Clusters with Common TFs'' column of Table 1.
Fig. 8
Fig. 8. Classes of transcription clusters.
In a self-sustaining transcription cluster, a TF and the gene encoding that TF are both present. The inter- and intra-chromosomal examples in (a) and (b), respectively, illustrate this phenomenon where in a we see the TF of interest (orange triangle) circulating at the cluster, its binding motif present on the chromatin (orange portion), and its corresponding gene expressed (orange rectangle on Chromosome 6). The gray shapes represent additional TFs with binding motifs (gray portion of chromatin) at the cluster. Black rectangles on Chromosomes 3, 9, and 19 represent additional genes present in the cluster. c An analog-independent class of transcription clusters where we observe a TF (red square) bind at a transcription cluster (red cluster) and its corresponding gene expressed in a separate transcription cluster (grey cluster), yet not in the same cluster. d An analog-independent class of transcription clusters where we observe a TF (green circle) bind at a transcription cluster (green cluster) and its corresponding gene expressed but not within a transcription cluster. e Genome-wide cell type-specific self-sustaining transcription clusters extracted from multi-way contact data and decomposed into Hi-C contact matrices at 100 kb resolution. Contact frequencies are log-transformed for better visualization. Frequencies along the diagonal indicate interaction between two or more unique multi-way loci that fall within the same 100 kb bin. Axis labels are non-contiguous 100 kb bin coordinates in chromosomal order. Multi-way contacts that make up the self-sustaining transcription clusters are superimposed. Multi-way contacts with green-colored loci represent 'core' transcription clusters - transcription clusters containing a master regulator and its gene analog. An example read-level contact map for the inter-chromosomal FOXO3 self-sustaining transcription cluster is denoted by the orange highlighted box in the adult fibroblast contact matrix and a read-level contact map for the intra-chromosomal ZNF320 self-sustaining transcription cluster is denoted by the blue highlighted box. Values along the left axis of these read-level contact matrices are base-pair positions of the contacting loci in the genome.

References

    1. Lieberman-Aiden E, et al. Comprehensive mapping of long-range interactions reveals folding principles of the human genome. Science. 2009;326:289–293. doi: 10.1126/science.1181369. - DOI - PMC - PubMed
    1. Misteli T. The self-organizing genome: Principles of genome architecture and function. Cell. 2020;183:28–45. doi: 10.1016/j.cell.2020.09.014. - DOI - PMC - PubMed
    1. Chen H, et al. Functional organization of the human 4d nucleome. Proc. Natl Acad. Sci. 2015;112:8002–8007. doi: 10.1073/pnas.1505822112. - DOI - PMC - PubMed
    1. Ay F, et al. Identifying multi-locus chromatin contacts in human cells using tethered multiple 3c. BMC genomics. 2015;16:1–17. doi: 10.1186/s12864-015-1236-7. - DOI - PMC - PubMed
    1. Olivares-Chauvet P, et al. Capturing pairwise and multi-way chromosomal conformations using chromosomal walks. Nature. 2016;540:296–300. doi: 10.1038/nature20158. - DOI - PubMed

Publication types