. 2022 Sep 20;13(9):803.
doi: 10.1038/s41419-022-05239-0.

Hnrnpk maintains chondrocytes survival and function during growth plate development via regulating Hif1α-glycolysis axis

Affiliations

Hnrnpk maintains chondrocytes survival and function during growth plate development via regulating Hif1α-glycolysis axis

Yuyu Chen et al. Cell Death Dis. .

Abstract

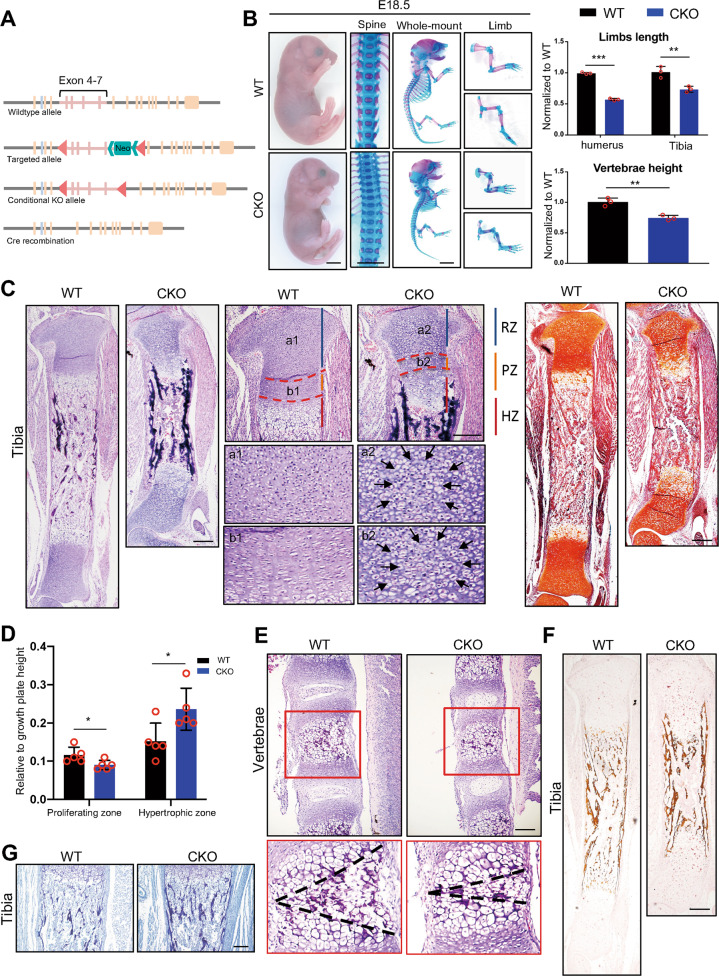
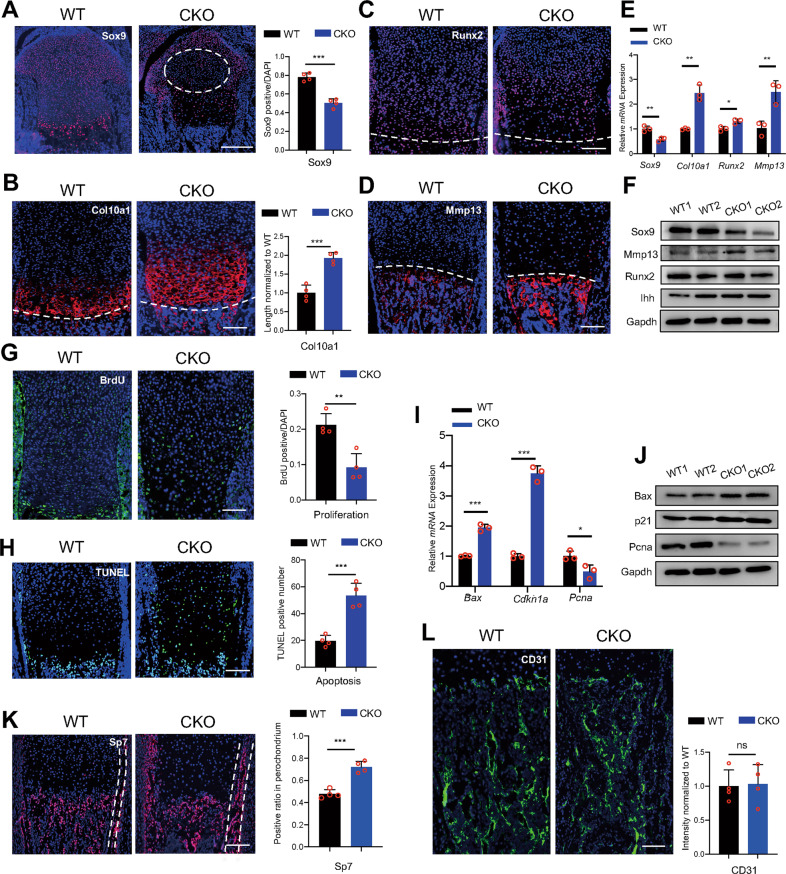
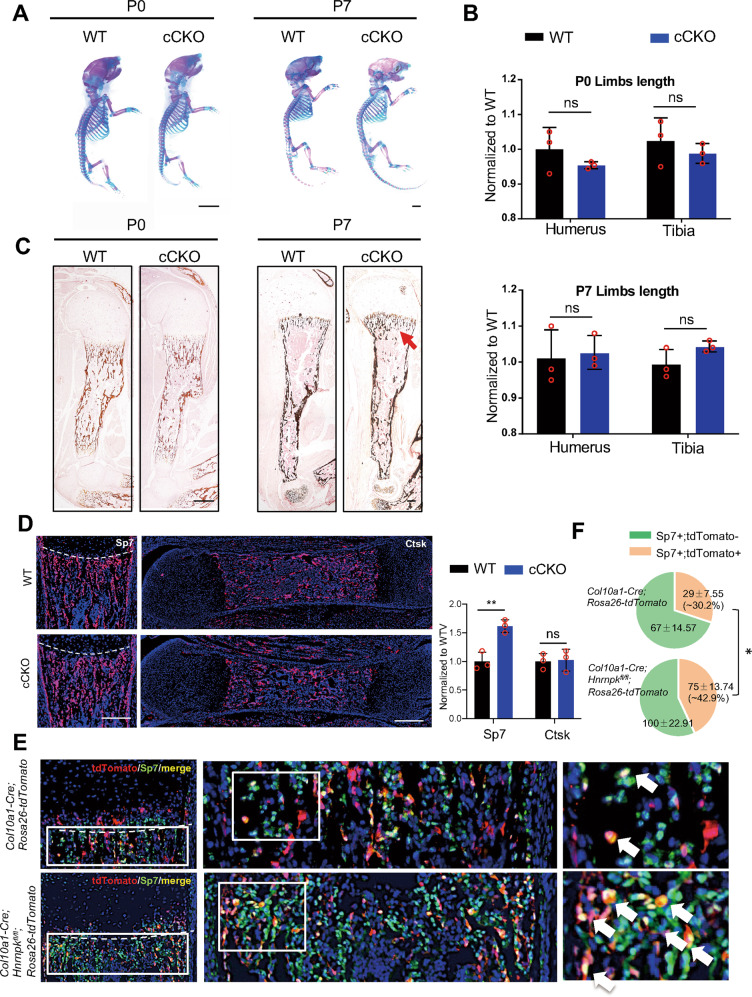
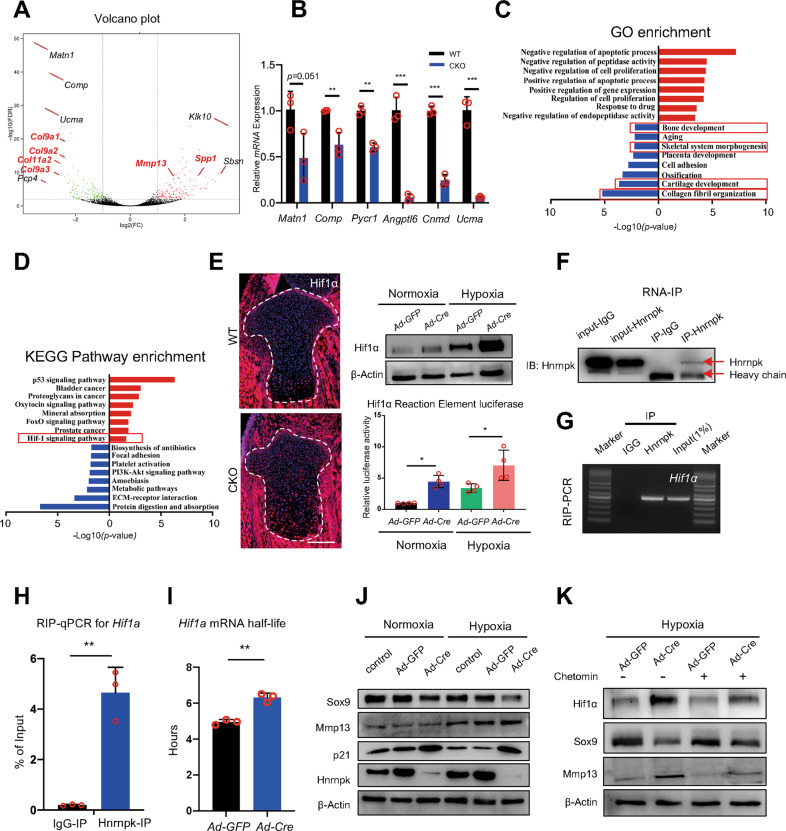
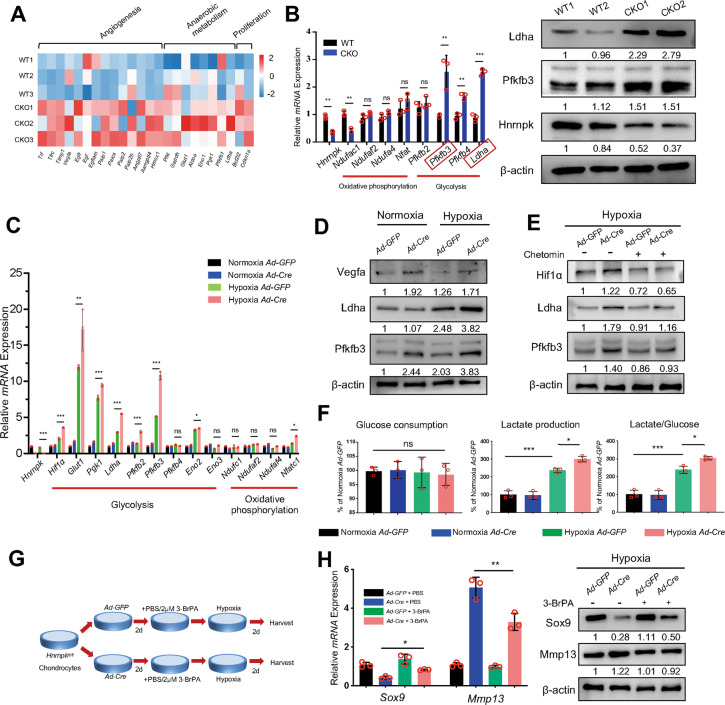
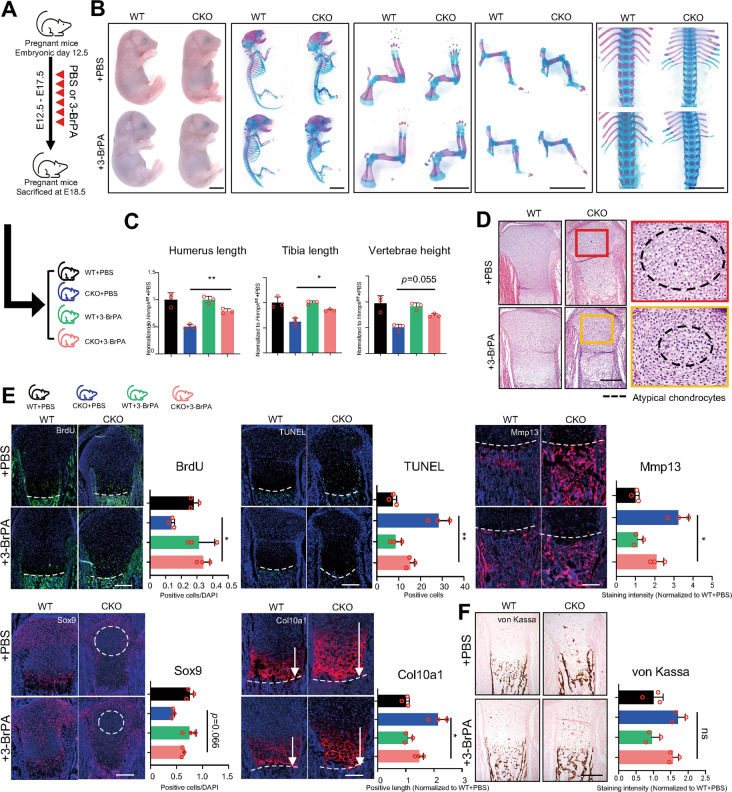
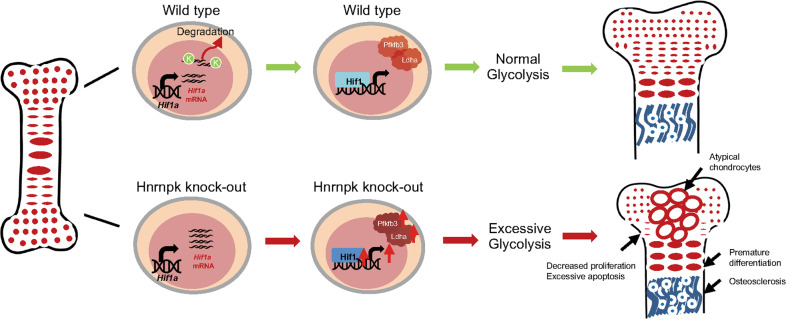
The harmonious functioning of growth plate chondrocytes is crucial for skeletogenesis. These cells rely on an appropriate intensity of glycolysis to maintain survival and function in an avascular environment, but the underlying mechanism is poorly understood. Here we show that Hnrnpk orchestrates growth plate development by maintaining the appropriate intensity of glycolysis in chondrocytes. Ablating Hnrnpk causes the occurrence of dwarfism, exhibiting damaged survival and premature differentiation of growth plate chondrocytes. Furthermore, Hnrnpk deficiency results in enhanced transdifferentiation of hypertrophic chondrocytes and increased bone mass. In terms of mechanism, Hnrnpk binds to Hif1a mRNA and promotes its degradation. Deleting Hnrnpk upregulates the expression of Hif1α, leading to the increased expression of downstream glycolytic enzymes and then exorbitant glycolysis. Our study establishes an essential role of Hnrnpk in orchestrating the survival and differentiation of chondrocytes, regulating the Hif1α-glycolysis axis through a post-transcriptional mechanism during growth plate development.


Conflict of interest statement

The authors declare no competing interests.

Figures

Fig. 1
Fig. 1. Ablation of Hnrnpk results in the occurrence of dwarfism and abnormal growth plate development.
A Schematic diagram of the strategy constructing HnrnpkloxP mice. B General inspection and skeletal preparation of E18.5 WT and CKO embryos (left panel) and quantified comparison of limbs length and vertebrae height between E18.5 WT and CKO embryos (right panel). n = 3 biological replicates. Scale bar: 1 mm. C H&E staining (left panel) and Safranine O staining (right panel) of tibia of E18.5 WT and CKO embryos. Black arrows: atypical chondrocytes in resting and proliferating zones. Scale bar: 100 μm. D Quantification of the height of proliferating zone and hypertrophic zones according to H&E staining of tibia of E18.5 WT and CKO embryos. n = 5 biological replicates. E H&E staining of lumbar vertebrae of E18.5 WT and CKO embryos. Red boxes: magnification of vertebral growth plate. Black dotted lines: range of ossification center. Scale bar: 100 μm. F, G von Kassa staining (F) and Toluidine blue staining (G) of tibia of E18.5 WT and CKO embryos. Scale bar: 100 μm. p-value was calculated by two-tailed unpaired Student’s t-test. Data were shown as mean ± SD. *p < 0.05; **p < 0.01; ***p < 0.001.
Fig. 2
Fig. 2. Loss of Hnrnpk results in damaged survival and premature differentiation of growth plate chondrocytes.
A Immunostaining of Sox9 of tibia of E18.5 WT and CKO embryos (left panel) and the quantification of Sox9 positive cells (right panel). Dotted circle: region contained atypical chondrocytes. n = 4 biological replicates. Scale bar: 100 μm. B Immunostaining of Col10a1 of tibia of E18.5 WT and CKO embryos (left panel) and measurement of Col10a1 positive range (right panel). Dotted lines: boundary between hypertrophic zone and POC. n = 4 biological replicates. Scale bar: 100 μm. C, D Immunostaining of Runx2 (C) and Mmp13 (D) of tibia of E18.5 WT and CKO embryos. Dotted lines: boundary between hypertrophic zone and POC. Scale bar: 100 μm. E mRNA expression level of Sox9, Col10a1, Mmp13, and Runx2 of E18.5 WT and CKO growth plate cartilage. n = 3 biological replicates. F Protein level of Sox9, Mmp13, Runx2, and Ihh of E18.5 WT and CKO growth plate cartilage. G, H BrdU assay (G) and TUNEL assay (H) of tibia of E18.5 WT and CKO embryos (left panel) and the quantification of BrdU and TUNEL positive cells (right panel). n = 4 biological replicates. Scale bar: 100 μm. I mRNA expression level of Bax, Cdkn1a, and Pcna of E18.5 WT and CKO growth plate cartilage. n = 3 biological replicates. J Protein level of Bax, p21, and Pcna of E18.5 WT and CKO growth plate cartilage. K, L Immunostaining of Sp7 (K) and CD31 (L) in POC of tibia from E18.5 WT and CKO embryos (left panel) and the quantification of Sp7 and CD31 staining (right panel). Dotted lines: perichondrium. n = 4 biological replicates. Scale bar: 100 μm. p-value was calculated by two-tailed unpaired Student’s t-test. Data were shown as mean ± SD. *p < 0.05; **p < 0.01; ***p < 0.001; ns: not significant.
Fig. 3
Fig. 3. Ablating Hnrnpk in hypertrophic chondrocytes results in enhanced transdifferentiation potential.
A Skeletal preparation of P0 (left panel) and P7 (right panel) WT and cCKO mice. Scale bar: 1 mm. B Quantification of limb length of P0 (top) and P7 (bottom) WT and cCKO mice. n = 3 biological replicates. C von Kassa staining of humerus of P0 and P7 WT and cCKO mice. Red arrow: excessive mineral bone in cCKO mice. Scale bar: 100 μm. D Immunostaining of Sp7 (left panel) and Cathepsin K (Ctsk) (right panel) of femur of P0 WT and cCKO mice (left panel) and the quantification of Sp7 and Ctsk positive cells (right panel). Dotted lines: boundary between hypertrophic zone and POC. n = 3 biological replicates. Scale bar: 100 μm. E Immunostaining of Sp7 of P0 Col10a1-Cre;Rosa26-tdTomato and Col10a1-Cre;Hnrnpkfl/fl;Rosa26-tdTomato. White boxes: magnification of metaphysis. White arrow: tdTomato and Sp7 double-positive cells. Scale bar: 100 μm. F Total quantity and ratio of single positive cells and double-positive cells in (E) of P0 WT and cCKO mice. Statistical analysis was exerted upon a ratio of double-positive cells between WT and cCKO mice. n = 3 biological replicates. p-value was calculated by two-tailed unpaired Student’s t-test. Data were shown as mean ± SD. *p < 0.05; **p < 0.01; ns: not significant.
Fig. 4
Fig. 4. Elevated activity of Hif-1 signaling pathway in CKO growth plate chondrocytes.
A Volcano plot of RNA-seq. B mRNA expression level of significantly downregulated genes (Matn1, Comp, Pycr1, Angptl6, Cnmd, and Ucma) in E18.5 CKO growth plate cartilage compared to WT. n = 3 biological replicates. C, D GO enrichment analysis (C) and KEGG pathway enrichment analysis (D) of up- and down-regulated genes (Log2FC > 1 or < -1, p-value < 0.05) according to RNA-seq results. Red boxes: items we focus on. E The expression of Hif1α of tibia of E18.5 WT and CKO embryos (left panel), and protein level of Hif1α (right panel, top) and the luciferase activity (right panel, bottom) of Hnrnpkfl/fl chondrocytes infected with Ad-GFP or Ad-Cre under normoxic or hypoxic conditions. n = 4 biological replicates. Scale bar: 100 μm. F Hnrnpk protein level of supernatant immunoprecipitated with antibodies of Hnrnpk or IgG. G, H RIP-PCR (G) and RIP-qPCR (H) were used to determine the level of binding between Hnrnpk and Hif1a mRNA. IgG IP was used as a specificity control. n = 3 biological replicates. I Half-life of Hif1a mRNA of Hnrnpkfl/fl chondrocytes infected with Ad-GFP or Ad-Cre. n = 3 biological replicates. J Protein level of Sox9, Mmp13, p21, and Hnrnpk of Hnrnpkfl/fl chondrocytes infected with Ad-GFP or Ad-Cre under normoxic or hypoxic conditions. K Protein level of Hif1α, Sox9, and Mmp13 in Hnrnpkfl/fl chondrocytes treated with DMSO or Chetomin after being infected with Ad-GFP or Ad-Cre under hypoxic condition. p-value was calculated by one-way ANOVA followed by Tukey’s multiple comparisons tests (E) or two-tailed unpaired Student’s t-test (B, H, I). Data were shown as mean ± SD. *p < 0.05; **p < 0.01; ***p < 0.001.
Fig. 5
Fig. 5. Elevated activity of Hif-1 signaling pathway in Hnrnpk null chondrocytes increases glycolytic intensity.
A mRNA fold changes of target genes of Hif-1 signaling pathway of E18.5 CKO growth plate cartilage compared to WT according to RNA-seq results. B mRNA expression level of key enzymes of oxidative phosphorylation and glycolysis of E18.5 WT and CKO growth plate cartilage (left panel). Protein level of Pfkfb3 and Ldha of E18.5 WT and CKO growth plate cartilage (right panel). Red boxes: most active glycolytic enzymes in chondrocytes. n = 3 biological replicates. Densitometry results were expressed as fold change in protein levels compared with WT1 after normalized to β-actin. C mRNA expression level of key enzymes of oxidative phosphorylation and glycolysis of Hnrnpkfl/fl chondrocytes infected with Ad-GFP or Ad-Cre under normoxic or hypoxic conditions. Statistical analysis was exerted between Hypoxia Ad-GFP and Hypoxia Ad-Cre. n = 3 biological replicates. D Protein level of Vegfa, Ldha, and Pfkfb3 of Hnrnpkfl/fl chondrocytes infected with Ad-GFP or Ad-Cre under normoxic or hypoxic conditions. Densitometry results were expressed as fold change in protein levels compared with chondrocytes infected with Ad-GFP under normoxic condition after normalized to β-actin. E Protein level of Hif1α, Ldha, and Pfkfb3 of Hnrnpkfl/fl chondrocytes treated with DMSO or Chetomin after being infected with Ad-GFP or Ad-Cre under hypoxic condition. Densitometry results were expressed as fold change in protein levels compared with chondrocytes infected with Ad-GFP under hypoxic condition after normalized to β-actin. F Glucose consumption, lactate production, and ratio of lactate/glucose of Hnrnpkfl/fl chondrocytes infected with Ad-GFP or Ad-Cre under normoxia or hypoxic conditions. n = 3 biological replicates. G Diagram indicated the strategy of treating Hnrnpkfl/fl chondrocytes with PBS or 3-BrPA after being infected with Ad-GFP or Ad-Cre under hypoxic condition. H mRNA expression level and protein level of Sox9 and Mmp13 in Hnrnpkfl/fl chondrocytes treated with PBS or 3-BrPA after being infected with Ad-GFP or Ad-Cre under hypoxic condition. n = 3 biological replicates. Densitometry results were expressed as fold change in protein levels compared with chondrocytes infected with Ad-GFP under hypoxic condition after normalized to β-actin. p-value was calculated by one-way ANOVA followed by Tukey’s multiple comparisons tests (C, F, H) or two-tailed unpaired Student’s t-test (B). Data were shown as mean ± SD. *p < 0.05; **p < 0.01; ***p < 0.001; ns: not significant.
Fig. 6
Fig. 6. Suppressing glycolytic intensity partially rescues dwarfism phenotype in CKO embryos in vivo.
A Diagram of strategy about intraperitoneal injection of PBS or 3-BrPA and corresponding possible offspring. B General inspection and skeletal preparation of E18.5 embryos delivered from pregnant mice injected with PBS or 3-BrPA. Scale bar: 1 mm. C Quantification of humerus length (left panel), tibia length (middle panel), and vertebrae height (right panel) according to skeletal preparation of E18.5 embryos delivered from pregnant mice injected with PBS or 3-BrPA. Statistical analysis was exerted between CKO + PBS and CKO + 3-BrPA groups. n = 3 biological replicates. D H&E staining of tibia of E18.5 embryos delivered from pregnant mice injected with PBS or 3-BrPA. Boxes: magnification of resting zone in growth plate. Dotted circles: the area where atypical chondrocytes exist. Scale bar: 100 μm. E Immunostaining of BrdU assay, TUNEL assay, Sox9, Col10a1, and Mmp13 of tibia of E18.5 embryos delivered from pregnant mice injected with PBS or 3-BrPA and corresponding quantitative analysis. Statistical analysis was exerted upon CKO + PBS and CKO + 3-BrPA groups. Dotted lines: boundary between hypertrophic zone and POC. Dotted circles: the area where atypical chondrocytes exist. White arrows: positive range of Col10a1. n = 3 biological replicates. Scale bar: 100 μm. F von Kassa staining of tibia of E18.5 embryos delivered from pregnant mice injected with PBS or 3-BrPA and quantitative analysis. n = 3 biological replicates. Scale bar: 100 μm. p-value was calculated by one-way ANOVA followed by Tukey’s multiple comparisons tests. Data were shown as mean ± SD. *p < 0.05; **p < 0.01; ***p < 0.001; ns: not significant.
Fig. 7
Fig. 7. Diagram of Hnrnpk orchestrating growth plate development.
During growth plate development, Hnrnpk bound to the Hif1a mRNA and mediated its degradation. Ablating Hnrnpk in chondrocytes resulted in the increased expression of Hif1α and then the increased expression of downstream target genes including Ldha and Pfkfb3. The elevated level of glycolytic enzymes led to excessive glycolysis and finally abnormal growth plate development.

References

    1. Akiyama H, Chaboissier MC, Martin JF, Schedl A, de Crombrugghe B. The transcription factor Sox9 has essential roles in successive steps of the chondrocyte differentiation pathway and is required for expression of Sox5 and Sox6. Genes Dev. 2002;16:2813–28. doi: 10.1101/gad.1017802. - DOI - PMC - PubMed
    1. Cooper KL, Oh S, Sung Y, Dasari RR, Kirschner MW, Tabin CJ. Multiple phases of chondrocyte enlargement underlie differences in skeletal proportions. Nature. 2013;495:375–8. doi: 10.1038/nature11940. - DOI - PMC - PubMed
    1. Ornitz DM, Marie PJ. FGF signaling pathways in endochondral and intramembranous bone development and human genetic disease. Genes Dev. 2002;16:1446–65. doi: 10.1101/gad.990702. - DOI - PubMed
    1. Kozhemyakina E, Lassar AB, Zelzer E. A pathway to bone: signaling molecules and transcription factors involved in chondrocyte development and maturation. Development. 2015;142:817–31. doi: 10.1242/dev.105536. - DOI - PMC - PubMed
    1. Tsang KY, Tsang SW, Chan D, Cheah KS. The chondrocytic journey in endochondral bone growth and skeletal dysplasia. Birth Defects Res C Embryo Today. 2014;102:52–73. doi: 10.1002/bdrc.21060. - DOI - PubMed

Publication types

MeSH terms