. 2022 Sep 20;13(1):5495.
doi: 10.1038/s41467-022-33246-4.

Systematic profiling of conditional degron tag technologies for target validation studies

Affiliations

Systematic profiling of conditional degron tag technologies for target validation studies

Daniel P Bondeson et al. Nat Commun. .

Abstract

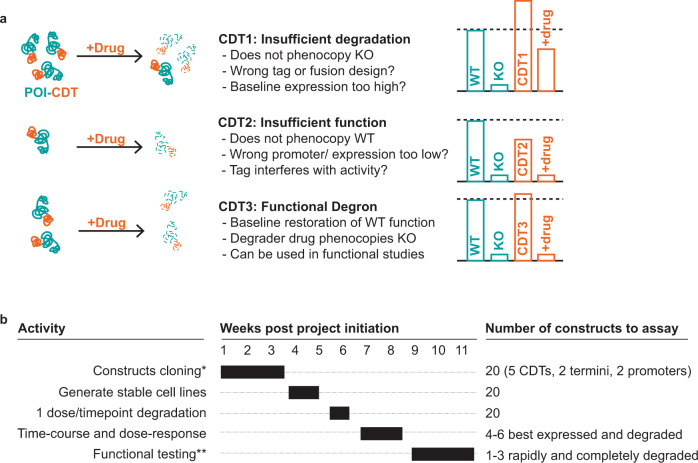
Conditional degron tags (CDTs) are a powerful tool for target validation that combines the kinetics and reversible action of pharmacological agents with the generalizability of genetic manipulation. However, successful design of a CDT fusion protein often requires a prolonged, ad hoc cycle of construct design, failure, and re-design. To address this limitation, we report here a system to rapidly compare the activity of five unique CDTs: AID/AID2, IKZF3d, dTAG, HaloTag, and SMASh. We demonstrate the utility of this system against 16 unique protein targets. We find that expression and degradation are highly dependent on the specific CDT, the construct design, and the target. None of the CDTs leads to efficient expression and/or degradation across all targets; however, our systematic approach enables the identification of at least one optimal CDT fusion for each target. To enable the adoption of CDT strategies more broadly, we have made these reagents, and a detailed protocol, available as a community resource.


Conflict of interest statement

F.V. receives research funding from Novo Ventures. T.R.G. has an equity interest in or receives consulting income from Sherlock Biosciences and Anji Pharmaceuticals and receives research funding from Calico Life Sciences, Bayer HealthCare, and Novo Holdings. A.I. receives cash compensation for consulting with Ridgeline Discovery. W.R.S. is a Board or SAB member and holds equity in Ideaya Biosciences, Civetta Therapeutics, Red Ridge Bio, and 2Seventy Bio and has consulted for Array, Astex, Epidarex Capital, Ipsen, PearlRiver Therapeutics, Merck Pharmaceuticals, Sanofi, Servier, and Syndax Pharmaceuticals and receives research funding from Pfizer Pharmaceuticals, Merck Pharmaceuticals, Ideaya Biosciences, Calico, Boehringer-Ingelheim, Bristol Myers Squibb, and Ridgeline Discovery. W.R.S. is a co-patent holder on EGFR mutation diagnostic patents. The remaining authors declare no competing interests.

Figures

Fig. 1
Fig. 1. A vector panel to systematically evaluate conditional degron tag (CDT) fusion protein expression, degradation, and function.
a Summary table of the five CDTs evaluated in this work. Each CDT, except for small-molecule-assisted shut-off (SMASh), functions through reprogramming an E3 ubiquitin ligase with a small molecule to recognize the degron fusion protein. SMASh fusion proteins self-cleave a degron tag; the addition of the small molecule blocks this self-cleavage. *The SMASh tag itself is 34 kDa, but after self-cleavage, the stably-expressed (V5) tag is only 7 kDa. b Plasmid design for systematically evaluating CDT fusions to a protein of interest (POI). We employed a P2A cleavage site to separate an antibiotic-resistance gene (PuroR) and the fusion protein. A V5 epitope tag enables detection and quantitation of the fusion protein by western blot. A rigid linker (EAAK3, Link) was also incorporated between the degron tag and the cloning site in all constructs except AID and SMASh, where the CDT is separated from the POI by the V5 tag. These expression cassettes were cloned into a lentiviral vector for stable integration into the genome. c Validation of the CDT panel using NanoLuciferase. NanoLuciferase fused to the indicated CDT was expressed using the PGK or SFFV plasmids. Here, expression levels are reported as the anti-V5 IB band intensity normalized to the anti-Vinculin band intensity and then scaled to the total expression of all ten CDTs evaluated to highlight the relative expression differences between the different CDTs. Degradation is reported as the percent reduction in the anti-V5 IB band intensity after drug treatment. See Supplementary Fig. 2a for the full IB for both PGK and SFFV constructs.
Fig. 2
Fig. 2. Comparison of degradation efficiency for five CDTs across 16 unique proteins of interest.
a Expression and degradation across CDT fusions to 16 unique proteins of interest (POI). The indicated POI-CDT fusions were expressed in HEK-293T cells treated with DMSO or the respective degrader drug and analyzed by immunoblot (IB, see Supplementary Figs. 2–6). The size of each dot corresponds to the baseline expression level of that fusion protein: the anti-V5 IB band intensity normalized to the anti-Vinculin band intensity and then scaled to the total expression of all 10 CDTs evaluated for a given target to highlight the relative expression differences between the different CDTs. The color of each point indicates the maximal degradation observed (Dmax) for that protein after degrader drug treatment. Note that missing data points indicate that the fusion protein was not evaluated and that some of the SMASh-tag constructs were efficiently degraded at later timepoints, as shown in Supplementary Figs. 9, 10. b Comparison of AID and AID2 systems for nine POI. The indicated AID fusions were expressed in HEK-293T cells co-expressing Tir1 (either wildtype for AID and or F74G for AID2). Cells were treated with drug (Indole-3-acetic acid for AID or 5-phenyl-indole-3-acetic acid for AID2), and protein levels were analyzed by immunoblot (see Supplementary Fig. 8). Protein expression is normalized as in a. c The Dmax observed for each fusion protein categorized by degron technology and fusion terminus. The box and whisker plot indicates the median, the first and third quartiles, and 1.5x the interquartile range. N = 16 targets analyzed for each construct except dTAG-N, where N = 15. d POI-CDT fusions that were degraded by >95%. NLU. NanoLuc, RLU. RFluc, PRM. PRMT5, WSB. WSB2, MCL. MCL1, SHO. SHOC2, MAT. MAT2A, VPS. VPS4A, PRK. PRKRA, ST1. STAG1, ST2. STAG2, DNM DNMT3A, XPR. XPR1, KID. KIDINS220, FLT. FLT3-ITD.
Fig. 3
Fig. 3. The kinetics of degradation and fusion protein recovery are highly heterogeneous across different technologies.
a Color legend for the genetic targets profiled in this figure. See Supplementary Fig. 9a for more details on the exact constructs profiled in Fig. 3. b Kinetics of degradation after treatment with degrader drugs. After the indicated times, RFluc protein levels were measured via in-cell luciferase signal, while all other protein levels were measured via ICW. Relative protein levels are presented as a fraction of the untreated sample. Errors bars represent the mean and standard error of N = 2 separate wells, representative of N = 2 independent experiments. c Kinetics of recovery after degrader drug washout. After drug treatment (all constructs except SMASh, 24 h; SMASh, 5 days), cells were washed and incubated in a cell culture medium without the drug for the indicated times. RFluc protein levels were measured via in-cell luciferase signal, and error bars represent the standard error of the mean. NanoLuc and PRMT5-CDT protein levels were measured by IB, and data represent the V5 signal normalized to the Vinculin loading control. Errors bars represent the mean of N = 2 technical replicates, representative of N = 2 independent experiments.
Fig. 4
Fig. 4. Validation of functional activity for XPR1- and MCL1-CDT fusion proteins.
a Comparison of expression levels for XPR1 degron fusion proteins in various cell lines. Expression was determined by quantifying the western blot V5 band intensity and normalizing it to a Vinculin loading control. b Phosphate efflux activity of XPR1 degron fusion proteins. 293T cells endogenously express XPR1, which was inactivated using CRISPR/Cas9 (XPR1-KO) followed by re-expression of wild-type XPR1 (WT), a hypomorphic allele (L218S), or the indicated SFFV-driven degron fusion proteins. Three days after the addition of degrader drug (1 μM Pomalidomide, 1 μM dTAGV−1, or 1 μM HaloPROTAC3), phosphate efflux was measured by “loading cells” for 45 min with 32PO43−, washing away any extracellular 32P, and then incubating the cells for 60 min and measuring the percentage of 32P in the conditioned medium compared to cellular lysates. The bar height represents the mean of technical triplicates (shown as points), and the results are representative of two independent experiments. c MCL1-CDT fusions are expressed and degraded in A375 cells. Cells expressing the indicated MCL1-CDT proteins were treated with 1 μM Asunaprevir or 1 μM dTAGV−1 prior to evaluating protein levels by western blot. d Evaluation of MCL1 degron fusions to protect cells from Navitoclax-induced cell death. Endogenous MCL1 was inactivated in A375 cells expressing the MCL1-CDT fusions shown in c and then pretreated with the indicated degrader drugs for 5 days (Asunaprevir) or 1 day (dTAGV−1). At “time 0”, the cells were treated with 625 nM Navitoclax and cell growth was evaluated with live-cell imaging, and confluency was evaluated through image analysis. Error bars represent the mean of N = 3 technical replicates and are representative of N = 2 independent experiments.
Fig. 5
Fig. 5. A systematic approach to developing CDT fusions for target validation studies.
a Schematic summary of functional consequences of different expression levels and degradation potencies. In this example, CDT1 is a degron fusion protein in which degradation is not sufficiently potent to phenocopy inactivation of the target gene; CDT2 is either hypomorphic or not expressed at high enough levels to functionally replace the endogenous gene; CDT3 is the ideal situation where the degron fusion protein phenocopies both the expression of the endogenous gene and inactivation of the gene upon degrader drug addition. b A proposed timeline for evaluating the expression, degradation, and function of CDT fusions. Although 20 constructs can all be tested in parallel using the vectors and protocols presented here, priority can be given to particular CDTs if required (see Discussion). In most cases, a degraded and functionally relevant CDT fusion protein can be developed within 11 weeks. *Construct cloning via Contract Research Organization; **Functional testing is highly target-dependent and 3 weeks is an estimation.

Comment in

References

    1. Meyers RM, et al. Computational correction of copy number effect improves specificity of CRISPR-Cas9 essentiality screens in cancer cells. Nat. Genet. 2017;49:1779–1784. doi: 10.1038/ng.3984. - DOI - PMC - PubMed
    1. Dempster, J. M. et al. Extracting biological insights from the project Achilles genome-scale CRISPR screens in cancer cell lines. Preprint at bioRxiv10.1101/720243 (2019).
    1. Kaelin WG., Jr Common pitfalls in preclinical cancer target validation. Nat. Rev. Cancer. 2017;17:425–440. doi: 10.1038/nrc.2017.32. - DOI - PubMed
    1. Arrowsmith CH, et al. The promise and peril of chemical probes. Nat. Chem. Biol. 2015;11:536–541. doi: 10.1038/nchembio.1867. - DOI - PMC - PubMed
    1. Tsherniak A, et al. Defining a cancer dependency map. Cell. 2017;170:564–576.e16. doi: 10.1016/j.cell.2017.06.010. - DOI - PMC - PubMed

Publication types