. 2022 Sep 20;13(1):5511.
doi: 10.1038/s41467-022-33052-y.

Single cell atlas identifies lipid-processing and immunomodulatory endothelial cells in healthy and malignant breast

Affiliations

Single cell atlas identifies lipid-processing and immunomodulatory endothelial cells in healthy and malignant breast

Vincent Geldhof et al. Nat Commun. .

Abstract

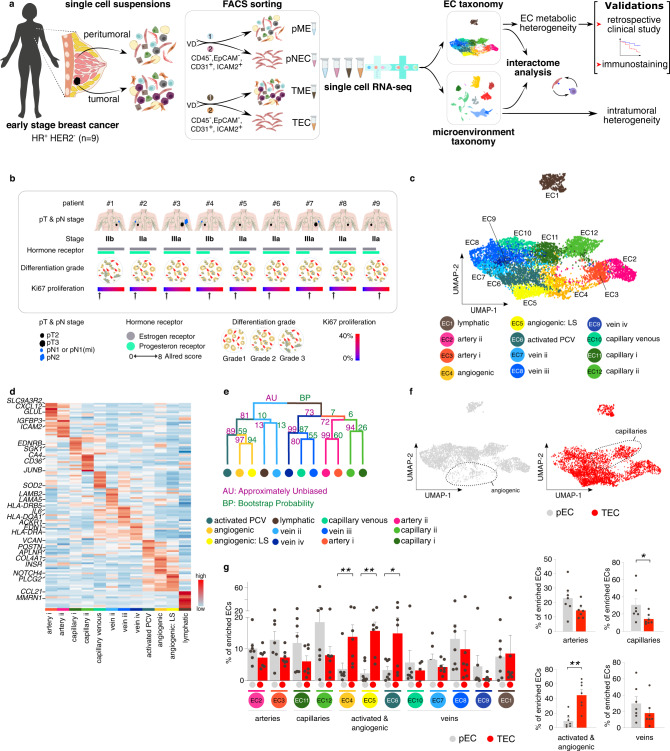
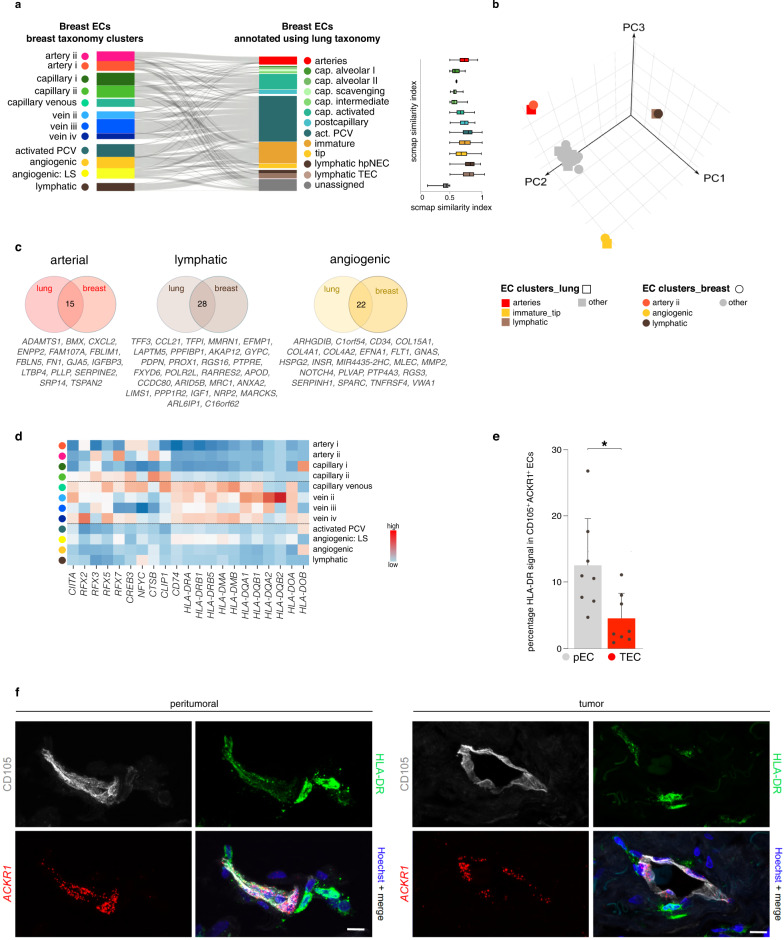
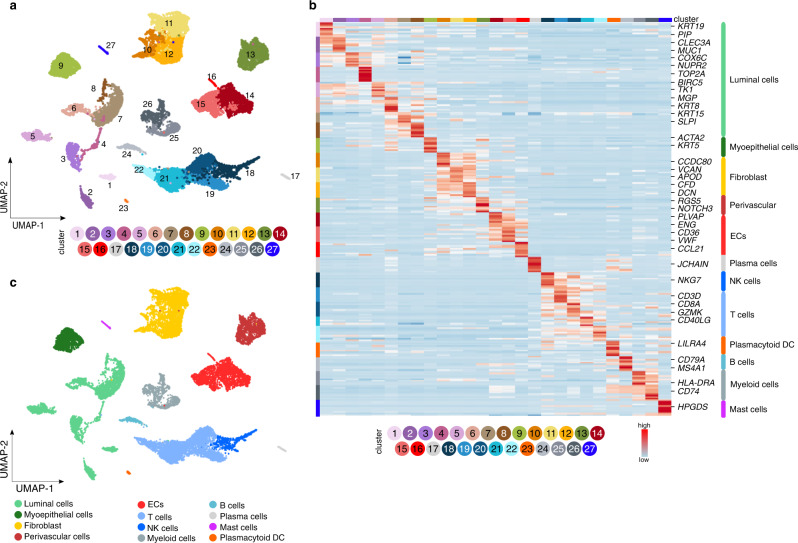
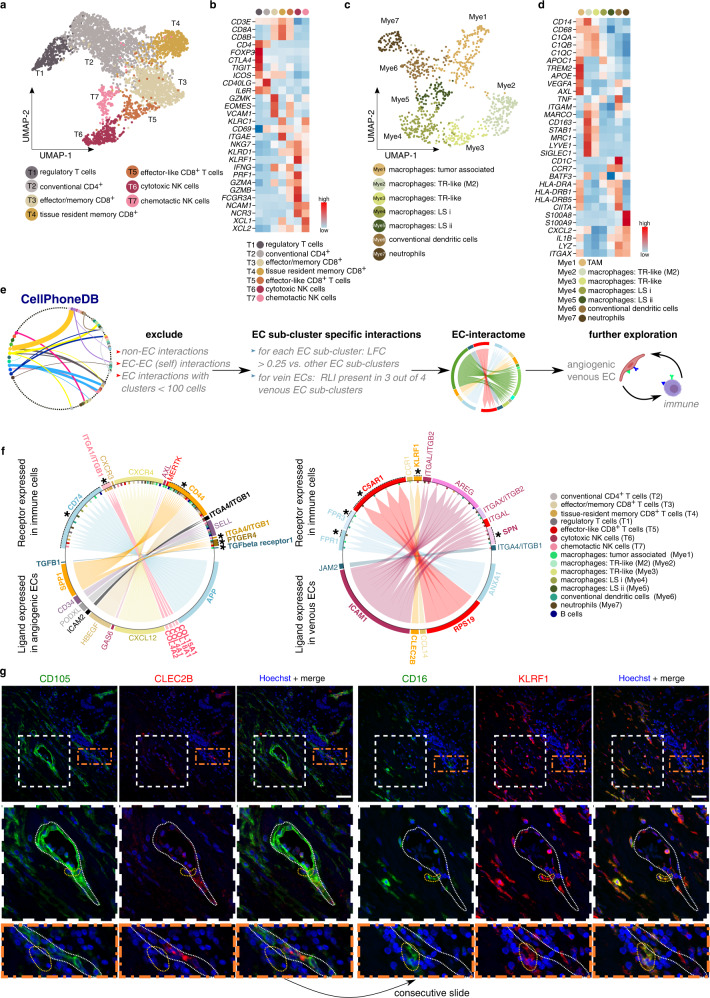
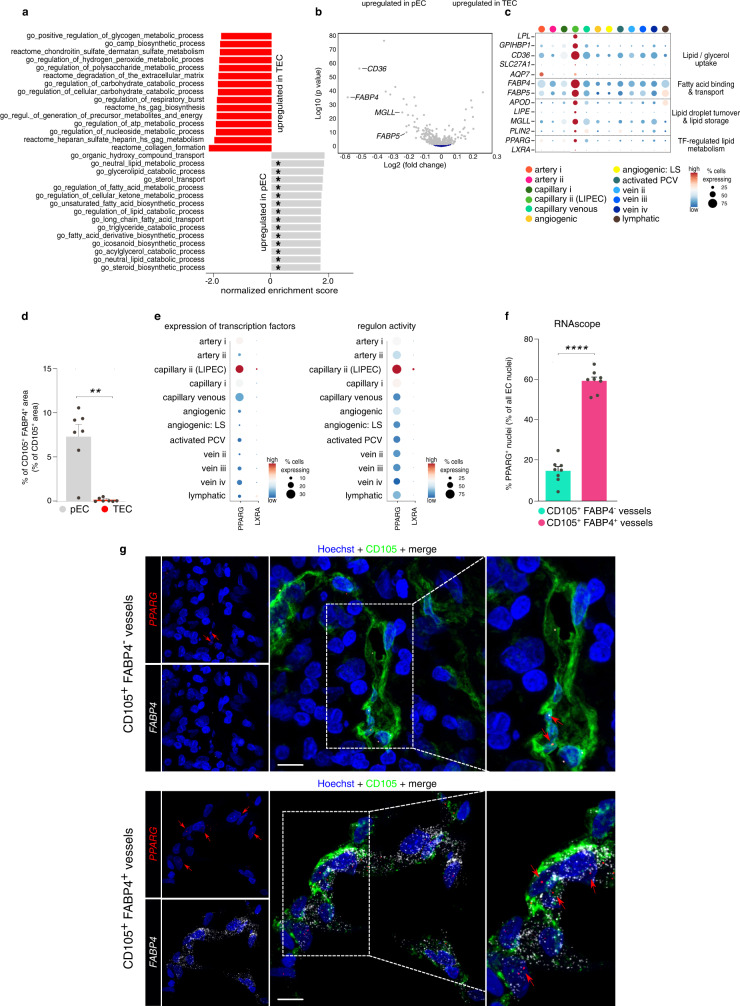
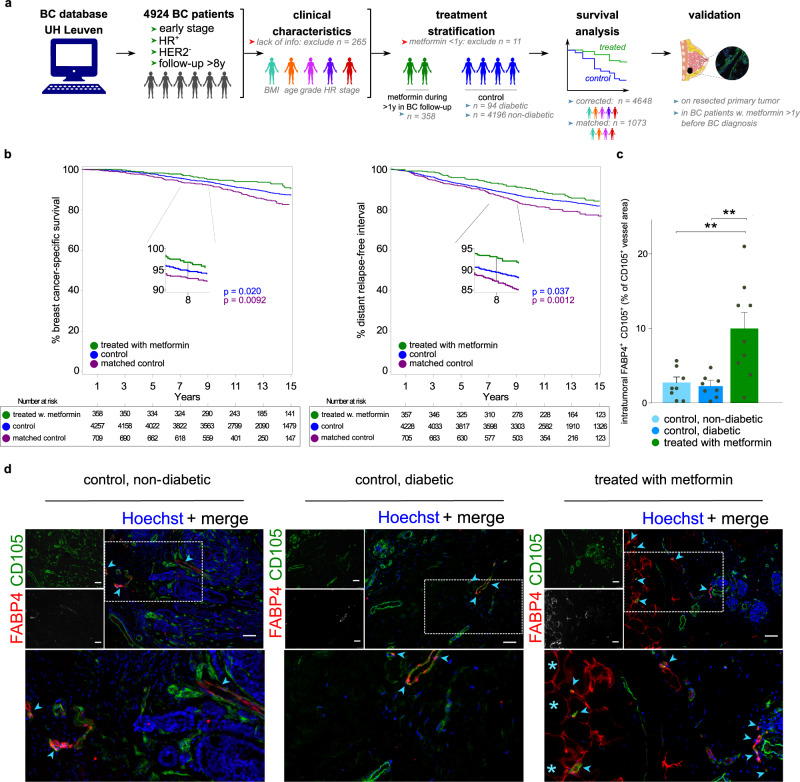
Since a detailed inventory of endothelial cell (EC) heterogeneity in breast cancer (BC) is lacking, here we perform single cell RNA-sequencing of 26,515 cells (including 8433 ECs) from 9 BC patients and compare them to published EC taxonomies from lung tumors. Angiogenic ECs are phenotypically similar, while other EC subtypes are different. Predictive interactome analysis reveals known but also previously unreported receptor-ligand interactions between ECs and immune cells, suggesting an involvement of breast EC subtypes in immune responses. We also identify a capillary EC subtype (LIPEC (Lipid Processing EC)), which expresses genes involved in lipid processing that are regulated by PPAR-γ and is more abundant in peri-tumoral breast tissue. Retrospective analysis of 4648 BC patients reveals that treatment with metformin (an indirect PPAR-γ signaling activator) provides long-lasting clinical benefit and is positively associated with LIPEC abundance. Our findings warrant further exploration of this LIPEC/PPAR-γ link for BC treatment.


Conflict of interest statement

K.P. is a speaker and/or consultant for Astra Zeneca, Eli Lilly, Exact Sciences, Focus Patient, Gilead Sciences, Medscape/Genomic Health, MSD, Novartis, Pfizer, Roche, Seagen (outside the submitted work), and has received research/travel support from Sanofi, MSD, Astra Zeneca, Novartis, Pfizer, PharmaMar, Roche (outside the submitted work). The other authors declare no competing interests.

Figures

Fig. 1
Fig. 1. Single cell taxonomy of endothelial cells in the breast.
a Study design. EC endothelial cell, HR hormone receptor, HER2 human epidermal growth factor receptor 2, VD Viability Dye, pME peri-tumoral microenvironment, pEC peri-tumoral endothelial cells, TME tumor microenvironment, TEC tumor endothelial cells. The numbers related to FACS-sorting indicate sequence of sorting, color coded to indicate that each patient yields 4 samples (pME, pEC, TME, and TEC). b Patient characteristics. First line, patient identifier; second line, pathological tumor (pT) and nodal (pN) stage; third line, IUCC (International Union for Cancer Control) cancer stage according to the 8th edition; fourth line, hormone receptor status, coded by color for receptor type (gray, estrogen receptor; green, progesterone receptor) and bar length for Allred score (routinely used immunohistochemistry score based on the percentage of positive cells and the intensity of that staining); fifth line, differentiation grades; grade 1, well differentiated; grade 2, moderately differentiated (patient: #2–8); grade 3, poorly differentiated (patient: #1); sixth line, Ki67 proliferation index based on the clinically performed immunohistochemistry stainings. c UMAP-plot, showing the subclustering of 8433 endothelial cells (ECs) from tumoral (n = 8) and matched peri-tumoral (n = 7) breast cancer (BC) patients. LS lower sequencing depth, PCV post-capillary venules. d Heatmap of the expression levels of the top-10 marker genes in all EC subclusters. Color scale: red – high expression, blue – low expression. e Hierarchical clustering analysis of EC subclusters. Color differences in the dendrogram indicate clusters that were resolved by multiscale bootstrapping, p-value cutoff 0.4. Approximately unbiased (AU) p-values, and bootstrap probability (BP) values are indicated for each dendrogram branch in purple and green, respectively. f UMAP-plots of all 8433 ECs color-coded by condition. Dotted lines surround angiogenic (left) and capillary (right) EC subclusters. g Abundances of EC subclusters across conditions (pEC (gray), TEC (red)). Left panel: y-axis depicts % of total enriched ECs, x-axis depicts EC subtypes color coded as in panel (c). Right panels: similar representation of the data as in left panel, but EC subtypes were pooled as indicated. Data are mean ± SEM, n = 7 for pEC, n = 8 for TEC, *p < 0.05, **p < 0.01 (exact p-values = 0.008, 0.0063, 0.0498, respectively (left panel), and 0.0151, 0.0021, respectively (right panel)), paired t-test (two-tailed) per subcluster (taking only into account the 7 complete pairs).
Fig. 2
Fig. 2. Transcriptomic congruency of ECs in breast and lung.
a Sankey diagram (left panel), showing the scmap cluster projection of annotated (peri-) tumoral breast-derived ECs (left part; n = 8433 endothelial cells) to subclusters of the EC taxonomy in non-small cell lung carcinoma (right part) and box plots (right panel) depicting the scmap similarity index. PCV post-capillary venules, EC endothelial cell, LS lower sequencing depth. Boxes extend from the 25th to 75th percentiles, line in the middle of the box is plotted at the median. Whiskers = min and max. b Three-dimensional principal component (PC) analysis on the pairwise Jaccard similarity coefficients of marker genes between EC subtypes in lung and breast. Color coding according to EC subtypes (lung – squares; breast – circles). c Venn-diagrams of the top-50 marker genes in the indicated EC subtypes in lung and breast ECs. Numbers in the middle reflect genes congruently ranking in the top-50 in both tissues. d Heatmap of the expression levels of the indicated immunoregulatory genes in the different breast EC subtypes. Venous EC subtypes are indicated by dashed lines. Color scale: red – high expression, blue – low expression. e Quantification of HLA-DR signal in ACKR1+ CD105+ pNEC and TEC represented as a percentage of the CD105+ vessel area. Data are mean ± SEM, n = 7, *p < 0.05 (exact p-value = 0.0045), paired t-test (two-tailed). f Representative micrographs of human breast peri-tumoral (left) and tumoral (right) tissue sections, immunostained for CD105 and HLA-DR, stained for ACKR1 by RNAscope and counterstained with Hoechst (n = 7). Brightness was decreased linearly (gamma = 1) to improve visibility for ACKR1 and CD105. Scale bar: 10 µm.
Fig. 3
Fig. 3. Single cell taxonomy of the breast microenvironment.
a UMAP-plot of the subclustering of 18,082 cells from tumoral (n = 9) and matched peri-tumoral (n = 8) BC samples (TME and pTME respectively, composed of all cell types). b Heatmap of the expression levels of the top-10 marker genes in all 27 stromal subclusters derived from the non-EC enriched dataset (composed of all cell types). Color scale: red – high expression, blue – low expression. EC endothelial cell, DC dendritic cell, NK natural killer. c UMAP-plot of the same cells as in a, color-coded for the 12 major cell types.
Fig. 4
Fig. 4. Immune cell subclustering and EC-immune cell interactome predictions.
a UMAP-plot of T-/NK cells color coded by subcluster. NK natural killer. b Heatmap of the expression levels of canonical marker genes of T-/NK cell (sub-)types. Color scale: red – high expression, blue – low expression. c UMAP-plot of myeloid cells color coded by subcluster. TR tissue resident, LS lower sequencing depth. d Heatmap of the expression levels of canonical genes in myeloid cells. Color scale: red – high expression, blue – low expression. TAM tumor associated macrophages. e Schematic overview of the receptor ligand interaction analysis. Clusters containing <100 cells: mast cells, plasma cells and plasmacytoid dendritic cells. EC endothelial cell, LFC log fold change, RLI receptor ligand interaction. f Circos plots representing RLI analysis between angiogenic/venous ECs and immune cells. Receptor is expressed on immune cell subclusters, ligand is expressed on angiogenic ECs (left panel) or venous ECs (right panel). Plots are color coded for the receptor–ligand pairs (arrows, gene names) and immune cell subclusters expressing the receptor (bars perpendicular to inner circle). Previously unknown RLI pairs between ECs and specific immune cell subtypes are indicated in bold (genes) and with asterisks (subclusters). g Representative micrographs of human breast tumoral tissue sections, immunostained for CD105 and CLEC2B (left panels) or CD16 and KLRF1 (right panels) and counterstained with Hoechst (n = 8). Middle panels: magnifications of the white boxed areas in the upper panels. Bottom panels: magnifications of the orange boxed areas in the upper panels. Dotted white line indicates a CLEC2B+ blood vessel, dotted orange lines indicate KLRF1+ NK cells in the vicinity of the blood vessel. Scale bar: 50 µm.
Fig. 5
Fig. 5. Transcriptomic heterogeneity of breast EC metabolism.
a Waterfall plot of top-15 up- and downregulated metabolic pathways in metabolic gene set enrichment analysis in TECs compared to pECs (gray – up in pEC, red – up in TEC). Asterisks mark gene sets involved in lipid metabolism. b Volcano plot showing differential metabolic gene expression analysis of pECs versus TECs. Key pEC-enriched marker genes involved in lipid metabolism are indicated. Gray, significant (adjusted p-value (Benjamini–Hochberg) < 0.05); dark blue, not significant. Differential expression analysis was performed using limma, the magnitude of differential expression (log2 fold change) and false discovery rate adjusted p-values (Benjamini–Hochberg) are provided on the x- and y-axis, respectively. c Dot plot heatmap of the gene expression levels within the LIPEC signature in breast EC subclusters. The color intensity of each dot represents the average level of marker gene expression, while the dot size reflects the percentage of cells expressing the marker within the subcluster. Color scale: red – high expression, blue – low expression. LIPEC lipid processing EC, TF transcription factor, LS lower sequencing depth. d Quantification of the FABP4+ CD105+ vessel area in peri-tumoral and tumoral breast tissue. Data are mean ± SEM, n = 7, **p < 0.01 (exact p-value = 0.0014), two-tailed paired t-test. For a representative image of the stained peri-tumoral - tumor border, see Supplementary Fig. 9a. e Dot plot heatmap of the expression of PPARG and LXRA (left panel) and their respective regulons from SCENIC analysis (right panel). The color intensity of each dot represents the average level of gene (left) or regulon (right) expression, while the dot size reflects the percentage of cells expressing the gene/regulon within the cell subcluster. Color scale: red – high expression, blue – low expression. f Quantification of the % of EC nuclei with positive PPARG staining by RNAscope in CD105+ FABP4+ vessels vs. CD105+ FABP4 vessels in human breast tissue (tumor and peri-tumoral tissue pooled per patient). Data are mean ± SEM, n = 8, ****p < 0.0001 (exact p-value < 0.0001), two-tailed paired t-test. g Representative micrographs of human breast tumor tissue sections, immunostained for CD105 and stained for FABP4 and PPARG by RNAscope and counterstained with Hoechst (n = 8). Right panels: magnifications of the boxed areas in the middle panels. Red arrows point to PPARG transcripts stained by RNAscope. Scale bar: 10 µm.
Fig. 6
Fig. 6. Lipid processing endothelial cells—translational implications.
a Schematic overview of the survival analysis in the retrospective clinical cohort and immunostaining validation. UH university hospital, BC breast cancer, HER2 human epidermal growth factor receptor 2, BMI body mass index, HR hormone receptor status. Color coding in the clinical characteristics panel reflects differences in age, BMI, tumor stage & grade (Supplementary Data 6). Color coding underneath the treatment stratification panel indicates patients that did (green) or did not (blue) receive metformin treatment during follow up. b Cumulative incidence function estimate of BC-specific survival (left panel) and the distant relapse free interval (right panel) in BC patients stratified by intake of a metformin. Color coded by group: blue – control, green – patients treated with metformin, purple – control matched for age, BMI, tumor stage & grade and hormone receptor status. P-values were calculated by the Kaplan–Meier (log rank) test between metformin therapy and without metformin therapy groups (blue for unmatched control patients; purple for matched control patients). Numbers in the boxes underneath the curves depict the number of patients per group that are at risk for the event (mortality in left panel, mortality/development of metastasis in right panel) at the indicated time points. c Quantification of FABP4+ blood vessels (% area of total CD105+ blood vessels) in non-diabetic BC patients (n = 8) and in diabetic patients without (n = 8) or with (n = 9) metformin treatment. Data are mean ± SEM, **p < 0.01 (exact p-values = 0.0030 and 0.0023, respectively), one-way ANOVA followed by Dunnett’s multiple comparisons test. d Representative micrographs of human breast tumor tissue sections in control non-diabetic (left; n = 8) or diabetic (middle; n = 8) control BC patients and in (diabetic) BC patients treated with metformin (right; n = 9), immunostained for CD105, FABP4 and counterstained with Hoechst. Arrowheads denote CD105+FABP4+ vessels, asterisks denote (putative) adipocytes, which (besides LIPECs) are also positive for FABP4. Brightness was increased linearly (gamma = 1) to improve visibility for CD105 and FABP4. Scale bar: 75 µm.

References

    1. Harbeck N, et al. Breast cancer. Nat. Rev. Dis. Prim. 2019;5:66. doi: 10.1038/s41572-019-0111-2. - DOI - PubMed
    1. Turashvili G, Brogi E. Tumor heterogeneity in breast cancer. Front. Med. 2017;4:227–227. doi: 10.3389/fmed.2017.00227. - DOI - PMC - PubMed
    1. Koren S, Bentires-Alj M. Breast tumor heterogeneity: Source of fitness, hurdle for therapy. Mol. Cell. 2015;60:537–546. doi: 10.1016/j.molcel.2015.10.031. - DOI - PubMed
    1. Azizi E, et al. Single-cell map of diverse immune phenotypes in the breast tumor microenvironment. Cell. 2018;174:1293–1308 e1236. doi: 10.1016/j.cell.2018.05.060. - DOI - PMC - PubMed
    1. Bartoschek M, et al. Spatially and functionally distinct subclasses of breast cancer-associated fibroblasts revealed by single cell RNA sequencing. Nat. Commun. 2018;9:5150. doi: 10.1038/s41467-018-07582-3. - DOI - PMC - PubMed

Publication types