. 2022 Sep 20;22(1):743.
doi: 10.1186/s12879-022-07703-w.

COVID's collateral damage: likelihood of measles resurgence in the United States

Affiliations

COVID's collateral damage: likelihood of measles resurgence in the United States

Mugdha Thakur et al. BMC Infect Dis. .

Abstract

Background: Lockdowns imposed throughout the US to control the COVID-19 pandemic led to a decline in all routine immunizations rates, including the MMR (measles, mumps, rubella) vaccine. It is feared that post-lockdown, these reduced MMR rates will lead to a resurgence of measles.

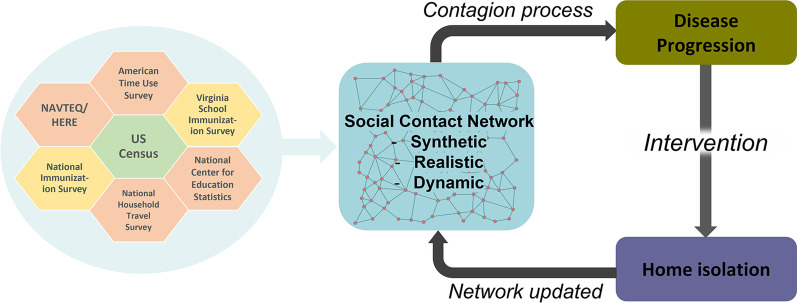
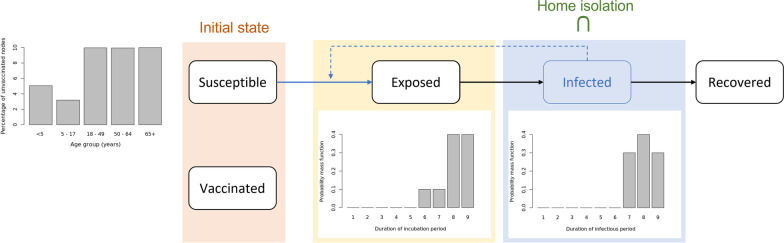
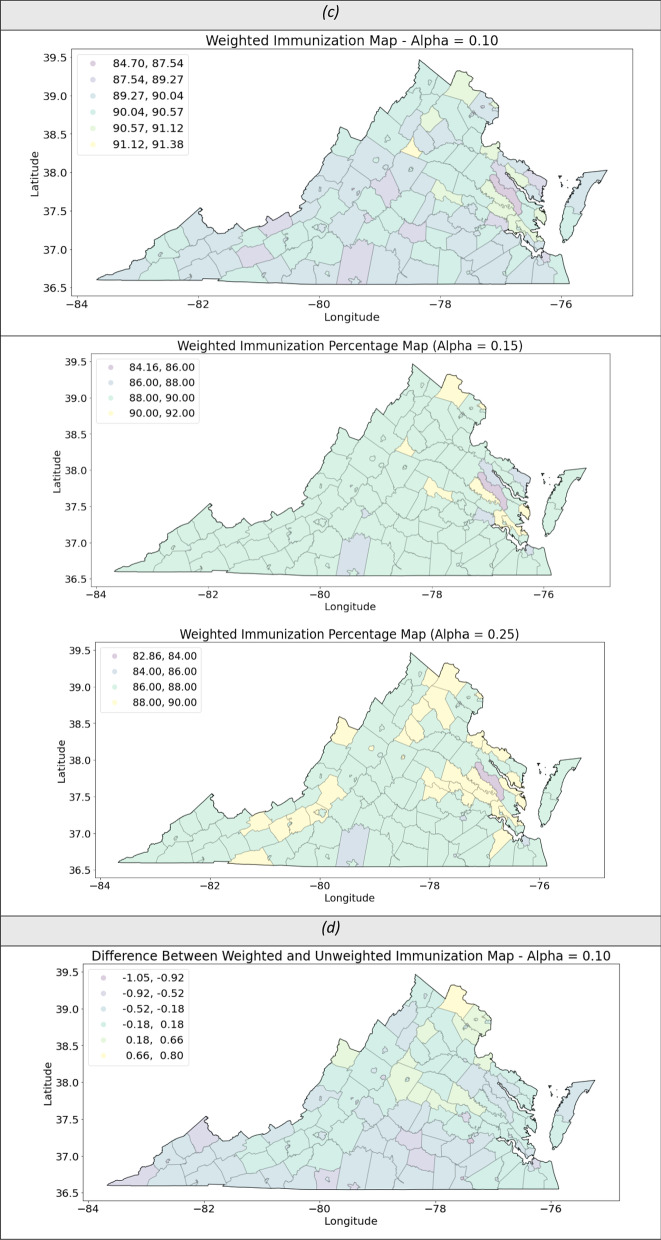
Methods: To measure the potential impact of reduced MMR vaccination rates on measles outbreak, this research examines several counterfactual scenarios in pre-COVID-19 and post-COVID-19 era. An agent-based modeling framework is used to simulate the spread of measles on a synthetic yet realistic social network of Virginia. The change in vulnerability of various communities to measles due to reduced MMR rate is analyzed.

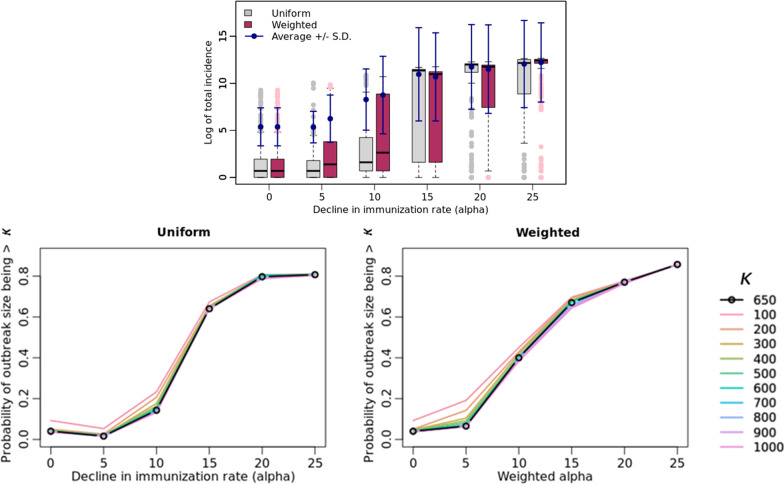
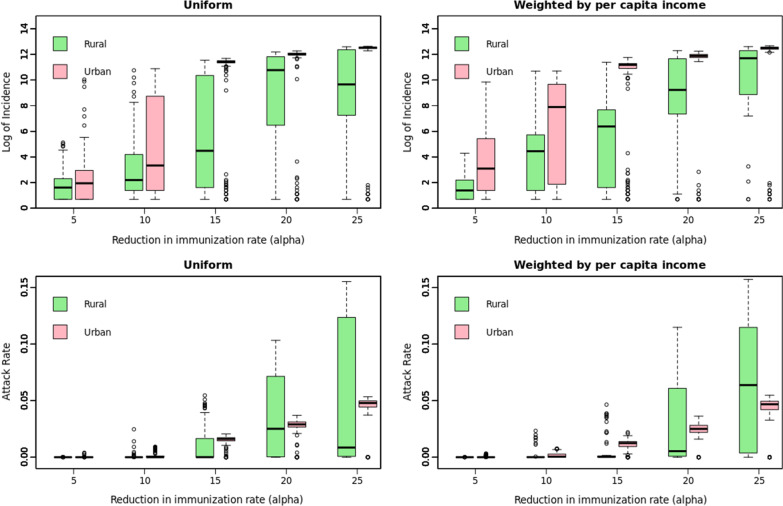
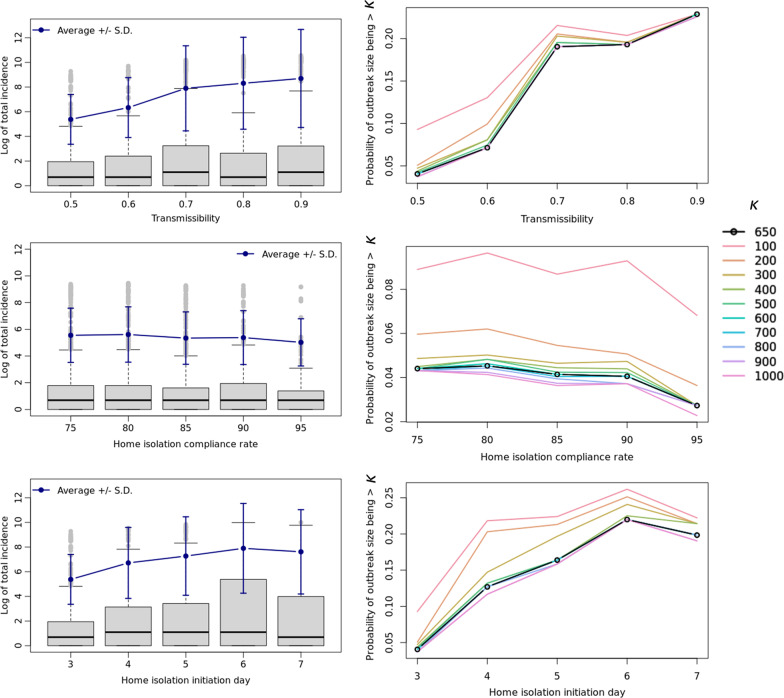
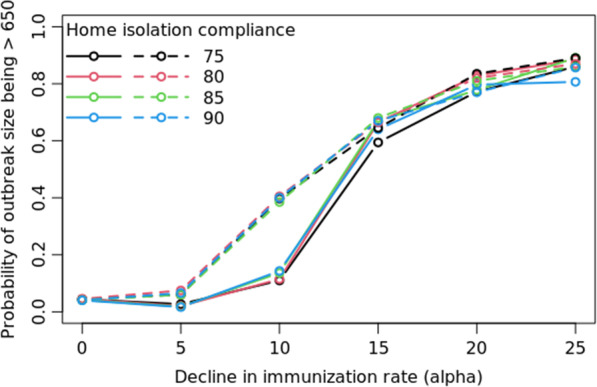
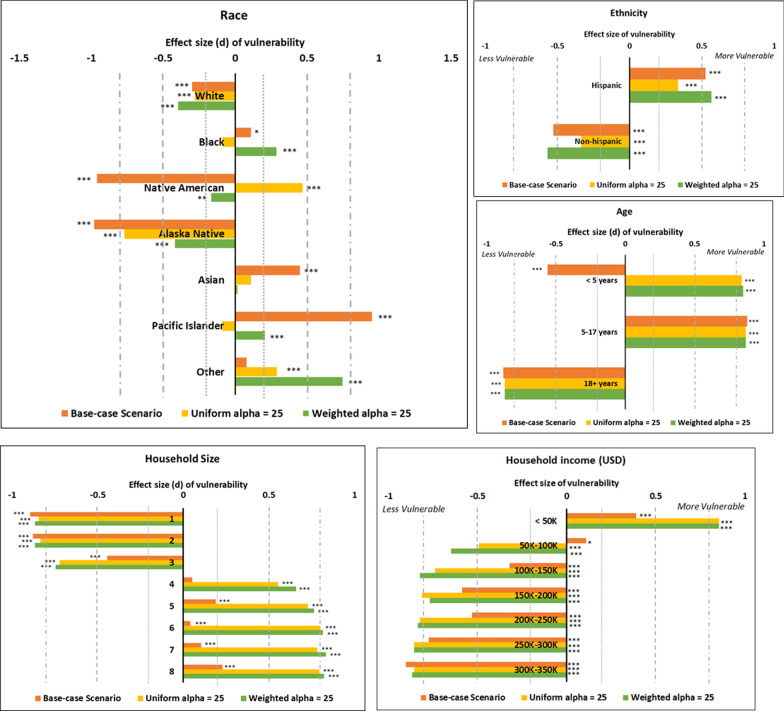
Results: Results show that a decrease in vaccination rate [Formula: see text] has a highly non-linear effect on the number of measles cases and this effect grows exponentially beyond a threshold [Formula: see text]. At low vaccination rates, faster isolation of cases and higher compliance to home-isolation are not enough to control the outbreak. The overall impact on urban and rural counties is proportional to their population size but the younger children, African Americans and American Indians are disproportionately infected and hence are more vulnerable to the reduction in the vaccination rate.

Conclusions: At low vaccination rates, broader interventions are needed to control the outbreak. Identifying the cause of the decline in vaccination rates (e.g., low income) can help design targeted interventions which can dampen the disproportional impact on more vulnerable populations and reduce disparities in health. Per capita burden of the potential measles resurgence is equivalent in the rural and the urban communities and hence proportionally equitable public health resources should be allocated to rural regions.

Keywords: Agent-based model; Health equity; Home isolation; MMR vaccination; NIS; Network epidemiology; Social network; Vulnerable populations.


Conflict of interest statement

The authors declare that they have no competing interests.

Figures

Fig. 1
Fig. 1
Design and flow of the model. Summary of the design and the flow of the model. Green hexagon (source for synthetic population), orange hexagons (sources for activity-based contact network) and yellow hexagons (sources for MMR immunization rate) show select sources of input data
Fig. 2
Fig. 2
Disease transmission flowchart. SEIR disease transmission model for measles. Only susceptible nodes can become exposed and infected. Exposed is the latent stage of Measles and Infected state comprises of the infectious period (presymptomatic incubation and rash)
Fig. 3
Fig. 3
Post-lockdown measles threat. Post-lockdown measles threat as a function of decline in childhood MMR immunization: effect of varying α on the distribution of outbreak on a logarithmic scale, (bottom) the probability of outbreak size bigger than a value κ (in the range of 100 to 1000 where κ= 650 represents the probability of outbreak bigger than that of NYC’s). α = 0 indicates the base-case scenario
Fig. 4
Fig. 4
Urban–rural divide. (Left) Uniform, (Right) Weighted, (Top) Logarithm of case counts, (Bottom) Proportion of case counts in rural (out of 1,901,192 individuals) and urban (5,786,867 individuals) regions, respectively
Fig. 5
Fig. 5
Effect of varying parameters. Effect of varying transmissibility, home isolation compliance rate and the day of initiation of home isolation since becoming infectious in the base case scenario on (left, logarithmic scale) the average measles outbreak size in Virginia, and (right) the probability that the measles outbreak will be bigger than κ (with κ in the range of 100 to 1000). The line for κ= 650 represents the probability of outbreak bigger than that of NYC’s
Fig. 6
Fig. 6
Effect of intervention in post-COVID scenarios. Probability that the measles outbreak will be bigger than NYC’s for varying α (reduction in childhood MMR rate; solid lines are for uniform and dashed for weighted α) for different rates of home isolation compliance. α = 0 indicates the base-case scenario
Fig. 7
Fig. 7
Vulnerability to measles by demographics. The figures show the results of the calculated effect size (d) through the Wilcoxon test. Values of d close to zero imply that the variable’s likelihood of measles burden is the least disproportionate in the population; values around 0.2 denotes small effect, around 0.5 a medium effect and around 0.8 a large effect [43, 44]. *: p < 0.05, **: p < 0.01, ***: p < 0.001
Fig. 8
Fig. 8
Decline in MMR rates. Spatial (county-wise) distribution of MMR immunization rates in the (a) base case (α=0); (b) post-COVID scenarios (α=10,15,25) when the decline in the immunization is random uniformly distributed over the population; (c) post-COVID scenarios (α=10,15,25) when the decline in the immunization is random uniformly distributed over the population when it is correlated with the household income (“weighted”); (d) the difference in the two types of distributions by county
Fig. 8
Fig. 8
Decline in MMR rates. Spatial (county-wise) distribution of MMR immunization rates in the (a) base case (α=0); (b) post-COVID scenarios (α=10,15,25) when the decline in the immunization is random uniformly distributed over the population; (c) post-COVID scenarios (α=10,15,25) when the decline in the immunization is random uniformly distributed over the population when it is correlated with the household income (“weighted”); (d) the difference in the two types of distributions by county

References

    1. Phadke VK, Bednarczyk RA, Salmon DA, Omer SB. Association between vaccine refusal and vaccine-preventable diseases in the United States: a review of measles and pertussis. JAMA. 2016;315(11):1149–1158. doi: 10.1001/jama.2016.1353. - DOI - PMC - PubMed
    1. Patel M, et al. National update on measles cases and outbreaks—United States, January 1–October 1, 2019. Morb Mortal Wkly Rep. 2019;68(40):893. doi: 10.15585/mmwr.mm6840e2. - DOI - PMC - PubMed
    1. Bramer CA, et al. Decline in child vaccination coverage during the COVID-19 pandemic—Michigan Care Improvement Registry, May 2016-May 2020. Am J Transplant. 2020;20(7):1930. doi: 10.1111/ajt.16112. - DOI - PMC - PubMed
    1. Santoli JM. Effects of the COVID-19 pandemic on routine pediatric vaccine ordering and administration—United States, 2020. MMWR. Morbidity and mortality weekly report. 2020;69. - PubMed
    1. Lassi ZS, Naseem R, Salam RA, Siddiqui F, Das JK. The impact of the COVID-19 pandemic on immunization campaigns and programs: a systematic review. Int J Environ Res Public Health. 2021;18(3):988. doi: 10.3390/ijerph18030988. - DOI - PMC - PubMed

Substances