. 2023 Feb;64(2):217-233.
doi: 10.1111/jcpp.13685. Epub 2022 Sep 20.

Transdiagnostic profiles of behaviour and communication relate to academic and socioemotional functioning and neural white matter organisation

Collaborators, Affiliations

Transdiagnostic profiles of behaviour and communication relate to academic and socioemotional functioning and neural white matter organisation

Silvana Mareva et al. J Child Psychol Psychiatry. 2023 Feb.

Abstract

Background: Behavioural and language difficulties co-occur in multiple neurodevelopmental conditions. Our understanding of these problems has arguably been slowed by an overreliance on study designs that compare diagnostic groups and fail to capture the overlap across different neurodevelopmental disorders and the heterogeneity within them.

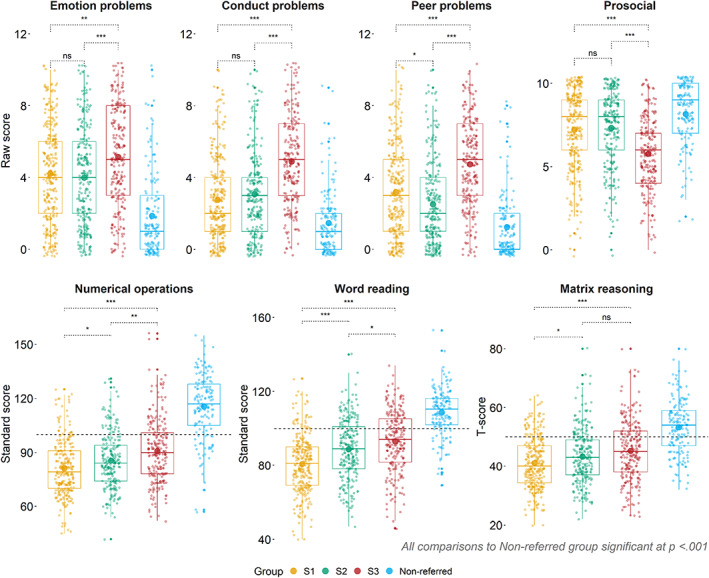
Methods: We recruited a large transdiagnostic cohort of children with complex needs (N = 805) to identify distinct subgroups of children with common profiles of behavioural and language strengths and difficulties. We then investigated whether and how these data-driven groupings could be distinguished from a comparison sample (N = 158) on measures of academic and socioemotional functioning and patterns of global and local white matter connectome organisation. Academic skills were assessed via standardised measures of reading and maths. Socioemotional functioning was captured by the parent-rated version of the Strengths and Difficulties Questionnaire.

Results: We identified three distinct subgroups of children, each with different levels of difficulties in structural language, pragmatic communication, and hot and cool executive functions. All three subgroups struggled with academic and socioemotional skills relative to the comparison sample, potentially representing three alternative but related developmental pathways to difficulties in these areas. The children with the weakest language skills had the most widespread difficulties with learning, whereas those with more pronounced difficulties with hot executive skills experienced the most severe difficulties in the socioemotional domain. Each data-driven subgroup could be distinguished from the comparison sample based on both shared and subgroup-unique patterns of neural white matter organisation. Children with the most pronounced deficits in language, cool executive, or hot executive function were differentiated from the comparison sample by altered connectivity in predominantly thalamocortical, temporal-parietal-occipital, and frontostriatal circuits, respectively.

Conclusions: These findings advance our understanding of commonly co-morbid behavioural and language problems and their relationship to behavioural outcomes and neurobiological substrates.

Keywords: Neurodevelopmental disorders; behaviour problems; communication; language; neural development.


Figures

Figure 1
Figure 1
Profiles of the data‐driven subgroups and the comparison group. Panel A shows group profiles across all BRIEF, Conners‐3, and CCC‐2 subscales used in the community detection. To put all measures on the same scale, age‐referenced subscale scores were converted to z‐scores where higher values indicate strengths and lower values indicate difficulties. Panel B shows the varimax loadings from Principal component analyses (PCA) of the CCC‐2 subscales based on combined data from the referred and comparison samples. The first principal component (PC1) explained 46% of the variance and was labelled Pragmatic communication, the second principal component (PC2) explained additional 34% of the variance and was labelled Structural language. Panel C shows the loadings from the same analyses applied to the BRIEF and Conners‐3 data. PC1 explained 37% of the variance and was labelled Cool EF and PC2 explained additional 31% of the variance and was labelled Hot EF. Panel D shows group performance across the four components identified in the PCA: higher values indicate strengths and lower values indicate difficulties. Comparisons are based on two‐tailed t‐tests, p‐values are Holm‐corrected. ***p < .001; **p < .01, *p < .05. S1 = Subgroup 1; S2 = Subgroup 2; S3 = Subgroup 3; Conners‐3 (Conners Parent Rating Short Form 3rd Edition) subscales; EF = Executive function; INT = Inattention; HYP = Hyperactivity/Impulsivity; LRN = Learning Problems; AGG = Aggression; PEER = Peer Relationships; BRIEF (Brief Rating Inventory of Executive Function) subscales: INH = Inhibition; SHIF =Shifting; EMO = Emotional Control; INIT = Initiation; WM = Working memory; PLAN = Planning/Organisation; ORG = Organisation of Materials; MONT = Monitoring; CCC‐2 (Children’s Communication Checklist 2) subscales: SYN = Syntax; SEM = Semantics; COH = Coherence; INAP = Inappropriate Initiation; STER = Stereotyped Language; CONT = Use of Context; NVER = Nonverbal Communication; SOC = Social Relations; INTR = Interests [Color figure can be viewed at wileyonlinelibrary.com]
Figure 2
Figure 2
Group comparisons across measures of socioemotional functioning, cognitive, and academic skills. The top panel includes the Emotion problems, Conduct problems, Peer problems, and Prosocial subscales derived from the Strengths and difficulties questionnaire (SDQ, parent‐report). Higher scores indicate more difficulties, except the Prosocial scale, which has the reverse interpretation. The bottom panel shows performance on the Word reading and Numerical operations subsets of the Wechsler Individual Achievement Test‐II, and the Matrix reasoning subset of Wechsler Abbreviated Scale of Intelligence II. All scores are based on the age‐referenced norms: higher scores indicate better performance. The grey‐dotted line represents the age‐expected mean. For both panels, the observed mean in each group is represented by the large dot within each boxplot. All comparisons are based on two‐tailed t‐tests, p‐values are Holm‐corrected. S1 = Subgroup 1 (most severe structural language difficulties); S2 = Subgroup 2 (most severe cool executive difficulties); S3 = Subgroup 3 (most severe difficulties with hot executive skills & pragmatic communication). ***p < .001; **p < .01, *p < .05 [Color figure can be viewed at wileyonlinelibrary.com]
Figure 3
Figure 3
Comparison of the regional strength of connections across groups. Panel A shows regions within the subcortex and the limbic network that showed reduced connection strength in all data‐driven subgroups relative to the comparison group. Panel B shows subcortical and limbic regions that had reduced connection strength in two subgroups relative to the comparison group. Note that non‐significant comparisons are omitted from the figure. Panel C1 shows subcortical and limbic regions that were significantly different between S1 and the comparison group. Panel C2 shows subcortical and limbic regions that were significantly different between S2 and the comparison group. Panel C3 shows subcortical and limbic regions that were significantly different between S3 and the comparison group. S1 = Subgroup 1 (most severe structural language difficulties); S2 = Subgroup 2 (most severe cool executive difficulties); S3 = Subgroup 3 (most severe difficulties with hot executive skills & pragmatic communication). See Tables S3 and S4 in the Supporting Information for descriptive statistics, p‐values, and effect sizes. [Color figure can be viewed at wileyonlinelibrary.com]
Figure 4
Figure 4
Subnetworks of the neural white matter connectome identified as significantly weaker in each data‐driven subgroup relative to the comparison group. Subgroup 1: most severe structural language difficulties; Subgroup 2: most severe cool executive difficulties; Subgroup 3: most severe difficulties with hot executive skills & pragmatic communication. Nodal labels in Tables S5‐S7 [Color figure can be viewed at wileyonlinelibrary.com]

References

    1. Agelink van Rentergem, J. A. , Bathelt, J. , & Geurts, H. M. (2021). Clinical subtyping using community detection: Limited utility? 10.31234/osf.io/9vnse - DOI - PMC - PubMed
    1. Alexander‐Bloch, A. , Clasen, L. , Stockman, M. , Ronan, L. , Lalonde, F. , Giedd, J. , & Raznahan, A. (2016). Subtle in‐scanner motion biases automated measurement of brain anatomy from in vivo MRI. Human Brain Mapping, 37, 2385–2397. - PMC - PubMed
    1. Ameis, S.H. , Lerch, J.P. , Taylor, M.J. , Lee, W. , Viviano, J.D. , Pipitone, J. , … Anagnostou, E. (2016). A diffusion tensor imaging studyin children with ADHD, autism spectrum disorder, OCD, and matched controls: Distinct and non‐distinct white matter disruption and dimensional brain‐behavior relationships. American Journal of Psychiatry, 173, 1213–1222. - PubMed
    1. American Psychiatric Association. (2013). Diagnostic and statistical manual of mental disorders (DSM‐5®). Washington, DC: American Psychiatric Association, Author.
    1. Amland, T. , Lervåg, A. , & Melby‐Lervåg, M. (2021). Comorbidity between math and Reading problems: Is phonological processing a mutual factor? Frontiers in Human Neuroscience, 14, 592. - PMC - PubMed

Publication types