A combination therapy strategy for treating antibiotic resistant biofilm infection using a guanidinium derivative and nanoparticulate Ag(0) derived hybrid gel conjugate
- PMID: 36128224
- PMCID: PMC9430544
- DOI: 10.1039/d2sc02980d
A combination therapy strategy for treating antibiotic resistant biofilm infection using a guanidinium derivative and nanoparticulate Ag(0) derived hybrid gel conjugate
Abstract
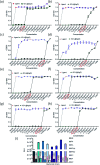
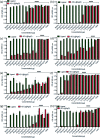
Bacteria organized in biofilms show significant tolerance to conventional antibiotics compared to their planktonic counterparts and form the basis for chronic infections. Biofilms are composites of different types of extracellular polymeric substances that help in resisting several host-defense measures, including phagocytosis. These are increasingly being recognized as a passive virulence factor that enables many infectious diseases to proliferate and an essential contributing facet to anti-microbial resistance. Thus, inhibition and dispersion of biofilms are linked to addressing the issues associated with therapeutic challenges imposed by biofilms. This report is to address this complex issue using a self-assembled guanidinium-Ag(0) nanoparticle (AD-L@Ag(0)) hybrid gel composite for executing a combination therapy strategy for six difficult to treat biofilm-forming and multidrug-resistant bacteria. Improved efficacy was achieved primarily through effective biofilm inhibition and dispersion by the cationic guanidinium ion derivative, while Ag(0) contributes to the subsequent bactericidal activity on planktonic bacteria. Minimum Inhibitory Concentration (MIC) of the AD-L@Ag(0) formulation was tested against Acinetobacter baumannii (25 μg mL-1), Pseudomonas aeruginosa (0.78 μg mL-1), Staphylococcus aureus (0.19 μg mL-1), Klebsiella pneumoniae (0.78 μg mL-1), Escherichia coli (clinical isolate (6.25 μg mL-1)), Klebsiella pneumoniae (clinical isolate (50 μg mL-1)), Shigella flexneri (clinical isolate (0.39 μg mL-1)) and Streptococcus pneumoniae (6.25 μg mL-1). Minimum bactericidal concentration, and MBIC50 and MBIC90 (Minimum Biofilm Inhibitory Concentration at 50% and 90% reduction, respectively) were evaluated for these pathogens. All these results confirmed the efficacy of the formulation AD-L@Ag(0). Minimum Biofilm Eradication Concentration (MBEC) for the respective pathogens was examined by following the exopolysaccharide quantification method to establish its potency in inhibition of biofilm formation, as well as eradication of mature biofilms. These effects were attributed to the bactericidal effect of AD-L@Ag(0) on biofilm mass-associated bacteria. The observed efficacy of this non-cytotoxic therapeutic combination (AD-L@Ag(0)) was found to be better than that reported in the existing literature for treating extremely drug-resistant bacterial strains, as well as for reducing the bacterial infection load at a surgical site in a small animal BALB/c model. Thus, AD-L@Ag(0) could be a promising candidate for anti-microbial coatings on surgical instruments, wound dressing, tissue engineering, and medical implants.
This journal is © The Royal Society of Chemistry.
Conflict of interest statement
There are no conflicts to declare.
Figures


Similar articles
-
Colistin potentiation in multidrug-resistant Acinetobacter baumannii by a non-cytotoxic guanidine derivative of silver.Front Microbiol. 2023 Jan 4;13:1006604. doi: 10.3389/fmicb.2022.1006604. eCollection 2022. Front Microbiol. 2023. PMID: 36687622 Free PMC article.
-
Halicin Is Effective Against Staphylococcus aureus Biofilms In Vitro.Clin Orthop Relat Res. 2022 Aug 1;480(8):1476-1487. doi: 10.1097/CORR.0000000000002251. Epub 2022 May 17. Clin Orthop Relat Res. 2022. PMID: 35583504 Free PMC article.
-
Antibacterial Properties and Efficacy of LL-37 Fragment GF-17D3 and Scolopendin A2 Peptides Against Resistant Clinical Strains of Staphylococcus aureus, Pseudomonas aeruginosa, and Acinetobacter baumannii In Vitro and In Vivo Model Studies.Probiotics Antimicrob Proteins. 2024 Jun;16(3):796-814. doi: 10.1007/s12602-023-10070-w. Epub 2023 May 6. Probiotics Antimicrob Proteins. 2024. PMID: 37148452
-
Evolving biofilm inhibition and eradication in clinical settings through plant-based antibiofilm agents.Phytomedicine. 2023 Oct;119:154973. doi: 10.1016/j.phymed.2023.154973. Epub 2023 Jul 17. Phytomedicine. 2023. PMID: 37499434 Review.
-
Nanotechnology as a therapeutic tool to combat microbial resistance.Adv Drug Deliv Rev. 2013 Nov;65(13-14):1803-15. doi: 10.1016/j.addr.2013.07.011. Epub 2013 Jul 24. Adv Drug Deliv Rev. 2013. PMID: 23892192 Review.
Cited by
-
Photothermal therapy for bacteria-infected wound healing via a cation-anion inverted antiperovskite with full-spectrum solar absorption.Chem Sci. 2025 Aug 4. doi: 10.1039/d5sc03456f. Online ahead of print. Chem Sci. 2025. PMID: 40766214 Free PMC article.
-
Colistin potentiation in multidrug-resistant Acinetobacter baumannii by a non-cytotoxic guanidine derivative of silver.Front Microbiol. 2023 Jan 4;13:1006604. doi: 10.3389/fmicb.2022.1006604. eCollection 2022. Front Microbiol. 2023. PMID: 36687622 Free PMC article.
-
Antibiotic Nanoparticles-Loaded Wound Dressings Against Pseudomonas aeruginosa's Skin Infection: A Systematic Review.Int J Nanomedicine. 2024 Aug 2;19:7895-7926. doi: 10.2147/IJN.S469724. eCollection 2024. Int J Nanomedicine. 2024. PMID: 39108405 Free PMC article.
References
LinkOut - more resources
Full Text Sources
Molecular Biology Databases

