. 2022 Aug 5:12:44.
doi: 10.25259/JCIS_62_2022. eCollection 2022.

Chordoma at the skull base, spine, and sacrum: A pictorial essay

Affiliations

Chordoma at the skull base, spine, and sacrum: A pictorial essay

Sin Hang Lee et al. J Clin Imaging Sci. .

Abstract

Chordomas are rare tumors believed to be arising from the notochord remnant in the axial skeleton. Diagnosis is often difficult since they show overlapping imaging features with other more common disease including metastases. Since individualized papers are only discussing the imaging features at different locations, the aim of this pictorial review is to have a comprehensive review on the common imaging findings of chordomas along the entire neuroaxis with a series of pathological proven cases in a local tertiary hospital in Hong Kong.

Keywords: Chordoma; Sacral tumor; Skull base tumor; Vertebral body tumor.


Conflict of interest statement

There are no conflicts of interest.

Figures

Figure 1:
Figure 1:
(a) Plain CT brain. Destructive clival mass involving the foramen magnum (black arrow). (b) Plain CT brain. The presence of intratumoral calcification. Extension of the mass into the foramen magnum with compression onto the medulla (black arrow).
Figure 2:
Figure 2:
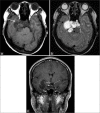
(a-c) Contrast MRI brain. A lobulated T1-weighted hypointense and T2-weighted hyperintense clival mass with moderate heterogeneous contrast enhancement, showing a honeycombing appearance (white arrows). (d) Contrast MRI brain. Extension of the mass into the foramen magnum with compression onto the brainstem. (e) Contrast MRI brain. Inferior extension with dens erosion (white arrows).
Figure 3:
Figure 3:
(a and b) Contrast MRI brain. Lateral extension of the mass into the right middle cranial fossa (white arrow), right cavernous sinus, and right petrous apex with compression onto the right mesial temporal lobe (black arrow). Posterior extension onto the midbrain was also evident (dotted black arrow). (c) Contrast MRI brain. Superior extension of the mass with compression on pituitary stalk and optic chiasm.
Figure 4:
Figure 4:
Plain CT brain. An lobulated mass centered at the right petroclival region (dark arrow) with extension into the right posterior ethmoid sinus and right sphenoid sinus (white arrow).
Figure 5:
Figure 5:
(a) Contrast MRI scan. Inferior extension into the right infratemporal fossa, abutting the pterygoid muscles (white arrow). (b) Contrast MRI scan. Encasement of the petrous and cavernous portion of the right internal carotid artery (white arrow).
Figure 6:
Figure 6:
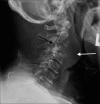
Lateral projection of cervical spine radiograph. Lytic cervical spine lesion at C3 level with partial vertebral collapse (black arrow). It was associated with prevertebral soft-tissue swelling spanning from C2 to C4 levels (white arrow).
Figure 7:
Figure 7:
(a) Plain CT cervical spine. Cervical spine tumor at C2–C3 levels. It was associated with prevertebral soft-tissue mass spanning across C2–C4 levels with intratumoral calcifications within (white arrow). There was epidural involvement at the anterior epidural space (black arrow). (b) Plain CT cervical spine. Bone destruction at C2 and C3 vertebrae. (c) Plain CT cervical spine. Involvement of the right C3 neuroforamen.
Figure 8:
Figure 8:
Contrast CT cervical spine. Encasement of the right vertebral artery which remained opacified (black arrow).
Figure 9:
Figure 9:
(a-c) MRI cervical spine. A T1-weighted hypointense and T2-weighted hyperintense cervical spine tumor with mild contrast enhancement. (d) The mass extended into and obliterated the anterior epidural space, demonstrating a draped curtain sign (white arrow). Normal T2-weighted flow void pattern of the right vertebral artery was preserved (dotted arrow).
Figure 10:
Figure 10:
PET-CT scan. An increase in SUV (SUVmax 6.9) was demonstrated.
Figure 11:
Figure 11:
(a and b) Frontal and lateral radiographs of the sacrum. Destructive lytic lesion sacral lesion, with better demonstration on the lateral view (black arrows).
Figure 12:
Figure 12:
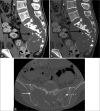
(a and b) Plain CT pelvis. Destructive sacral lytic lesion with soft-tissue mass containing intratumoral calcifications. (c) Plain CT pelvis. The mass eroded the right sacral foramen, extended across the right sacroiliac joint, and invaded the right iliac bone (white arrow). It also extended to the left sacroiliac joint (white dotted arrow).
Figure 13:
Figure 13:
(a-c) Contrast MRI pelvis. A lobulated sacral mass with T1-weighted isointense and T2-weighted hyperintense signal showing mild contrast enhancement. (d) Contrast MRI pelvis. It invaded the right sacroiliac joint and the right ilium (white arrow). There was also involvement of the left sacroiliac joint (white dotted arrow).
Figure 14:
Figure 14:
(a-c) Contrast MRI pelvis. Expansile pelvic mass centred at the sacrococcygeal junction showing a low to intermediate T1-weighted signal with presence of T1-weighted hyperintense foci indicating intralesional haemorrhage or proteinaceous contents high T2-weighted signal on fat-saturation images and moderate heterogeneous contrast enhancement. (d) Contrast MRI pelvis. Preserved intervening fat plane with the rectum anteriorly (white arrow). Focal breaching of tumour capsule invading into subcutaneous fat posteriorly (black arrow).
Figure 15:
Figure 15:
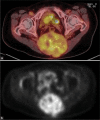
a and b PET-CT scan. An increase in uptake of the sacral tumour (SUVmax 6.7).

References

    1. Das P, Soni P, Jones J, Habboub G, Barnholtz-Sloan JS, Recinos PF, et al. Descriptive epidemiology of chordomas in the United States. J Neurooncol. 2020;148:173–8. doi: 10.1007/s11060-020-03511-x. - DOI - PubMed
    1. Miller BJ. Population-based registries are important in sarcoma: An editorial regarding incidence patterns of primary bone cancer in Taiwan (2003-2010) Ann Surg Oncol. 2014;21:2466–7. doi: 10.1245/s10434-014-3698-2. - DOI - PubMed
    1. Stacchiotti S, Sommer J, Chordoma Global Consensus Group Building a global consensus approach to chordoma: A position paper from the medical and patient community. Lancet Oncol. 2015;16:e71–83. doi: 10.1016/S1470-2045(14)71190-8. - DOI - PubMed
    1. Bakker SH, Jacobs WC, Pondaag W, Gelderblom H, Nout RA, Dijkstra PD, et al. Chordoma: A systematic review of the epidemiology and clinical prognostic factors predicting progression-free and overall survival. Eur Spine J. 2018;27:3043–58. doi: 10.1007/s00586-018-5764-0. - DOI - PubMed
    1. Sebro R, DeLaney T, Hornicek F, Schwab J, Choy E, Nielsen GP, et al. Differences in sex distribution, anatomic location and MR imaging appearance of pediatric compared to adult chordomas. BMC Med Imaging. 2016;16:53. doi: 10.1186/s12880-016-0149-5. - DOI - PMC - PubMed

LinkOut - more resources