All-atom molecular dynamics simulations of the combined effects of different phospholipids and cholesterol content on electroporation
- PMID: 36128384
- PMCID: PMC9425445
- DOI: 10.1039/d2ra03895a
All-atom molecular dynamics simulations of the combined effects of different phospholipids and cholesterol content on electroporation
Abstract
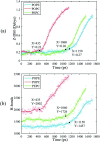
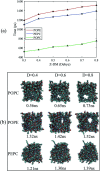
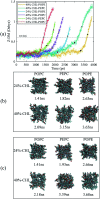
The electroporation mechanism could be related to the composition of the plasma membrane, and the combined effect of different phospholipid molecules and cholesterol content on electroporation has rarely been studied nor conclusions drawn. In this paper, we applied all-atom molecular dynamics (MD) simulations to study the effects of phospholipids and cholesterol content on bilayer membrane electroporation. The palmitoyloleoylphosphatidylcholine (POPC) model, palmitoyloleoylphosphatidylethanolamine (POPE) model, and a 1 : 1 mixed model of POPC and POPE called PEPC, were the three basic models used. An electric field of 0.45 V nm-1 was applied to nine models, which were the three basic models, each with three different cholesterol content values of 0%, 24%, and 40%. The interfacial water molecules moved under the electric field and, once the first water bridge formed, the rest of the water molecules would dramatically flood into the membrane. The simulation showed that a rapid rise in the Z-component of the average dipole moment of the interfacial water molecules (Z-DM) indicated the occurrence of electroporation, and the same increment of Z-DM represented a similar change in the size of the water bridge. With the same cholesterol content, the formation of the first water bridge was the most rapid in the POPC model, regarding the average electroporation time (t ep), and the average t ep of the PEPC model was close to that of the POPE model. We speculate that the differences in membrane thickness and initial number of hydrogen bonds of the interfacial water molecules affect the average t ep for different membrane compositions. Our results reveal the influence of membrane composition on the electroporation mechanism at the molecular level.
This journal is © The Royal Society of Chemistry.
Conflict of interest statement
There are no conflicts to declare.
Figures


Similar articles
-
Interface water dynamics and porating electric fields for phospholipid bilayers.J Phys Chem B. 2008 Oct 30;112(43):13588-96. doi: 10.1021/jp8027726. Epub 2008 Oct 7. J Phys Chem B. 2008. PMID: 18837540
-
A molecular dynamics study of phospholipid membrane electroporation induced by bipolar pulses with different intervals.Phys Chem Chem Phys. 2023 May 24;25(20):14096-14103. doi: 10.1039/d2cp04637g. Phys Chem Chem Phys. 2023. PMID: 37161819
-
Terahertz Electric Field-Induced Membrane Electroporation by Molecular Dynamics Simulations.J Membr Biol. 2018 Dec;251(5-6):681-693. doi: 10.1007/s00232-018-0045-8. Epub 2018 Aug 9. J Membr Biol. 2018. PMID: 30094474
-
Nanoscale, electric field-driven water bridges in vacuum gaps and lipid bilayers.J Membr Biol. 2013 Nov;246(11):793-801. doi: 10.1007/s00232-013-9549-4. Epub 2013 May 5. J Membr Biol. 2013. PMID: 23644990
-
The molecular basis of electroporation.BMC Biochem. 2004 Jul 19;5:10. doi: 10.1186/1471-2091-5-10. BMC Biochem. 2004. PMID: 15260890 Free PMC article.
Cited by
-
Molecular dynamics of electroporation and quantitative analysis of molecular transport.J Biol Phys. 2025 May 27;51(1):18. doi: 10.1007/s10867-025-09682-w. J Biol Phys. 2025. PMID: 40425985
-
Optimizing electroporation via pulse modulation: a molecular dynamics study.Eur Biophys J. 2025 Aug 21. doi: 10.1007/s00249-025-01793-5. Online ahead of print. Eur Biophys J. 2025. PMID: 40841485
-
Bidirectional Modulation on Electroporation Induced by Membrane Tension Under the Electric Field.ACS Omega. 2024 Dec 13;9(51):50458-50465. doi: 10.1021/acsomega.4c07396. eCollection 2024 Dec 24. ACS Omega. 2024. PMID: 39741851 Free PMC article.
References
-
- Weaver J. C. Chizmadzhev Y. Bioelectrochem. Bioenerg. 1996;41:135–160.
-
- Chen C. Smye S. Robinson M. Evans J. Med. Biol. Eng. Comput. 2006;44:5–14. - PubMed
-
- Muralidharan A. Rems L. Kreutzer M. T. Boukany P. E. Biochim. Biophys. Acta, Biomembr. 2021;1863:183468. - PubMed
-
- Tsong T. Y., in Electroporation of Cell Membranes, ed. E. Neumann, A. E. Sowers and C. A. Jordan, Springer US, Boston, MA, 1989, pp. 149–163
-
- Dev S. B. Rabussay D. P. Widera G. Hofmann G. A. IEEE Trans. Plasma Sci. 2000;28:206–223.
LinkOut - more resources
Full Text Sources

