

A smartphone-interfaced, low-cost colorimetry biosensor for selective detection of bronchiectasis via an artificial neural network
- PMID: 36128540
- PMCID: PMC9414259
- DOI: 10.1039/d2ra03769f
A smartphone-interfaced, low-cost colorimetry biosensor for selective detection of bronchiectasis via an artificial neural network
Abstract
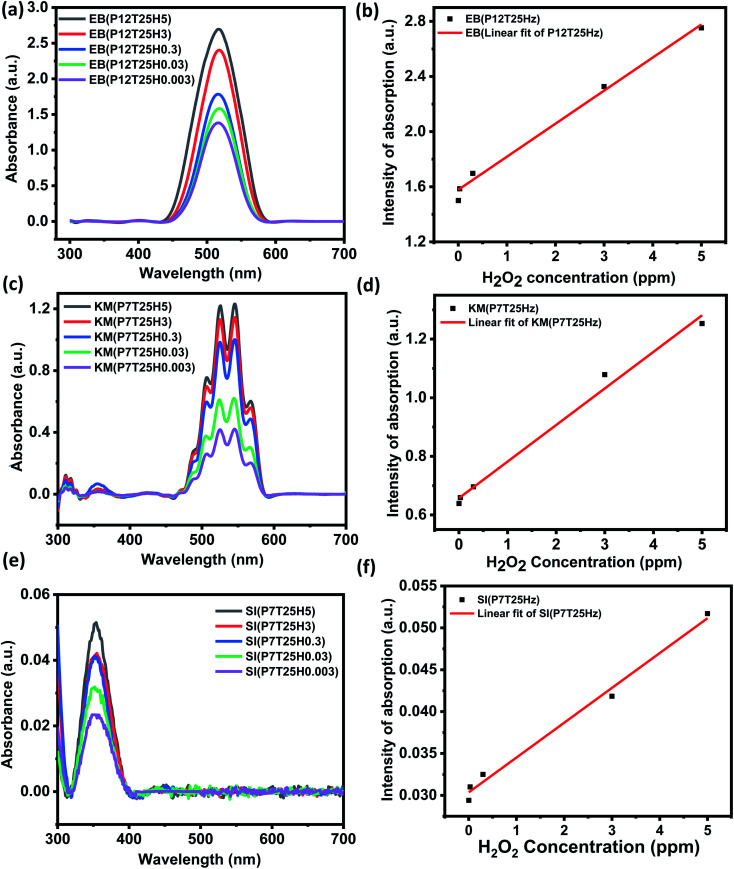
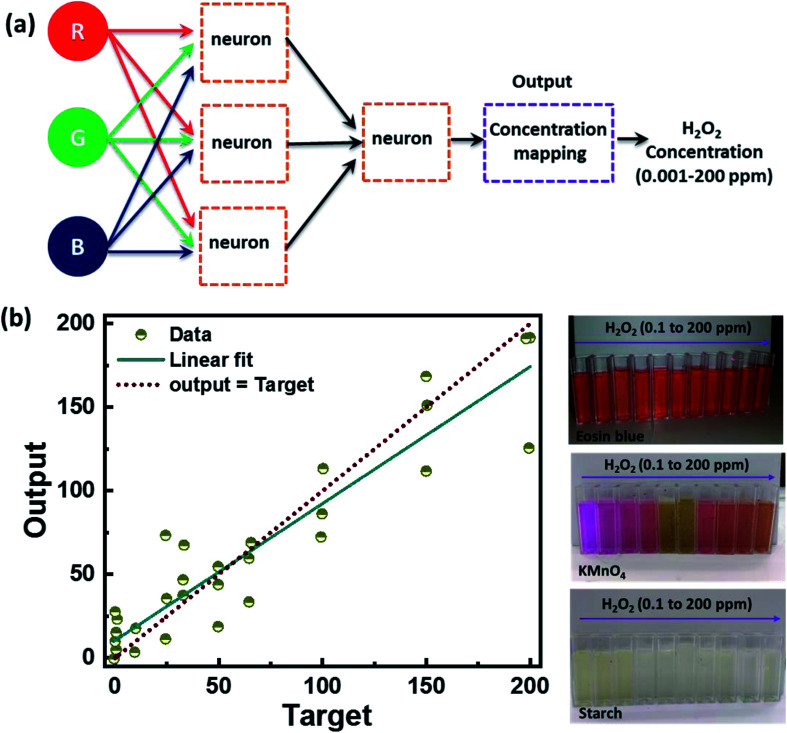
Exhaled breath (EB) contains several macromolecules that can be exploited as biomarkers to provide clinical information about various diseases. Hydrogen peroxide (H2O2) is a biomarker because it indicates bronchiectasis in humans. This paper presents a non-invasive, low-cost, and portable quantitative analysis for monitoring and quantifying H2O2 in EB. The sensing unit works on colorimetry by the synergetic effect of eosin blue, potassium permanganate, and starch-iodine (EPS) systems. Various sampling conditions like pH, response time, concentration, temperature and selectivity were examined. The UV-vis absorption study of the assay showed that the dye system could detect as low as ∼0.011 ppm levels of H2O2. A smart device-assisted detection unit that rapidly detects red, green and blue (RGB) values has been interfaced for practical and real-time application. The RGB value-based quantification of the H2O2 level was calibrated against NMR spectroscopy and exhibited a close correlation. Further, we adopted a machine learning approach to predict H2O2 concentration. For the evaluation, an artificial neural network (ANN) regression model returned 0.941 R 2 suggesting its great prospect for discrete level quantification of H2O2. The outcomes exemplified that the sensor could be used to detect bronchiectasis from exhaled breath.
This journal is © The Royal Society of Chemistry.
Conflict of interest statement
The authors declare that they have no conflict of interest.
Figures


Similar articles
-
Colorimetry-Based Detection of Nitric Oxide from Exhaled Breath for Quantification of Oxidative Stress in Human Body.Healthcare (Basel). 2021 Aug 17;9(8):1055. doi: 10.3390/healthcare9081055. Healthcare (Basel). 2021. PMID: 34442192 Free PMC article.
-
Paper-based colorimetric sensor using bimetallic Nickel-Cobalt selenides nanozyme with artificial neural network-assisted for detection of H2O2 on smartphone.Spectrochim Acta A Mol Biomol Spectrosc. 2024 Apr 15;311:124038. doi: 10.1016/j.saa.2024.124038. Epub 2024 Feb 13. Spectrochim Acta A Mol Biomol Spectrosc. 2024. PMID: 38364516
-
Smartphone colorimetric determination of hydrogen peroxide in real samples based on B, N, and S co-doped carbon dots probe.Anal Bioanal Chem. 2020 Feb;412(4):861-870. doi: 10.1007/s00216-019-02284-1. Epub 2019 Dec 21. Anal Bioanal Chem. 2020. PMID: 31865416
-
Porous materials applied to biomarker sensing in exhaled breath for monitoring and detecting non-invasive pathologies.Dalton Trans. 2020 Nov 10;49(43):15161-15170. doi: 10.1039/d0dt02511a. Dalton Trans. 2020. PMID: 33063796 Review.
-
Prospects and Challenges of MXenes as Emerging Sensing Materials for Flexible and Wearable Breath-Based Biomarker Diagnosis.Adv Healthc Mater. 2021 Oct;10(20):e2100970. doi: 10.1002/adhm.202100970. Epub 2021 Jul 28. Adv Healthc Mater. 2021. PMID: 34318999 Review.
Cited by
-
An efficient transition metal chalcogenide sensor for monitoring respiratory alkalosis.3 Biotech. 2023 Mar;13(3):109. doi: 10.1007/s13205-023-03497-z. Epub 2023 Mar 1. 3 Biotech. 2023. PMID: 36875961 Free PMC article.
References
LinkOut - more resources
Full Text Sources