

Scalable Constant pH Molecular Dynamics in GROMACS
- PMID: 36128977
- PMCID: PMC9558312
- DOI: 10.1021/acs.jctc.2c00516
Scalable Constant pH Molecular Dynamics in GROMACS
Abstract
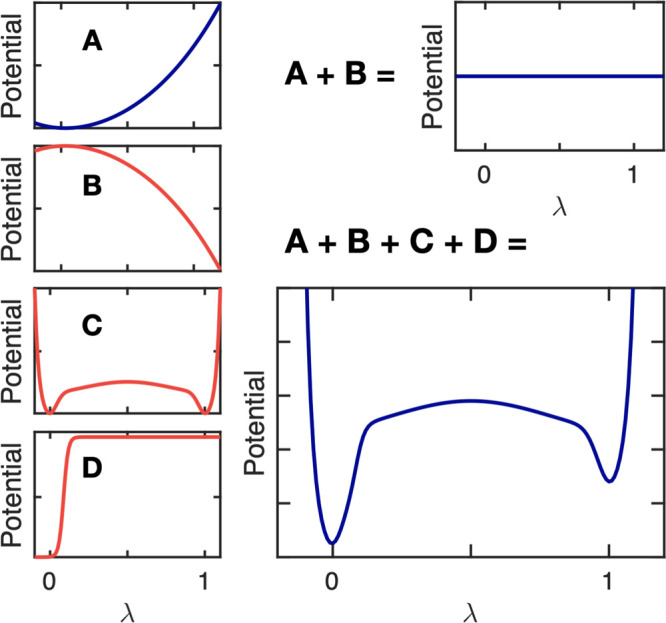
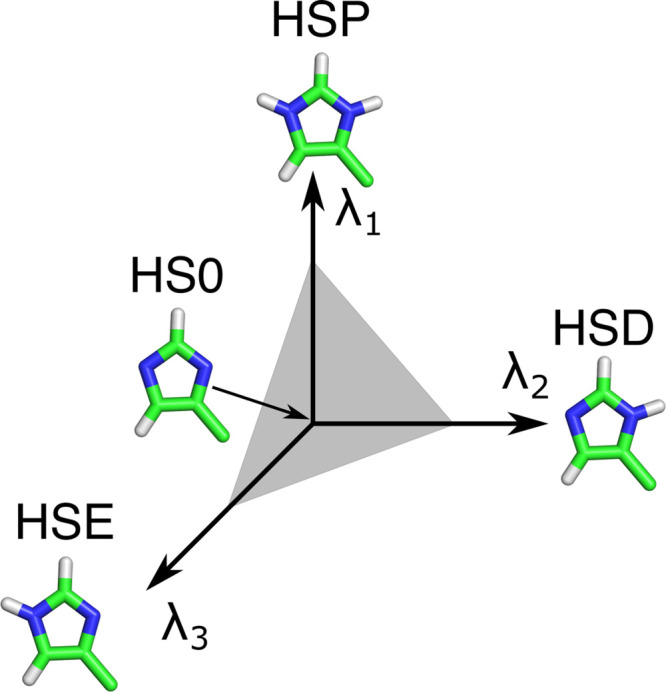
Molecular dynamics (MD) computer simulations are used routinely to compute atomistic trajectories of complex systems. Systems are simulated in various ensembles, depending on the experimental conditions one aims to mimic. While constant energy, temperature, volume, and pressure are rather straightforward to model, pH, which is an equally important parameter in experiments, is more difficult to account for in simulations. Although a constant pH algorithm based on the λ-dynamics approach by Brooks and co-workers [Kong, X.; Brooks III, C. L. J. Chem. Phys.1996, 105, 2414-2423] was implemented in a fork of the GROMACS molecular dynamics program, uptake has been rather limited, presumably due to the poor scaling of that code with respect to the number of titratable sites. To overcome this limitation, we implemented an alternative scheme for interpolating the Hamiltonians of the protonation states that makes the constant pH molecular dynamics simulations almost as fast as a normal MD simulation with GROMACS. In addition, we implemented a simpler scheme, called multisite representation, for modeling side chains with multiple titratable sites, such as imidazole rings. This scheme, which is based on constraining the sum of the λ-coordinates, not only reduces the complexity associated with parametrizing the intramolecular interactions between the sites but also is easily extendable to other molecules with multiple titratable sites. With the combination of a more efficient interpolation scheme and multisite representation of titratable groups, we anticipate a rapid uptake of constant pH molecular dynamics simulations within the GROMACS user community.
Conflict of interest statement
The authors declare no competing financial interest.
Figures

Similar articles
-
Constant pH Simulation with FMM Electrostatics in GROMACS. (B) GPU Accelerated Hamiltonian Interpolation.J Chem Theory Comput. 2025 Feb 25;21(4):1787-1804. doi: 10.1021/acs.jctc.4c01319. Epub 2025 Feb 7. J Chem Theory Comput. 2025. PMID: 39919130 Free PMC article.
-
phbuilder: A Tool for Efficiently Setting up Constant pH Molecular Dynamics Simulations in GROMACS.J Chem Inf Model. 2024 Feb 12;64(3):567-574. doi: 10.1021/acs.jcim.3c01313. Epub 2024 Jan 12. J Chem Inf Model. 2024. PMID: 38215282 Free PMC article.
-
Best Practices in Constant pH MD Simulations: Accuracy and Sampling.J Chem Theory Comput. 2022 Oct 11;18(10):6134-6147. doi: 10.1021/acs.jctc.2c00517. Epub 2022 Sep 15. J Chem Theory Comput. 2022. PMID: 36107791 Free PMC article.
-
Biomolecular simulations at constant pH.Curr Opin Struct Biol. 2005 Apr;15(2):157-63. doi: 10.1016/j.sbi.2005.02.002. Curr Opin Struct Biol. 2005. PMID: 15837173 Review.
-
Application of the molecular dynamics simulation GROMACS in food science.Food Res Int. 2024 Aug;190:114653. doi: 10.1016/j.foodres.2024.114653. Epub 2024 Jun 16. Food Res Int. 2024. PMID: 38945587 Review.
Cited by
-
Dynamic interchange between two protonation states is characteristic of active sites of cholinesterases.Protein Sci. 2024 Aug;33(8):e5100. doi: 10.1002/pro.5100. Protein Sci. 2024. PMID: 39022909 Free PMC article.
-
Molecular determinants of acrylamide neurotoxicity through covalent docking.Front Pharmacol. 2023 Mar 2;14:1125871. doi: 10.3389/fphar.2023.1125871. eCollection 2023. Front Pharmacol. 2023. PMID: 36937867 Free PMC article.
-
Constant pH Simulation with FMM Electrostatics in GROMACS. (A) Design and Applications.J Chem Theory Comput. 2025 Feb 25;21(4):1762-1786. doi: 10.1021/acs.jctc.4c01318. Epub 2025 Feb 7. J Chem Theory Comput. 2025. PMID: 39919102 Free PMC article.
-
Structural determinants for pH-dependent activation of a plant metacaspase.Nat Commun. 2025 May 29;16(1):4973. doi: 10.1038/s41467-025-60253-y. Nat Commun. 2025. PMID: 40442124 Free PMC article.
-
A constant pH molecular dynamics and experimental study on the effect of different pH on the structure of urease from Sporosarcina pasteurii.J Mol Model. 2025 May 19;31(6):164. doi: 10.1007/s00894-025-06369-w. J Mol Model. 2025. PMID: 40387959
References
-
- Alexov E.; Mehler E. L.; Baker N.; Baptista A. M.; Huang Y.; Milletti F.; Erik Nielsen J.; Farrell D.; Carstensen T.; Olsson M. H. M.; Shen J. K.; Warwicker J.; Williams S.; Word J. M. Progress in the prediction of pKa values in proteins. Proteins: Struct., Funct., Bioinf. 2011, 79, 3260–3275. 10.1002/prot.23189. - DOI - PMC - PubMed
MeSH terms
Substances
LinkOut - more resources
Full Text Sources