. 2022 Dec 1;28(23):5167-5179.
doi: 10.1158/1078-0432.CCR-22-1125.

Neoadjuvant Chemotherapy Is Associated with Altered Immune Cell Infiltration and an Anti-Tumorigenic Microenvironment in Resected Pancreatic Cancer

Affiliations

Neoadjuvant Chemotherapy Is Associated with Altered Immune Cell Infiltration and an Anti-Tumorigenic Microenvironment in Resected Pancreatic Cancer

Andressa Dias Costa et al. Clin Cancer Res. .

Abstract

Purpose: Neoadjuvant chemotherapy is increasingly administered to patients with resectable or borderline resectable pancreatic ductal adenocarcinoma (PDAC), yet its impact on the tumor immune microenvironment is incompletely understood.

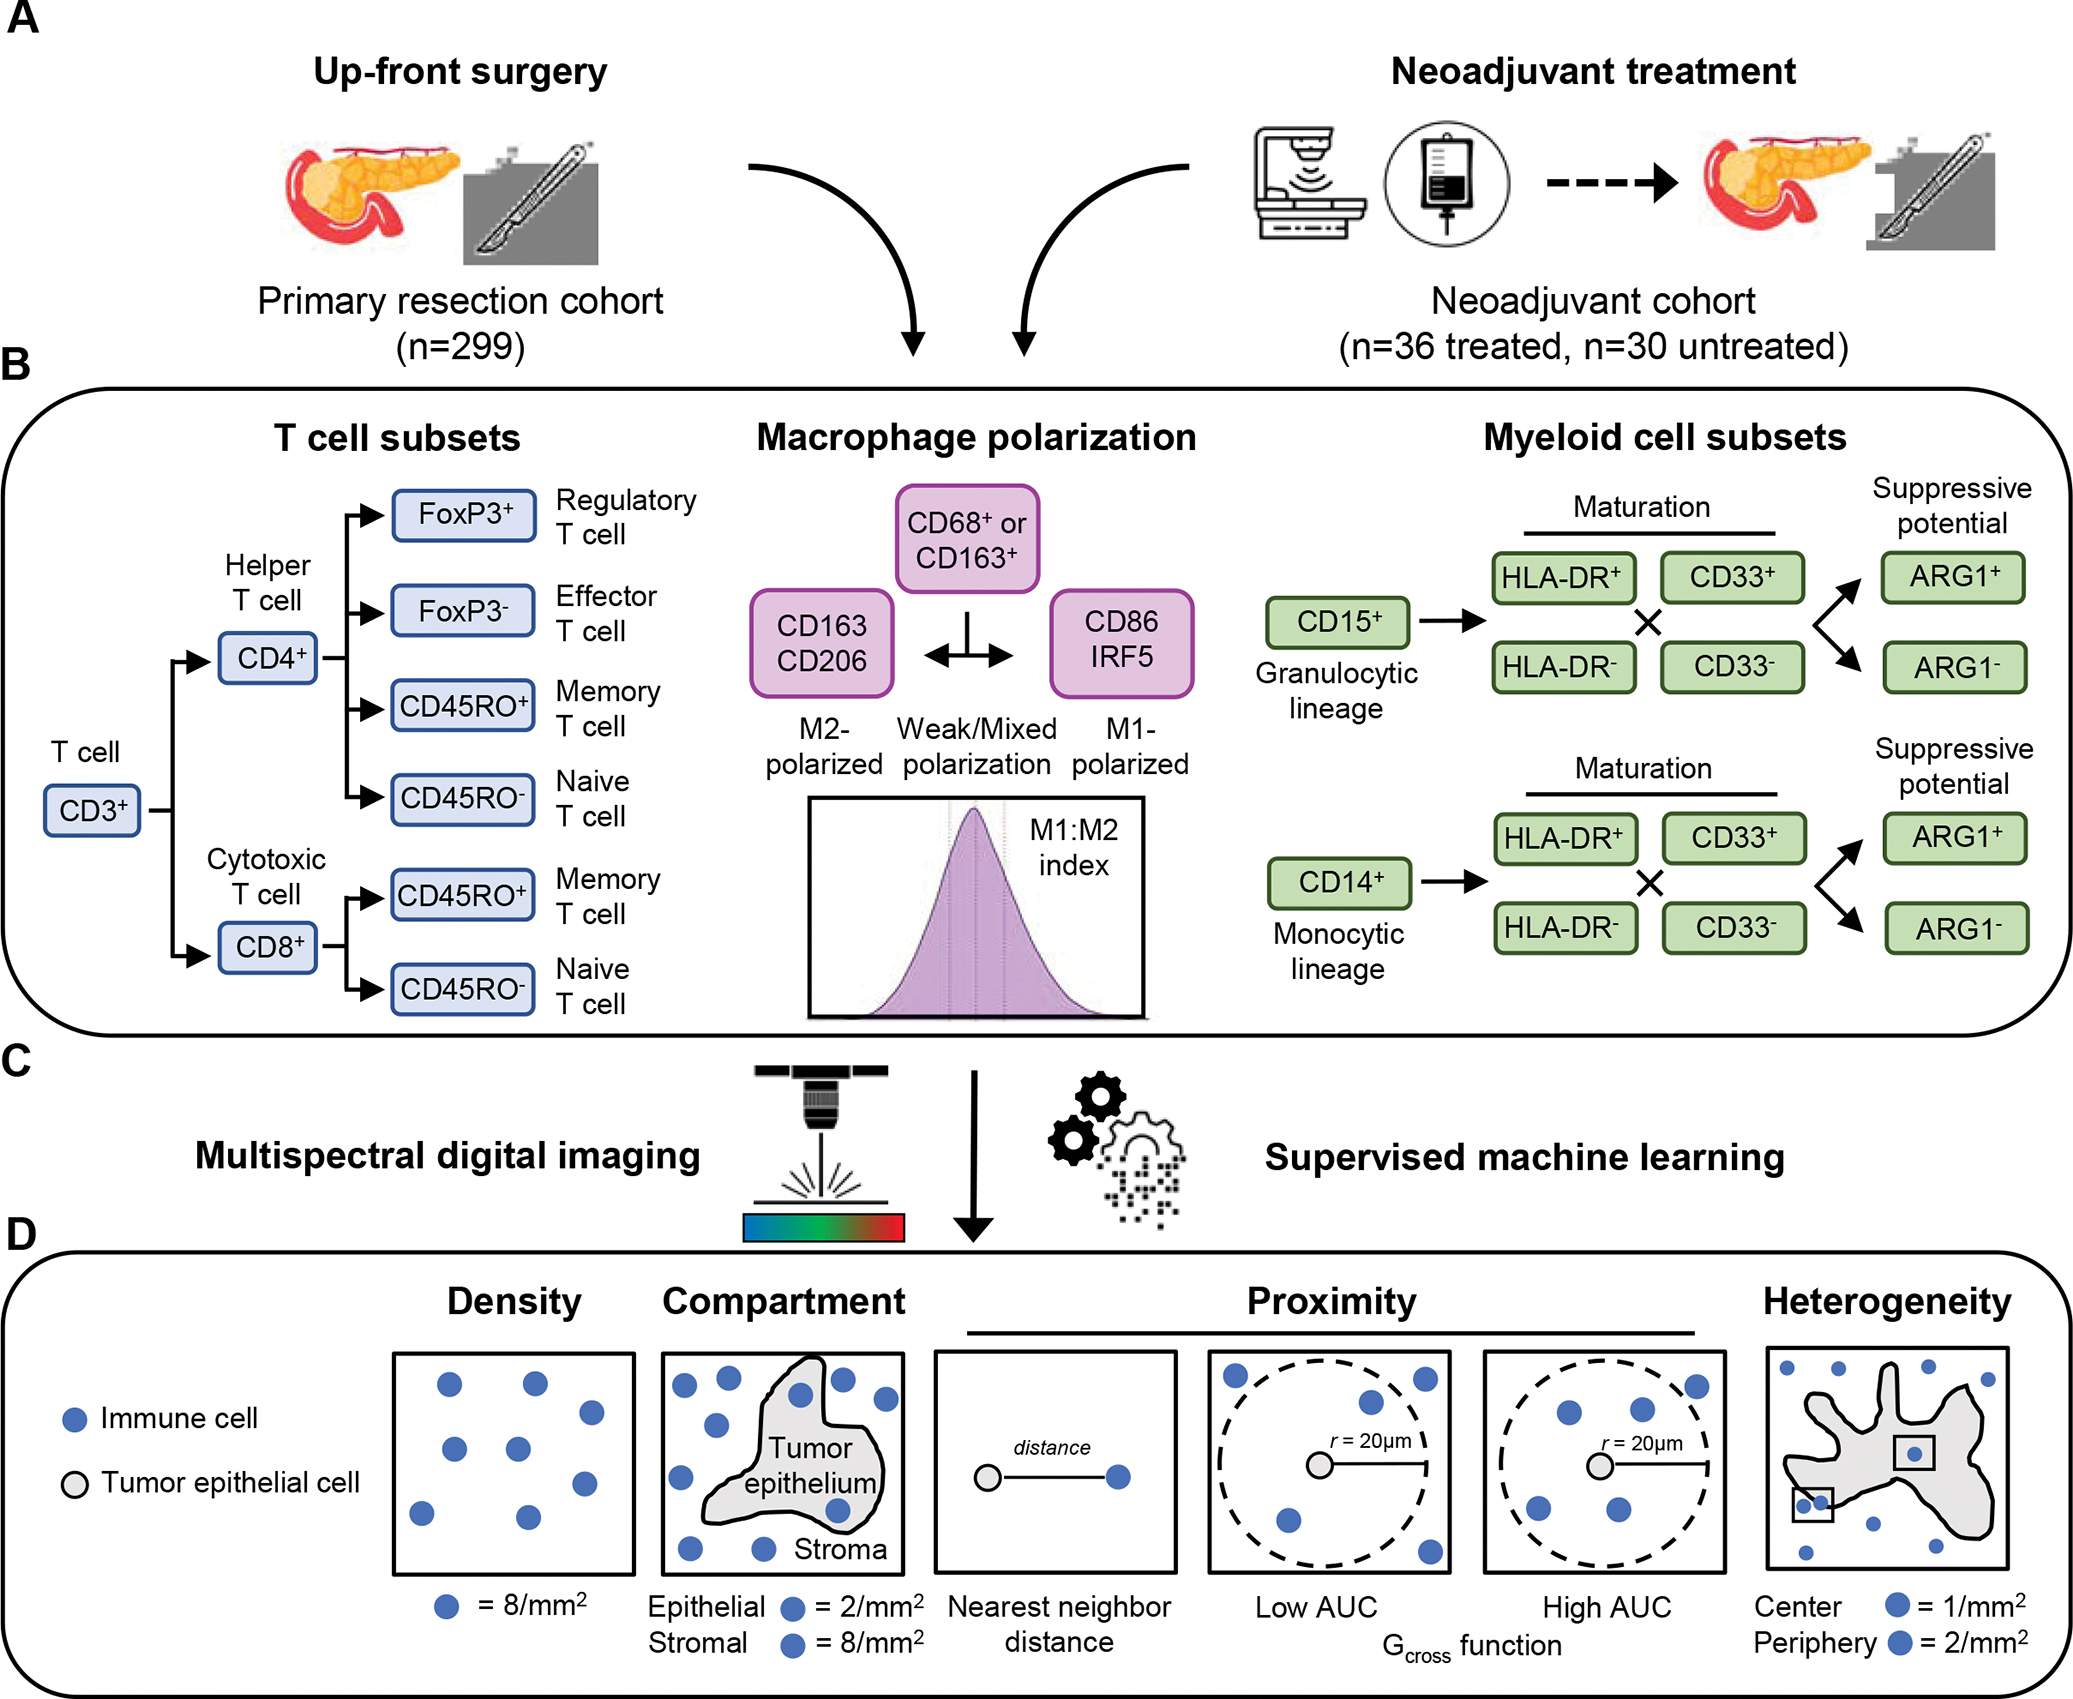
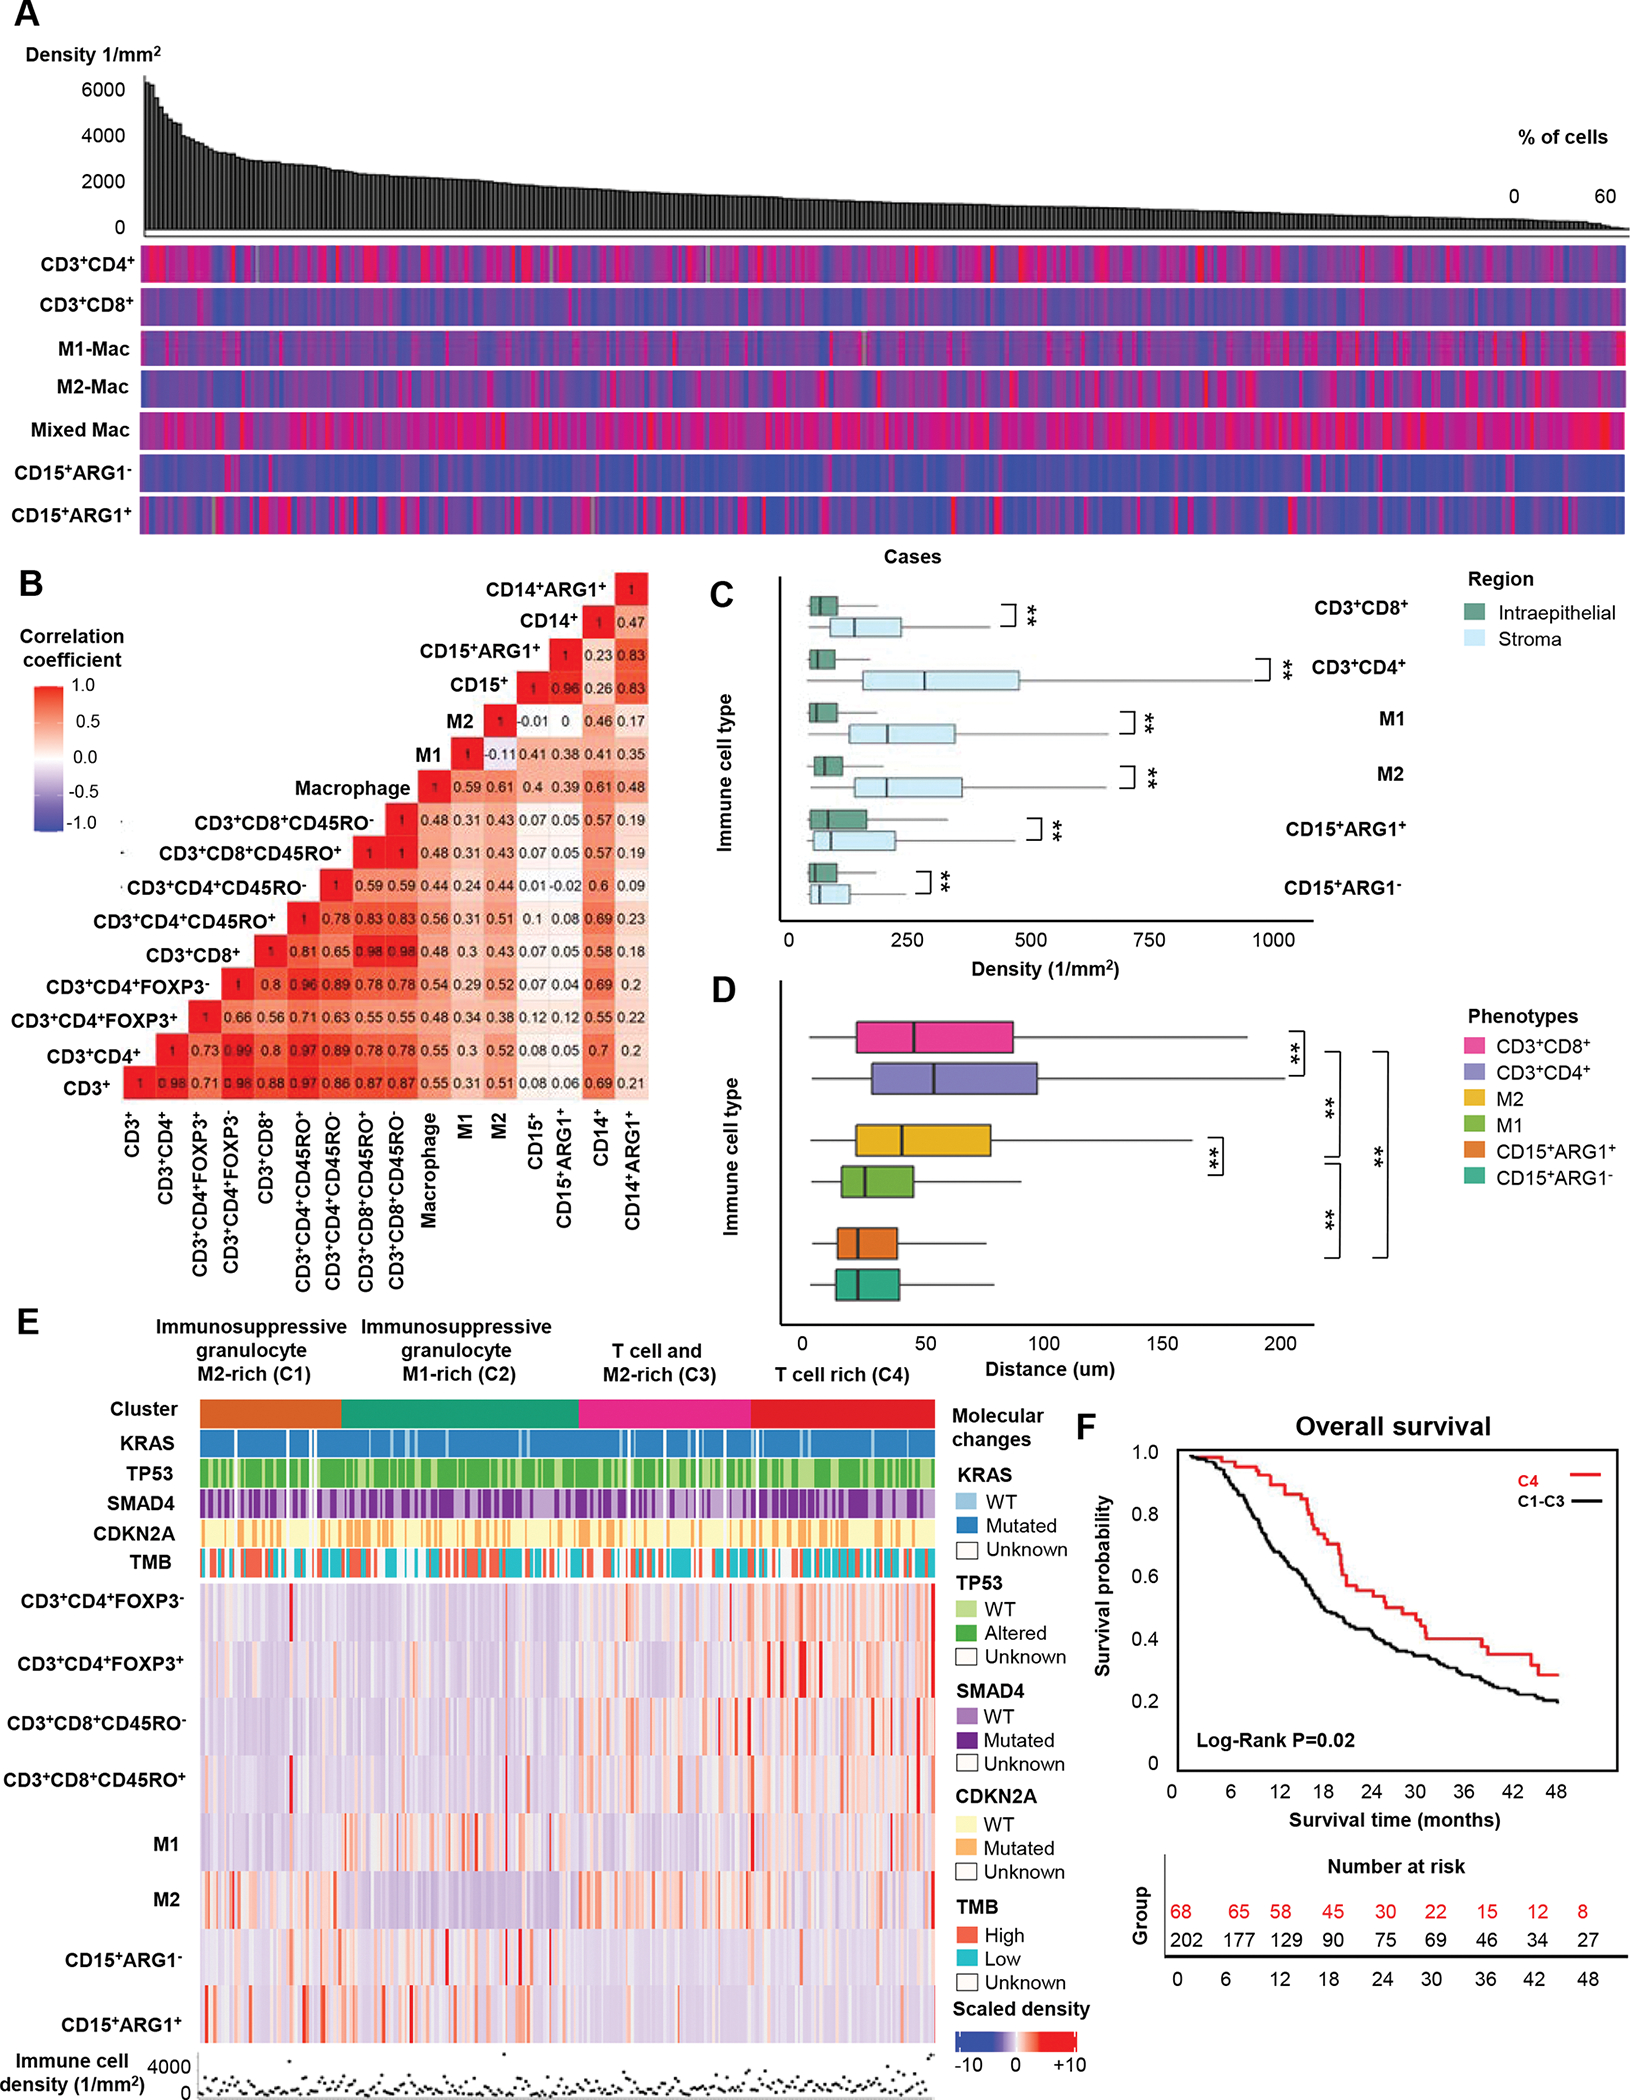
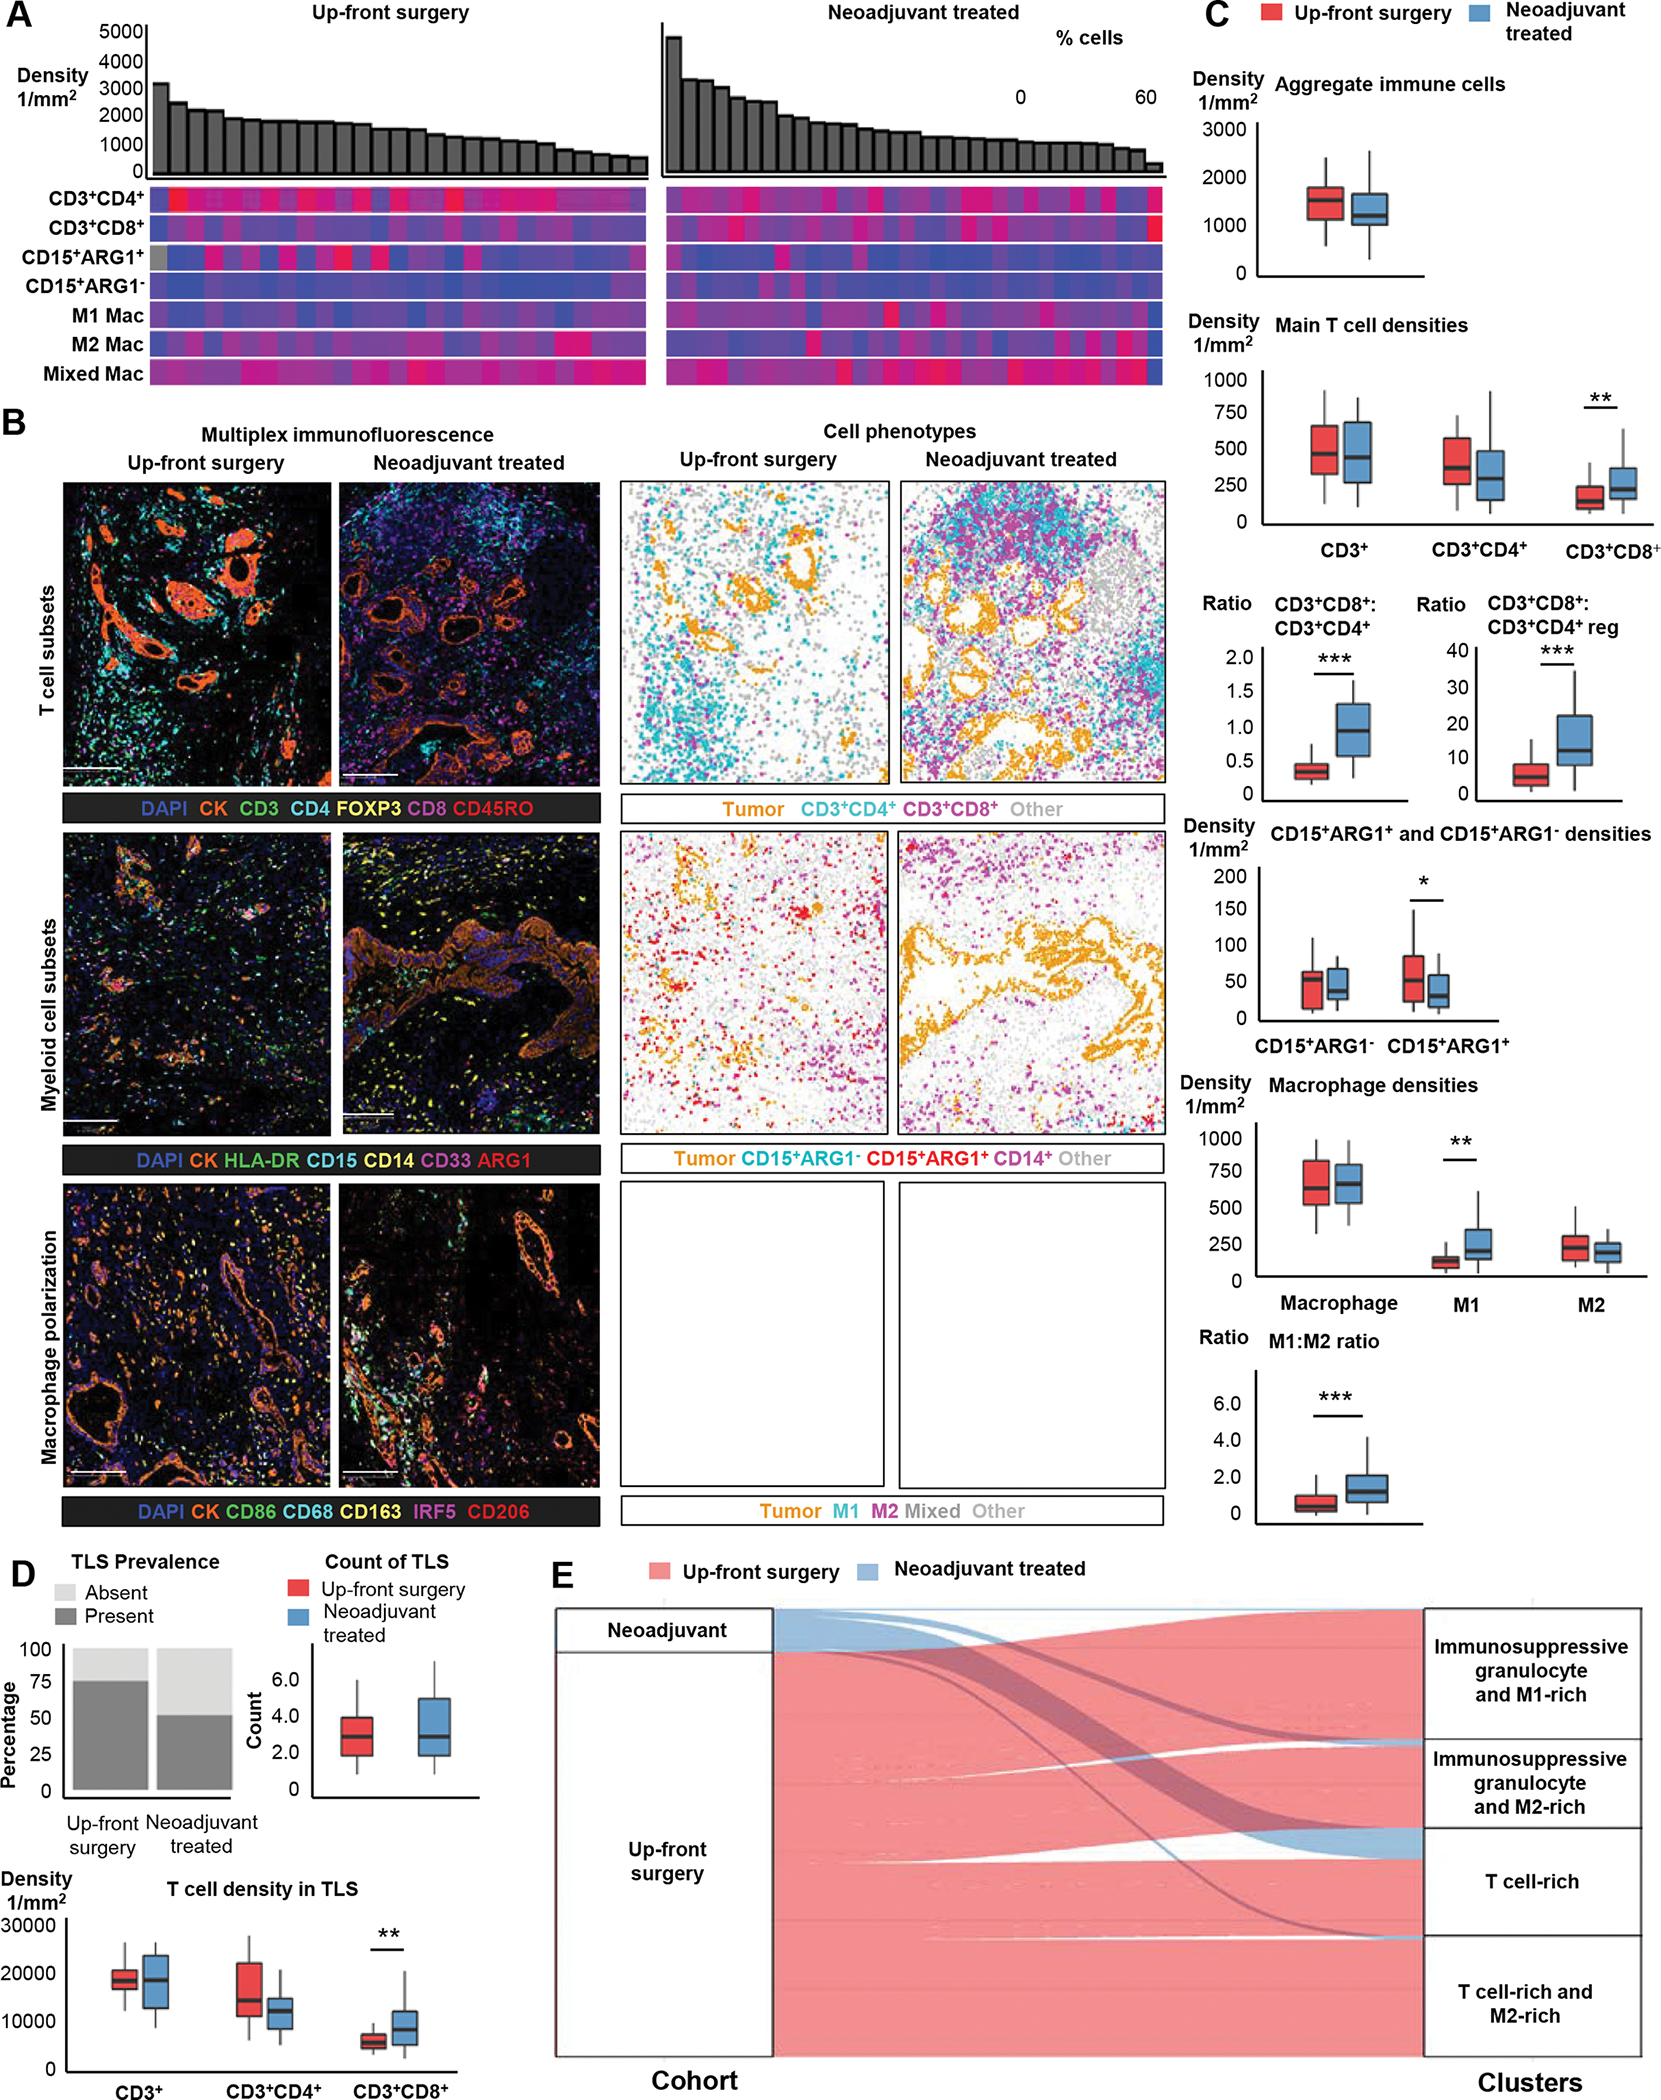
Design: We employed quantitative, spatially resolved multiplex immunofluorescence and digital image analysis to identify T-cell subpopulations, macrophage polarization states, and myeloid cell subpopulations in a multi-institution cohort of up-front resected primary tumors (n = 299) and in a comparative set of resected tumors after FOLFIRINOX-based neoadjuvant therapy (n = 36) or up-front surgery (n = 30). Multivariable-adjusted Cox proportional hazards models were used to evaluate associations between the immune microenvironment and patient outcomes.

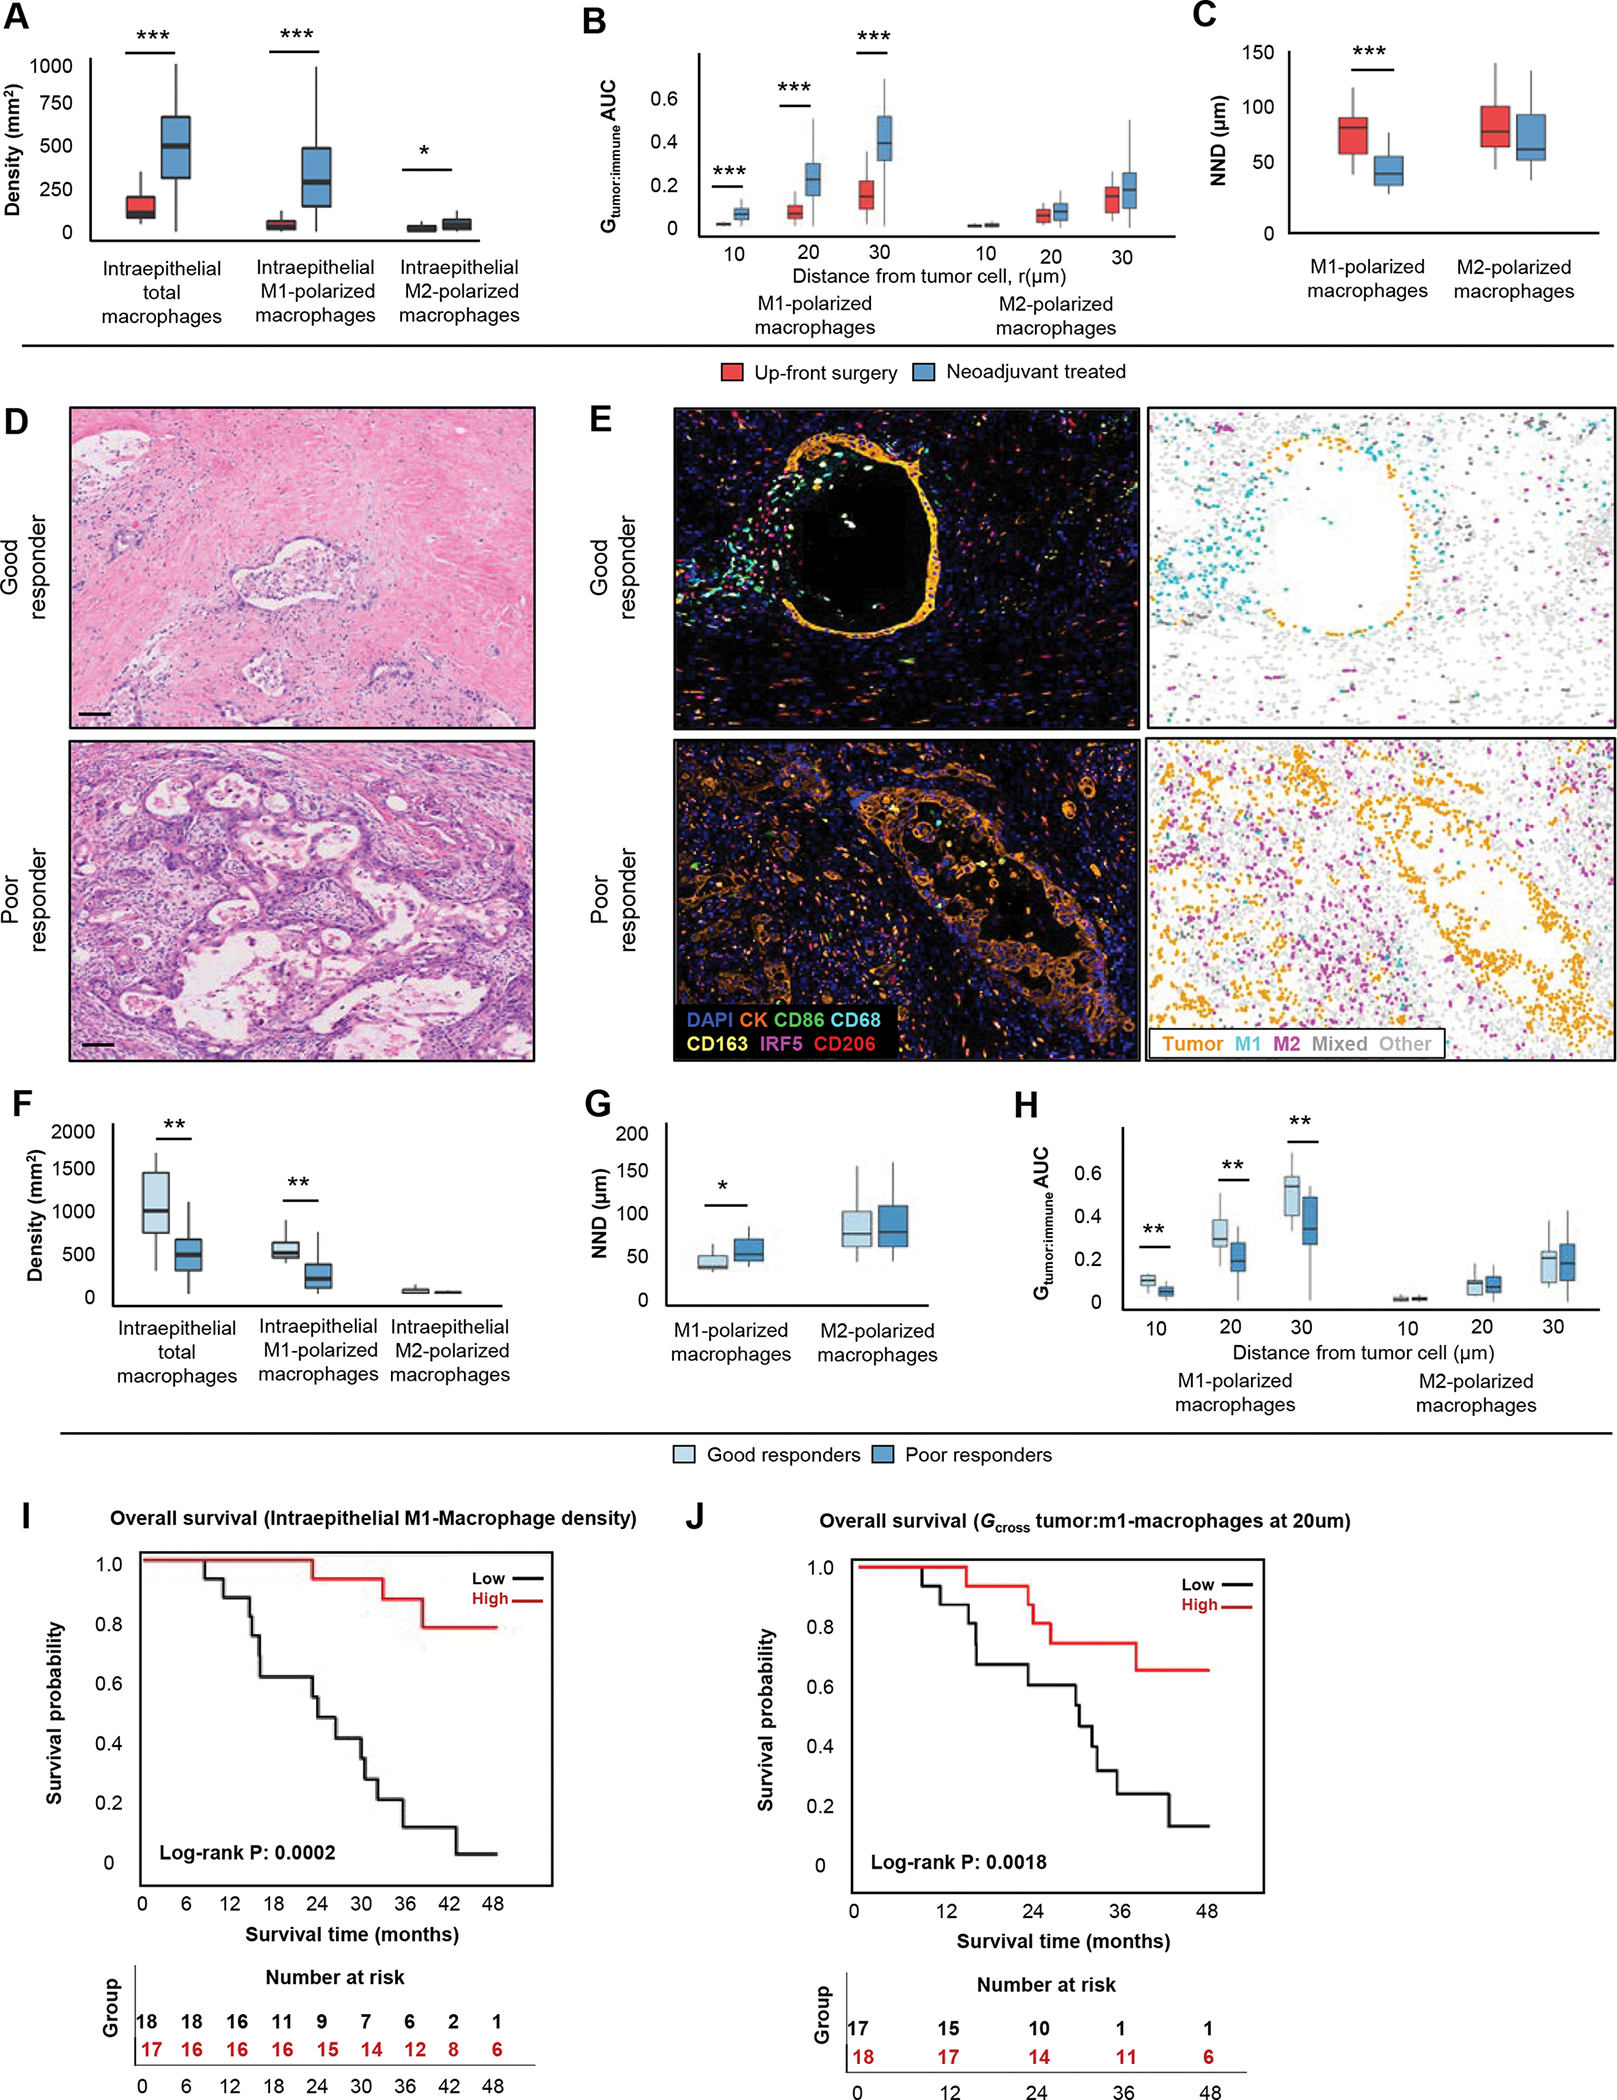
Results: In the multi-institutional resection cohort, immune cells exhibited substantial heterogeneity across patient tumors and were located predominantly in stromal regions. Unsupervised clustering using immune cell densities identified four main patterns of immune cell infiltration. One pattern, seen in 20% of tumors and characterized by abundant T cells (T cell-rich) and a paucity of immunosuppressive granulocytes and macrophages, was associated with improved patient survival. Neoadjuvant chemotherapy was associated with a higher CD8:CD4 ratio, greater M1:M2-polarized macrophage ratio, and reduced CD15+ARG1+ immunosuppressive granulocyte density. Within neoadjuvant-treated tumors, 72% showed a T cell-rich pattern with low immunosuppressive granulocytes and macrophages. M1-polarized macrophages were located closer to tumor cells after neoadjuvant chemotherapy, and colocalization of M1-polarized macrophages and tumor cells was associated with greater tumor pathologic response and improved patient survival.

Conclusions: Neoadjuvant chemotherapy with FOLFIRINOX shifts the PDAC immune microenvironment toward an anti-tumorigenic state associated with improved patient survival.


Conflict of interest statement

Conflict of interests: S.K.D. is a co-founder and SAB member for Kojin Therapeutics. R.F.D. served on Advisory Boards for Exelixis Inc. and Helsinn Healthcare S.A. A.J.A. has consulted for Oncorus, Inc., Arrakis Therapeutics, Syros Pharmaceuticals, Mirati Therapeutics, Boehringer Ingelheim, T-knife Therapeutics, AstraZeneca, Servier, and Merck & Co., Inc, and has research funding from Mirati Therapeutics, Syros Pharmaceuticals, Bristol Myers Squibb, Revolution Medicines, Novartis, Deerfield, Inc., and Novo Ventures that is unrelated to this work. B.M.W. has research funding from Celgene and Eli Lilly and consulting for BioLineRx, Celgene, G1 Therapeutics, and GRAIL. J.A.N. has research funding from NanoString, Illumina, and Akoya Biosciences. The other authors declare no potential conflicts of interest.

Figures

Figure 1.
Figure 1.. Overview of study cohort and analysis approach.
Two pancreatic ductal adenocarcinoma tissue cohorts were analyzed, including a primary resection cohort and a neoadjuvant-treatment cohort (A). T cell subsets (helper and cytotoxic T cells, including regulatory activity and naïve/memory status), differentially-polarized macrophages (M1- and M2-polarized macrophages, including strength of polarization) and myeloid cell subsets (granulocytes and monocytes, including maturity and ARG1 immunosuppressive activity) were evaluated using three multiplexed immunofluorescence panels (B). Combinatorial protein expression and cytomorphology data were analyzed by multispectral digital image analysis and supervised machine learning to identify specific cell types (C). Quantification of immune cell abundance was performed to measure immune cell densities overall and within separate tissue compartments (tumor epithelium or stroma); immune cell proximity to tumor cells was assessed by nearest neighbor distance (NND) and the Gcross function; and regions of interest were analyzed to assess immune cell heterogeneity (D).
Figure 2.
Figure 2.. Immune cell landscape in up-front resected pancreatic ductal adenocarcinoma (PDAC).
Immune cell distributions across 270 PDACs organized by decreasing total cell density (top grey bar plot). Heatmaps display the relative distributions (0–100%) of the non-overlapping immune cell populations within the total cell count. Subsets included in this analysis are displayed on the left. Macrophages with minimal polarization towards M1- or M2-phenotypes are classified as mixed (A). Spearman correlation coefficients for densities of major immune cell types and subtypes (B). Immune cell densities in tumor intraepithelial and stromal regions (C). Boxplots depicting distances between individual immune cells and the closest tumor cell based on a total of 886,315 immune cells (D). Unsupervised k-means clustering analysis of immune cell densities and their associations with the four main PDAC genetic alterations and tumor mutational burden (E). Kaplan-Meier survival curves comparing the T cell-rich cluster (C4) to a combined group of clusters C1-C3 (F). P values were calculated with the Wilcoxon rank-sum test and Kruskal-Wallis test. ** P <0.005
Figure 3.
Figure 3.. Associations of neoadjuvant therapy with immune cell profiles in the pancreatic cancer microenvironment.
Immune cell composition of 30 up-front resected pancreatic ductal adenocarcinomas (PDAC) and 36 cases that underwent neoadjuvant treatment (A). Examples of multiplex immunofluorescence images and corresponding phenoplots for T-cell subsets, myeloid cell subsets and macrophage polarization panel in up-front resected and neoadjuvant-treated PDACs (B). Boxplots depicting the distribution of overall (combined intraepithelial and stromal areas) immune cell densities in 30 up-front resected PDACs and 36 neoadjuvant-treated cases (C). Immune cell composition of tertiary lymphoid follicles in 23 up-front resected PDACs and 25 neoadjuvant-treated cases (D). Sankey plot depicting the relationship between neoadjuvant treatment status and the four main patterns of immune cell infiltration detected using unsupervised k-means clustering analysis across both the up-front resected and neoadjuvant cohorts (E). Scale bars represent 200μm. P values were calculated with Wilcoxon rank-sum test. ***: P <0.001, **: P <0.005, *: P <0.05
Figure 4.
Figure 4.. The association of neoadjuvant treatment with macrophage spatial composition in the pancreatic ductal adenocarcinoma (PDAC) microenvironment.
Macrophage densities in 29 up-front resected and 35 neoadjuvant-treated PDACs (A). Distribution of the immune cell-tumor cell Gcross proximity analysis and nearest neighbor distance (NND) in 29 up-front resected and 35 neoadjuvant-treated cases (B and C). Hematoxylin and eosin (D) and mIF stained tumors (E) show examples of good and poor histological response to treatment. Immune cell densities (F) and spatial analysis metrics in 10 cases with a good histologic response and 25 cases with a poor histologic response (G-H). Kaplan-Meier survival curves according to density of intraepithelial M1-polarized macrophages (I) and co-localization between tumor cells and M1-macrophages at 20 um using the Gcross function (J). Scale bars represent 100μm. P values were calculated with the Wilcoxon rank-sum test. ***: P <0.001, **: P <0.005, *: P <0.05

References

    1. Siegel RL, Miller KD, Fuchs HE, Jemal A. Cancer Statistics, 2021. CA Cancer J Clin. 2021;71(1):7–33. doi: 10.3322/caac.21654 - DOI - PubMed
    1. Nevala-Plagemann C, Hidalgo M, Garrido-Laguna I. From state-of-the-art treatments to novel therapies for advanced-stage pancreatic cancer. Nat Rev Clin Oncol. 2020;17(2):108–123. doi: 10.1038/s41571-019-0281-6 - DOI - PubMed
    1. Strobel O, Neoptolemos J, Jäger D, Büchler MW. Optimizing the outcomes of pancreatic cancer surgery. Nat Rev Clin Oncol. 2019;16(1):11–26. doi: 10.1038/s41571-018-0112-1 - DOI - PubMed
    1. Hu Q, Wang D, Chen Y, Li X, Cao P, Cao D. Network meta-analysis comparing neoadjuvant chemoradiation, neoadjuvant chemotherapy and upfront surgery in patients with resectable, borderline resectable, and locally advanced pancreatic ductal adenocarcinoma. Radiat Oncol. 2019;14(1):1–8. doi: 10.1186/s13014-019-1330-0 - DOI - PMC - PubMed
    1. Chawla A, Ferrone CR. Neoadjuvant therapy for resectable pancreatic cancer: An evolving paradigm shift. Front Oncol. 2019;9(OCT):10–13. doi: 10.3389/fonc.2019.01085 - DOI - PMC - PubMed

Publication types

MeSH terms